


A Look at Trends in Schools & School Districts
As with colleges and universities, local schools and school districts also are continuing to feel the effects of budget crunching—particularly cuts at the state level. State funding makes up more than 40 percent of school budgets, yet according to the Center on Budget and Policy Priorities, most states are providing less support per student for elementary and secondary schools than before the recession. In 31 states, total state funding per student was lower in 2014 than in 2008. What's more, capital spending to help build new schools or renovate and expand facilities, as well as equipping schools with modern technologies, also fell sharply. Elementary and high schools nationally cut capital spending by $28 billion, or 37 percent, between fiscal years 2008 and 2013, after adjusting for inflation.
The information provided by the 10.5 percent of the Industry Report survey respondents who represent schools and school districts obviously reflects these ongoing budgetary challenges.
Nearly half (48.2 percent) of school respondents were from the Midwest, by far the largest region represented in this category. They were followed by the Northeast, where 18.6 percent of school respondents are located. Smaller numbers came from the West (13.2 percent), South Central region (12.7 percent) and South Atlantic states (6.8 percent). Another 0.5 percent of school respondents said they were from outside the United States.
Nearly half (49.8 percent) of school respondents said they were located in rural communities. Another 36.9 percent were in suburban areas, and 13.7 percent were in urban communities.
On average, school respondents said they serve a population of 18,900 people, by far the smallest population size of any subcategory in the survey. More than three-quarters (78.7 percent) of school respondents said they serve a population of 20,000 or fewer people, compared with 42.9 percent of non-school respondents. Conversely, only 2.7 percent of school respondents said they had a population of 100,000 or more, compared with 21.4 percent of non-school respondents.
The vast majority of school respondents are with public schools. Some 93.2 percent said they were with public organizations, while 6.8 percent were with private nonprofits.
On average, school respondents said they manage 6.4 facilities.
School respondents were more likely than non-school respondents to report that they had partnered with outside organizations. Some 90 percent of school respondents had formed such partnerships, compared with 86.9 percent of non-school respondents. The most common partners for school respondents were: local schools (67.6 percent of school respondents said they partnered with other local schools); local government (53 percent); state government (44.3 percent); federal government (23.7 percent); and nonprofit organizations (21.9 percent).
School respondents were much more likely than others to report that the primary audience served by their facilities was made up of teenagers ages 13 to 18. Some 57 percent of school respondents said teens were their primary audience, compared with 4.1 percent of non-school respondents. Another 23.5 percent of school respondents said they served an all-ages audience, while 13.1 percent named children ages 4 to 12 as their primary audience.
Revenues & Expenditures
Schools continue to be the least likely to report that their revenues are increasing, and while the percentage reporting a decrease in revenues has fallen slightly in the past several years, school respondents are still more likely than many other respondents to be reporting decreases in revenues. From 2014 to 2015, just 12.5 percent of school respondents said their revenues had increased, while 13.4 percent said revenues dropped in that time frame. (See Figure 50.)
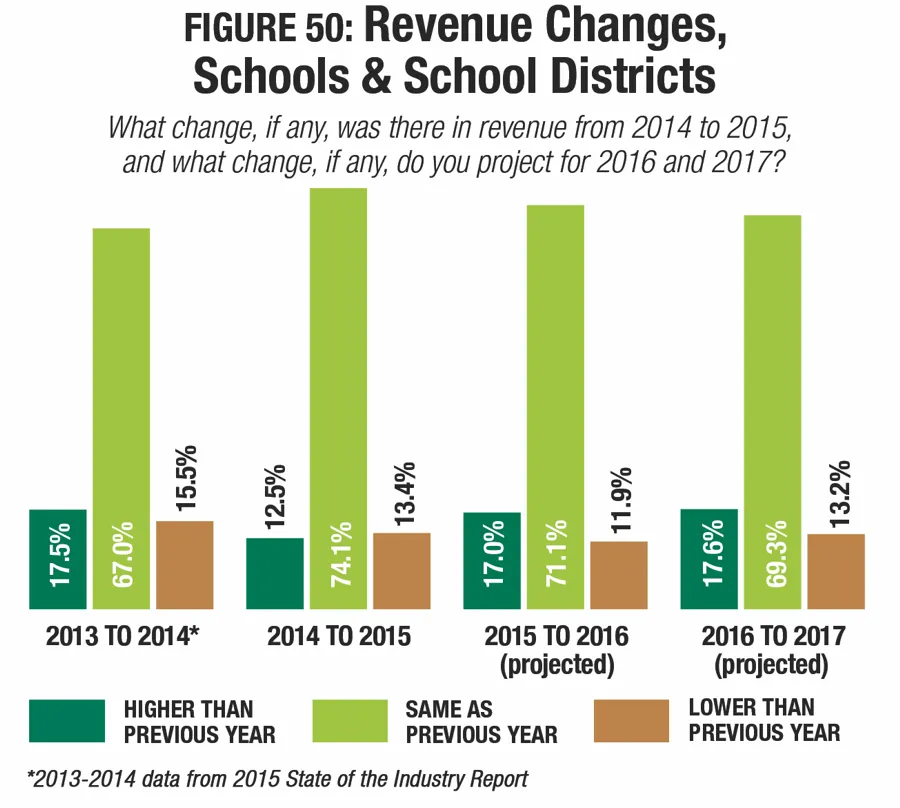
Looking forward, 17 percent of school respondents said they expect revenues to increase from 2015 to 2016, while 11.9 percent expect to see a decrease. And from 2016 to 2017, 17.6 percent are expecting an increase, while 13.2 percent projected a decrease.
School respondents also saw a sharper decline in their average operating expenditures from 2014 to 2015. While the general survey audience reported a decline of 2.6 percent, school respondents saw their operating expenditures drop 11.6 percent, from $1,710,000 in 2014 to $1,512,000 in 2015. Looking forward, schools are among the only respondents who expect operating expenditures to decrease from 2015 to 2017. While the general survey population is expecting an increase of 5.8 percent in that time period, school respondents projected a decrease of 4 percent, from $1,512,000 in fiscal 2015 to $1,451,000 in fiscal 2017.
School respondents report that they recover, on average, 32.4 percent of their operating costs via revenue. This compares with 49.6 percent of operating costs recovered via revenue for all respondents. Nearly one-half (49.3 percent) of school respondents reported that they recover 30 percent or less of their operating costs via revenue. Another 11.9 percent said they earn back 31 to 50 percent of their operating costs, and 5.9 percent said they recover 51 to 70 percent of their operating costs via revenue. Another 13.2 percent of school respondents said they recover 71 percent or more of their operating costs via revenue. A full 19.6 percent of school respondents did not know how much of their operating cost was recovered via revenue.
School respondents were less likely than non-school respondents to report that they had taken actions to reduce their operating costs, though a majority had done so. While 84.6 percent of non-school respondents said they had taken such action, 74.4 percent of school respondents had taken action to reduce expenditures. The most common measures employed by school respondents to reduce their operating costs included: improving energy efficiency (47.4 percent); reducing staff (27.4 percent); putting construction or renovation plans on hold (24.7 percent); increasing fees (17.7 percent); and cutting programs or services (17.7 percent).
School Facilities
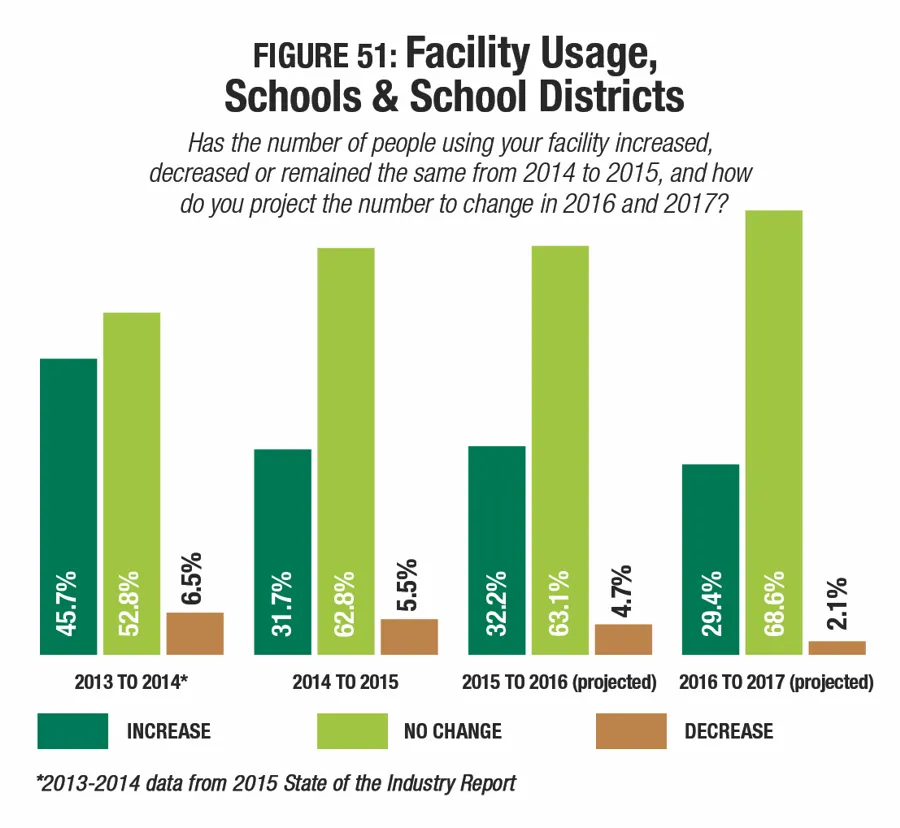
School respondents, as is generally the case, were among those most likely to report stable numbers of people using their facilities year-over-year. From 2014 to 2015, 62.8 percent of school respondents said the number of people using their facility stayed the same. Another 31.7 percent said usage increase, and 5.5 percent reported a decrease in that time period. (See Figure 51.) Looking forward, the trend holds, with 63.1 percent expecting usage to remain the same in 2016, and 68.6 percent expecting no change in 2017.
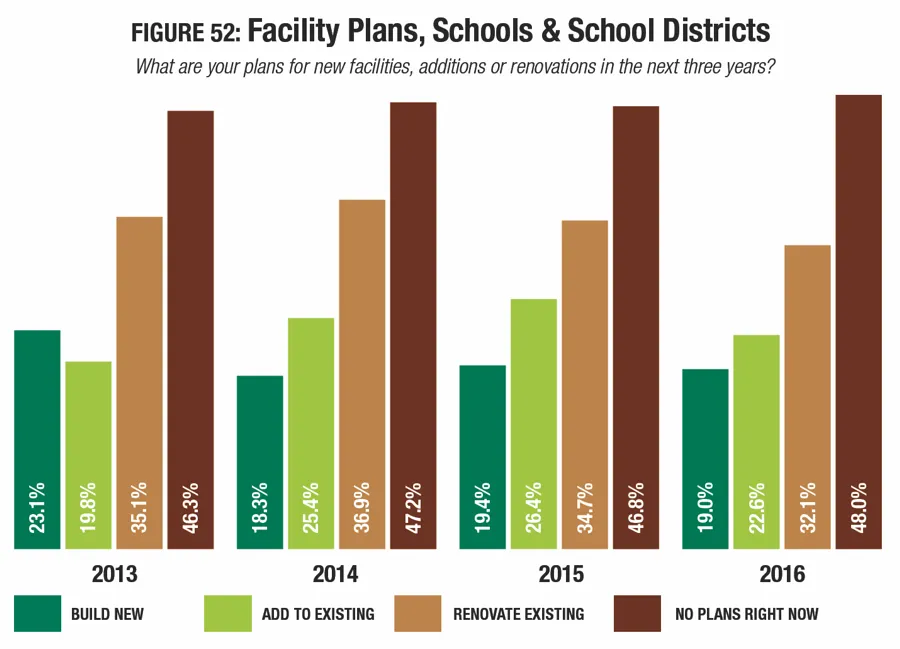
The percentage of school respondents who said they have plans for construction fell slightly in 2016. Slightly more than half (52 percent) of school respondents in 2016 said they have plans for construction, compared with 53.2 percent in 2015. Nearly one-third (32.1 percent) of school respondents said they are planning renovations to their existing facilities. Another 22.6 percent are planning additions, and 19 percent are planning to build new facilities. (See Figure 52.)
After reporting an 11.5 percent decrease to their school construction budgets from 2014 to 2015, school respondents again saw those budgets fall in 2016. School respondents' average budget for construction in 2016 is 12 percent lower than in 2015, at $4,920,000. That said, this is still 39.8 percent higher than the average for all respondents.
The features currently included among school respondents' facilities have remained very consistent over time. The 10 most common features currently found at their facilities include: locker rooms; bleachers and seating; indoor courts for sports like basketball and volleyball; natural turf sports fields, such as football and soccer fields; concession areas; classrooms and meeting rooms; outdoor running tracks; fitness centers; outdoor courts for sports like basketball and tennis; and playgrounds.
Schools were much less likely than others to be planning to add features at their facilities over the next three years. While 44.6 percent of non-school respondents said they had such plans, only 26.7 percent of school respondents said they had plans to add features to their facilities.
The 10 most commonly planned additions include:
- Synthetic turf sports fields (33.9 percent of those with plans to add features)
- Bleachers and seating (16.9 percent)
- Natural turf sports fields (15.3 percent)
- Fitness centers (13.6 percent)
- Classrooms and meeting rooms (13.6 percent)
- Climbing walls (13.6 percent)
- Outdoor tracks (11.9 percent)
- Indoor courts for sports like basketball and volleyball (11.9 percent)
- Concessions (11.9 percent)
- Playgrounds (11.9 percent)
More school respondents in 2016 than in 2015 are planning to add: synthetic turf sports fields (up 5.6 percent). Climbing walls, indoor courts, and playgrounds did not appear among the top 10 planned features in 2015. They replace outdoor courts, locker rooms, and fitness trails and outdoor fitness equipment.
The Impact of Physical Education
If you want to ensure people get physically active and stay healthy for a lifetime, you have to start in school. This is reinforced by recent research from the Physical Activity Council.
In its 2016 Participation Report, the Physical Activity Council examined the impact physical education classes have on physical activities, both during school years, as well as after graduation.
The Council found that participation in physical exercise during school had an "extreme impact" on participation in other activities. Participants in the study who were 18 or older and took physical education classes in grade school and high school were two to three times more likely to also engage in team sports, outdoor activities, cycling, running/jogging and other activities during that same time. Almost half of them said that team sports were an additional activity.
Among those who did not have physical education classes, only 15 percent said they also participated in team sports, outdoor activities or cycling.
But what about the influence of physical education classes on sport and activity participation in adulthood? The Physical Activity Council reports that "…the effects are amazing."
Of adults ages 18 and up who said they had PE in school, 80 percent said they were active in 2015, and 39 percent were active to a healthy level. Conversely, for those who didn't have PE, only 61 percent reported activity, and less than a quarter participated at a healthy level in 2015.
Programming
The vast majority of school respondents (96.4 percent) said they offer programming of some kind at their facilities. The most common program offered is youth sports teams, found among 78.3 percent of school respondents, up from 72.2 percent in 2015.
Other programs commonly found among school respondents include: educational programs (68.3 percent); fitness programs (51.6 percent); sports tournaments and races (49.8 percent); individual sports activities such as running clubs (40.3 percent); performing arts programs (38.5 percent); swimming programs (34.8 percent); sports training such as golf or tennis instruction (31.2 percent); day camps and summer camps (28.5 percent); and special needs programs (28.5 percent).
In addition to youth sports teams, programs that saw growth from 2015 to 2016 include: educational programs (up 7.7 percent); performing arts programs (up 6.1 percent); swimming programs (up 2.4 percent); and individual sports activities (up 1.9 percent).
School respondents were much less likely than others to report that they had plans for additional programming at their facilities. Just 15.8 percent of school respondents said they had plans to add programs, compared with 32.8 percent of non-school respondents.
The top planned programs among school respondents include:
- Fitness programs (up from No. 2)
- Educational programs (up from No. 3)
- Sports tournaments and races (up from No. 4)
- Youth sports teams (down from No. 1)
- Individual sports activities such as running or swim clubs (up from No. 10)
- Performing arts programs (did not appear in 2015)
- Mind-body balance programs such as yoga and tai chi (did not appear in 2015)
- Teen programming (no change from 2015)
- Special needs programs (down from No. 7)
- Swimming programs (did not appear in 2015)
Programs that dropped off the top 10 list from 2015 include: sport-specific training; day camps and summer camps; and adult sports teams.