


A Look at Trends in YMCAs
In this section we cover "YMCAs," a category that, for our purposes, includes not only YMCAs, but also similar facilities that are generally nonprofit, such as YWCAs, JCCs, and Boys & Girls Clubs. Due to their nonprofit nature, these facilities tend to stand apart in unique ways from the other multipurpose facilities, such as recreation centers and health clubs, which they resemble. Respondents from these types of facilities made up 5.5 percent of survey respondents.
YMCA respondents were most likely to be located in the Midwest, with more than one-third (35.3 percent) of these respondents calling the Midwest home. They were followed by the Northeast, with 21.6 percent of YMCA respondents. Smaller numbers were located in the South Atlantic region (18.1 percent), the West (12.9 percent) and the South Central region (12.1 percent).
Slightly less than half (46.1 percent) of YMCA respondents said they were located in suburban communities. Another 29.6 percent were located in rural communities, and 24.3 percent were found in urban areas.
On average, YMCA respondents said they serve a population of 66,900. Some 41.4 percent of YMCA respondents said they reached a population of 20,000 or fewer people, while 19 percent served an audience of 100,000 or more.
YMCA respondents managed an average of 3.7 facilities. They were far more likely than non-YMCA respondents to report that they managed between one and three facilities. Some 86.1 percent of YMCA respondents said they manage one to three facilities, compared with 57.5 percent of non-YMCA respondents. And, while 7 percent of YMCA respondents said they manage 10 or more facilities, 18 percent of non-YMCA respondents do so.
YMCA respondents are more likely than any other facility type to report that they formed partnerships with outside organizations. Some 98.3 percent of YMCA respondents said they had formed such partnerships, compared with 81.8 percent of non-YMCA respondents. The most common partners for YMCAs were: local schools (80.2 percent of YMCA respondents had partnered with them); nonprofit organizations (79.3 percent); healthcare or medical facilities (69 percent); corporate or local businesses (56.9 percent); and other YMCAs (56 percent). (See Figure 56.)
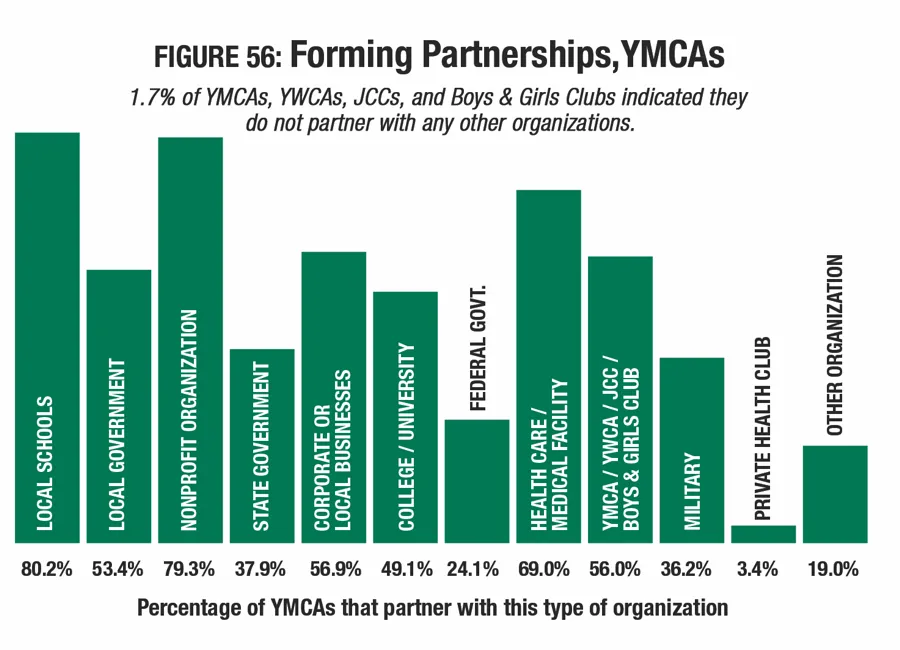
Interestingly, there was a significant jump in the percentage of YMCA respondents who said they partner with healthcare and medical facilities, from 54.1 percent in 2015 to 69 percent in 2016. Just 16.2 percent of non-YMCA respondents said they partner with healthcare or medical facilities.
YMCA respondents were more likely than others to report that they served an all-ages audience. Some 57.8 percent of YMCA respondents said their primary audience was all ages, compared with 40.2 percent of non-YMCA respondents. Another 23.3 percent of YMCA respondents said their primary audience was adults ages 19 to 64, and 13.8 percent said their primary audience was children ages 4 to 12. Smaller numbers had seniors (3.4 percent) and teens (1.7 percent) as their primary audience.
Revenues & Expenditures
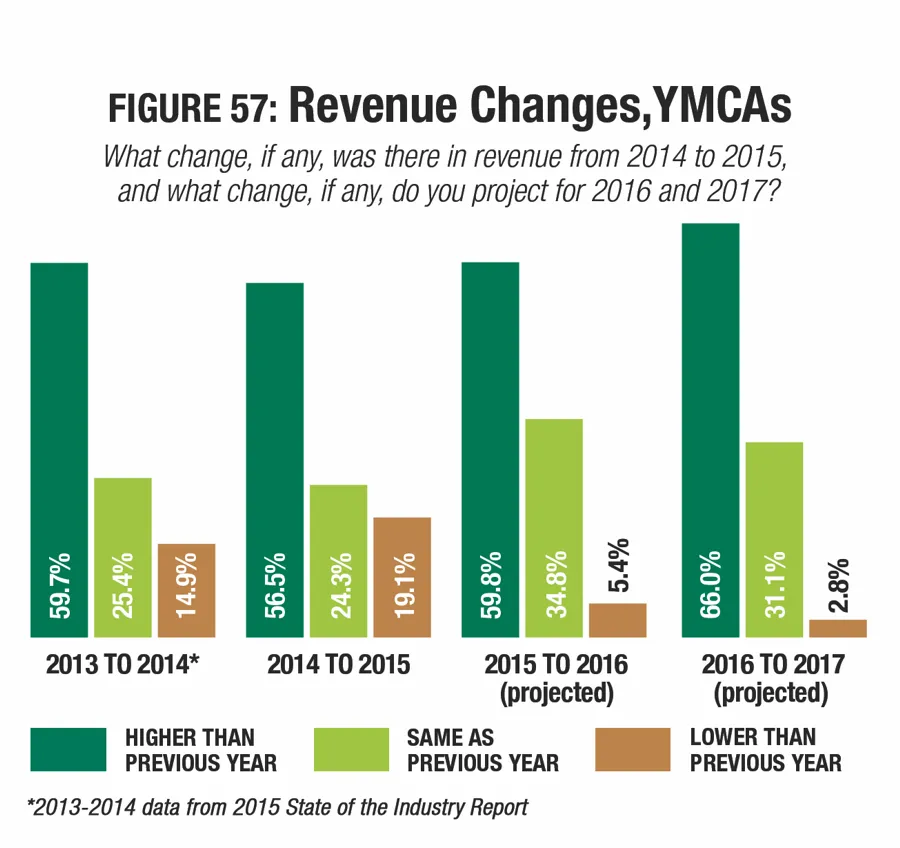
The percentage of YMCA respondents whose revenues increased year-over-year fell slightly in 2015, while the number reporting a drop in revenues increased. While 59.7 percent said revenues increased from 2013 to 2014, 56.5 percent reported an increase from 2014 to 2015. And, while 14.9 percent saw a drop in revenues from 2013 to 2014, 19.1 percent said revenues had decreased from 2014 to 2015. (See Figure 57.)
Looking forward, a growing number of YMCA respondents expect to see their revenues increase, with 59.8 percent expecting an increase in 2016, and 66 percent projecting an increase in 2017.
YMCA respondents are among the biggest spenders in terms of operating expenditures, and they also report that their expenses are growing at a faster rate than the general survey audience. YMCAs spent 54 percent more on their operations in 2015 than the general survey population, with an average operating cost of $2,679,000. In addition, while the average survey respondent saw their operating expenses grow 2.6 percent from 2014 to 2015, YMCA respondents reported that operating expenses grew 9.8 percent, from $2,440,000 in 2014 to $2,679,000 in 2015. Looking forward, YMCA respondents are expecting operating expenses to grow a further 10.2 percent from 2015 to $2,953,000 in 2017.
On average, YMCA respondents reported that they recover 72.3 percent of their operating costs via revenue, on average, the highest rate of recovery among survey respondents. More than one-third (35.4 percent) of YMCA respondents said they recover 91 percent or more of their operating costs back via revenues, compared with just 16 percent of non-YMCA respondents. Just 19.5 percent of YMCA respondents said they earn back 50 percent or less of their operating expenditures via revenues.
YMCA respondents were slightly more likely than non-YMCA respondents to report that they had taken action to reduce their operating expenses. While 85.1 percent of YMCA respondents had taken such action, 83.5 percent of non-YMCA respondents had done so. YMCA respondents were far more likely than others to report that they had cut staffing levels. Some 52.6 percent of YMCA respondents said they had reduced staff, compared with 31.6 percent of non-YMCA respondents. Other actions YMCA respondents had taken include: increasing fees (49.1 percent had done so); improving energy efficiency (46.5 percent); cutting programs or services (18.4 percent); and putting construction or renovation plans on hold (17.5 percent).
YMCA Facilities
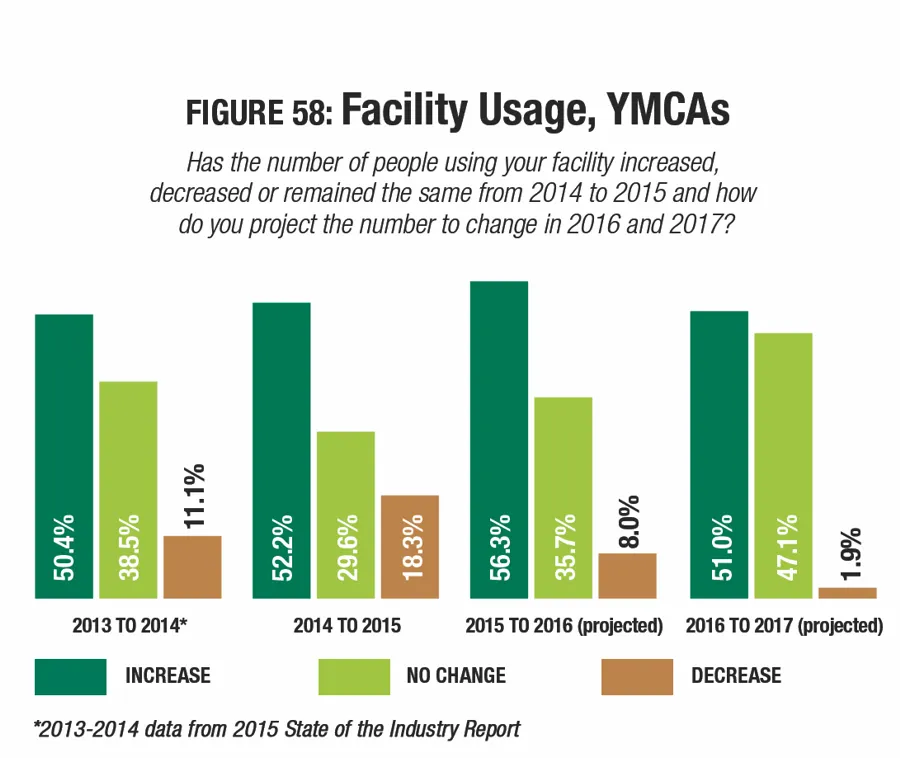
Around one-half of YMCA respondents reported that the number of people using their facilities has increased over the past couple of years, and similar numbers are expecting further increases in 2016 and 2017. While 50.4 percent reported an increase in 2014, 52.2 percent saw an increase in 2015. At the same time, 11.1 percent and 18.3 percent, respectively, reported that the number of people using their facilities had decreased. (See Figure 58.) Looking forward, 56.3 percent are expecting usage to increase in 2016, and 51 percent expect an increase in 2017.
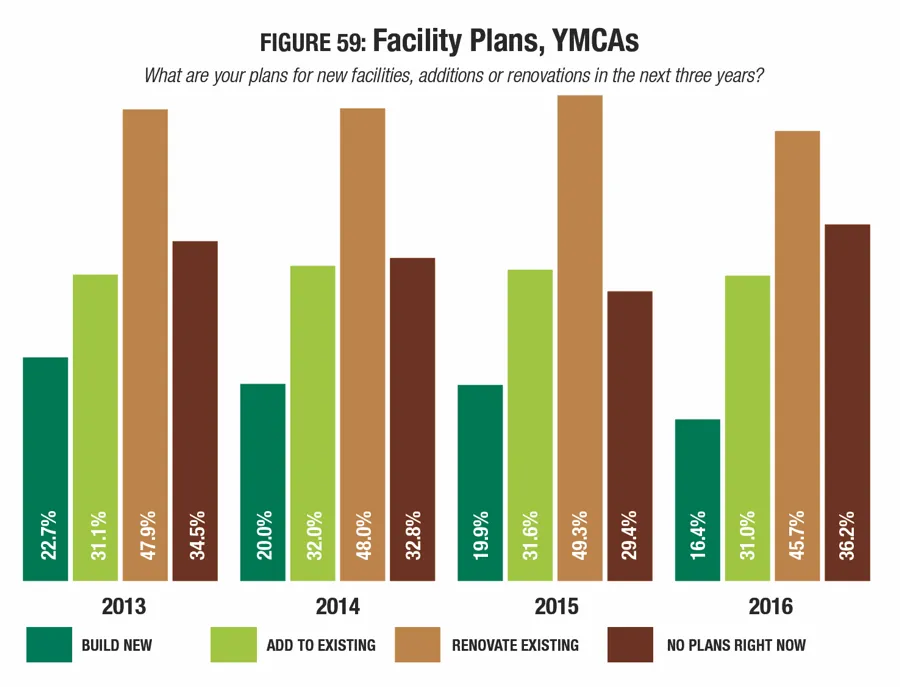
The majority of YMCA respondents said that they have construction plans in the works, with 63.8 percent reporting that they would be building over the next several years. Some 45.7 percent said they have plans to renovate their existing facilities, and 31 percent will be making additions at those facilities. Another 16.4 percent said they have plans for new construction. (See Figure 59.)
On average, YMCA respondents are planning to spend $3,258,000 on their construction plans, 7.4 percent less than the average for the general survey population. This represents a 22.8 percent decrease from the construction budgets reported by YMCA respondents in 2015, of $4,024,000.
There was very little change to the features most commonly included in YMCA respondents' facilities. The 10 most common features include: locker rooms, fitness centers, exercise studios, Wi-Fi services, indoor courts for sports like basketball and volleyball, childcare centers, classrooms and meeting rooms, indoor aquatic facilities, playgrounds, and bleachers and seating.
The number of YMCA respondents who have plans to add features at their facilities over the next three years fell slightly in 2016, from 41.2 percent in 2015 to 39.7 percent who have such plans this year.
The most commonly planned additions for YMCA respondents in 2016 include:
- Splash play areas (planned by 32.6 percent of YMCA respondents who will be adding features)
- Classrooms and meeting rooms (15.2 percent)
- Indoor courts for sports like basketball and volleyball (15.2 percent)
- Indoor running or walking tracks (15.2 percent)
- Fitness trails or outdoor fitness equipment (13 percent)
- Playgrounds (10.9 percent)
- Community gardens (10.9 percent)
- Concessions (10.9 percent)
- Fitness centers (8.7 percent)
- Exercise studios (8.7 percent)
There was an increase in the percentage of respondents who said they would be adding: splash play areas (up 2.2 percent); classrooms and meeting rooms (up 0.9 percent); and fitness trails and outdoor fitness equipment (up 0.5 percent). New to the list this year are indoor courts, indoor tracks, community gardens, and concessions. They replace climbing walls, locker rooms, indoor aquatic facilities and fitness centers.
Programming
All YMCA respondents covered by the survey offer programming of some kind at their facilities. The most common programs found among YMCA respondents' facilities include: fitness programs (offered by 89.7 percent of YMCA respondents); youth sports teams (89.7 percent); day camps and summer camps (87.1 percent); holidays and other special events (86.2 percent); mind-body balance programs such as yoga and tai chi (85.3 percent); personal training (84.5 percent); swimming programs (81 percent); active older adult programming (80.2 percent); aquatic exercise programs (79.3 percent); and educational programs (75 percent).
The percentage of YMCA respondents who said they had plans to add programs at their facilities fell in the past year, from 39.7 percent in 2015 to 32.8 percent in 2016. They were still more likely than others to have such plans, with 30.9 percent of non-YMCA respondents indicating they would be adding programs at their facilities.
The 10 most commonly planned program additions for YMCA respondents include:
- Performing arts programs (up from No. 7)
- Special needs programs (up from No. 6)
- Teen programs (up from No. 4)
- Adult sports teams (down from No. 3)
- Individual sports activities like swim clubs or running clubs (up from No. 8)
- Environmental education (did not appear in 2015)
- Arts and crafts (did not appear in 2015)
- Educational programs (did not appear in 2015)
- Nutrition and diet counseling (down from No. 1)
- Active older adult programs (did not appear in 2015)
As is generally the case, there was a great deal of change among the top planned programs for YMCA respondents. Environmental education, arts and crafts, educational programs, nutrition and diet counseling, and active older adult programs rose into the top 10, replacing mind-body balance programs, fitness programs, sports tournaments and races, and personal training.