


A Look at Trends in Colleges & Universities
A recent report from the Center on Budget and Policy Priorities shows that while some states have begun to restore the deep cuts they made in their financial support for public colleges when the recession hit, funding is still far lower than previous levels. Years of cuts and the fact that funding has not been fully restored mean that 45 states spent less per student in 2015-16 than they did prior to the onset of the recession. All told, the report states that for the current school year, and after adjusting for inflation, funding for public two- and four-year colleges is $8.7 billion lower than just prior to the recession.
This is reflected in the responses from colleges and universities, who made up 11.2 percent of our 2016 survey population. They were less likely than many others to report that revenues were increasing, and at the same time are trying to find ways to cut costs.
The largest number of college respondents, 29.9 percent, were located in the Midwest. The next largest group—at 29.9 percent—were from the Northeast. They were followed by the South Atlantic region (19.2 percent) the South Central region (15 percent) and the West 10.3 percent. Another 2.6 percent of college respondents were located outside the United States.

While the majority of college respondents in 2015 were located in urban areas, this year, the majority were from suburban communities. Some 42.9 percent of college respondents said they were located in the suburbs. The rest of the college respondents were split almost evenly between urban and rural communities. Some 28.3 percent of college respondents were found in rural communities, and 27.8 percent were located in urban areas.
On average, college respondents said they serve a population of 33,100 people. College respondents were much more likely to report that they had a population of 20,000 or less than non-college respondents. More than two-thirds (67.8 percent) of college respondents said their population was 20,000 or less, compared to 44 percent of non-college respondents. Conversely, only 5.5 percent of college respondents said they served a population of 100,000 or more, while 21.2 percent of non-college respondents served a population of at least 100,000.
A majority of college respondents said they were from public colleges and universities. Some 61.2 percent of these respondents indicated they were with a public organization. Another 32.5 percent were with private nonprofits, while 5.9 percent were with private for-profit organizations, and 0.4 percent were with some "other" type of organization.
Respondents from colleges and universities managed an average of 4.4 facilities. They were more likely than non-college respondents to report that they managed between one and three facilities. Some 68.7 percent of college respondents said they managed between one and three facilities, while 57.9 percent of non-college respondents managed one to three facilities. Likewise, while 18.8 percent of non-college respondents said they managed 10 or more facilities, only 6 percent of college respondents said they'd managed 10 or more.
College respondents were less likely than non-college respondents to report that they had formed partnerships with other organizations. Some 80 percent of college respondents formed partnerships with other organizations, compared with 88.2 percent of non-college respondents. The most common partnerships for college respondents were formed with other colleges and universities. In fact, 57.4 percent of college respondents partnered with other colleges and universities, while 29 percent of non-college respondents partnered with colleges. Other commonly formed partnerships for college respondents include: local schools (38.7 percent of college respondents had partnered with them); state government (30.2 percent); local government (27.7 percent); and nonprofit organizations (25.1 percent).
Revenues & Expenditures
College and university respondents continue to be faced with budget challenges, with a greater number reporting that revenues had decreased from 2014 to 2015 than the percentage who expected to see such a decrease in the 2015 Industry Report. While 5.5 percent in 2015 projected a decrease in revenues in this time period, 12.4 percent of respondents this year reported that such a decrease had taken place. Another 33.3 percent said revenues increased from 2014 to 2015, and 54.2 percent said revenues had remained the same. (See Figure 47.)
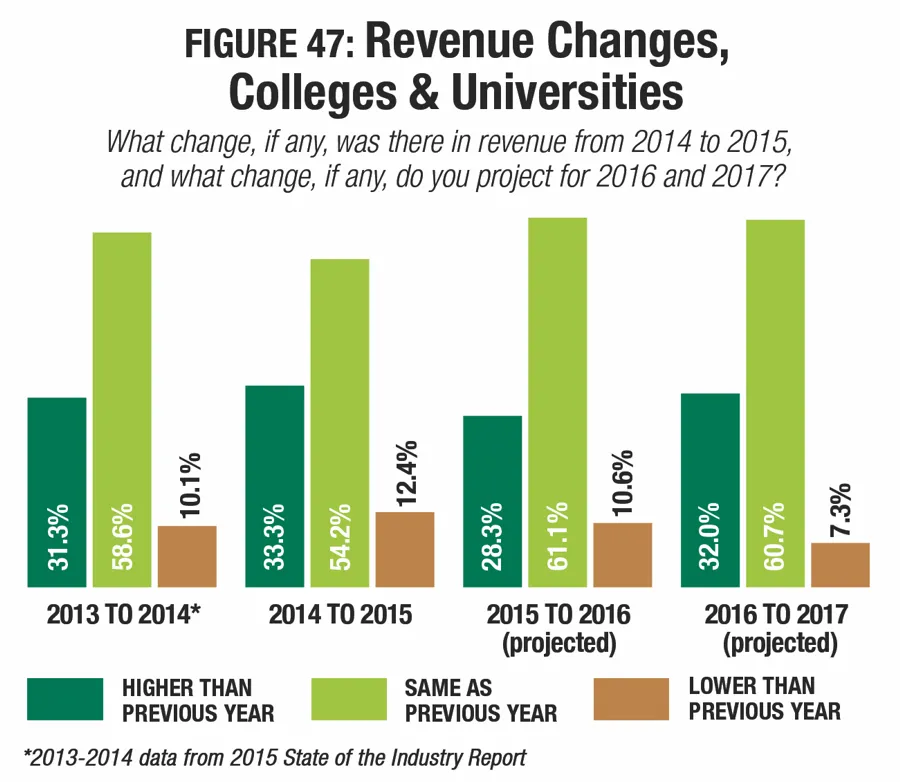
Looking forward, the percentage of college respondents who expect revenues to increase or decrease falls slightly, while those expecting revenues to remain the same increases. Some 28.3 percent of college respondents said revenues will be higher in 2016 than 2015, and 32 percent expect an increase in 2017. At the same time, the percentage expecting revenues to decrease falls to 10.6 percent for 2016, and 7.3 percent for 2017.
After reporting a 36.6 percent increase in operating expenses from 2013 to 2014, college respondents saw a slight decrease in operating expenses this year. College respondents' average operating cost fell by 1.6 percent from 2014 to 2015, from $1,820,000 to $1,790,000.
Looking forward, college respondents are expecting operating expenses to increase at a slower rate than the general survey population. While among all respondents, operating expenses are expected to increase 5.8 percent, college respondents projected a 2.6 percent increase from $1,790,000 in 2015 to $1,836,000 in 2017.
On average, college respondents report that they recover 35.5 percent of their operating costs via revenue. This compares with 49.6 percent of operating costs recovered via revenue for all respondents. Nearly one-half (49.8 percent) of college respondents reported that they recover 30 percent or less of their operating costs via revenue. Another 8.8 percent earn back 31 to 50 percent of operating costs via revenue. Some 5.3 percent said they earned between 51 and 70 percent of their costs via revenue, and 19.4 percent said they recover 71 percent or more of their operating costs via revenue.
College respondents were less likely than non-college respondents to report that they had taken action to reduce their operating expenditures, though a large majority had done so. Some 80.5 percent of college respondents said they had done so, compared with 83.9 percent of non-college respondents. The most common actions taken by college respondents include: improving energy efficiency (44.6 percent of college respondents had done so); increasing fees (31.6 percent); reducing staff (31.6 percent); putting construction or renovation plans on hold (27.7 percent); or cutting programs or services (27.7 percent). In fact, college respondents were much more likely to report that they had cut programs and services than non-college respondents. While 27.7 percent of college respondents had done so, just 17.9 percent of non-college respondents said they had cut programs or services in order to reduce their operating expenditures.
College Facilities
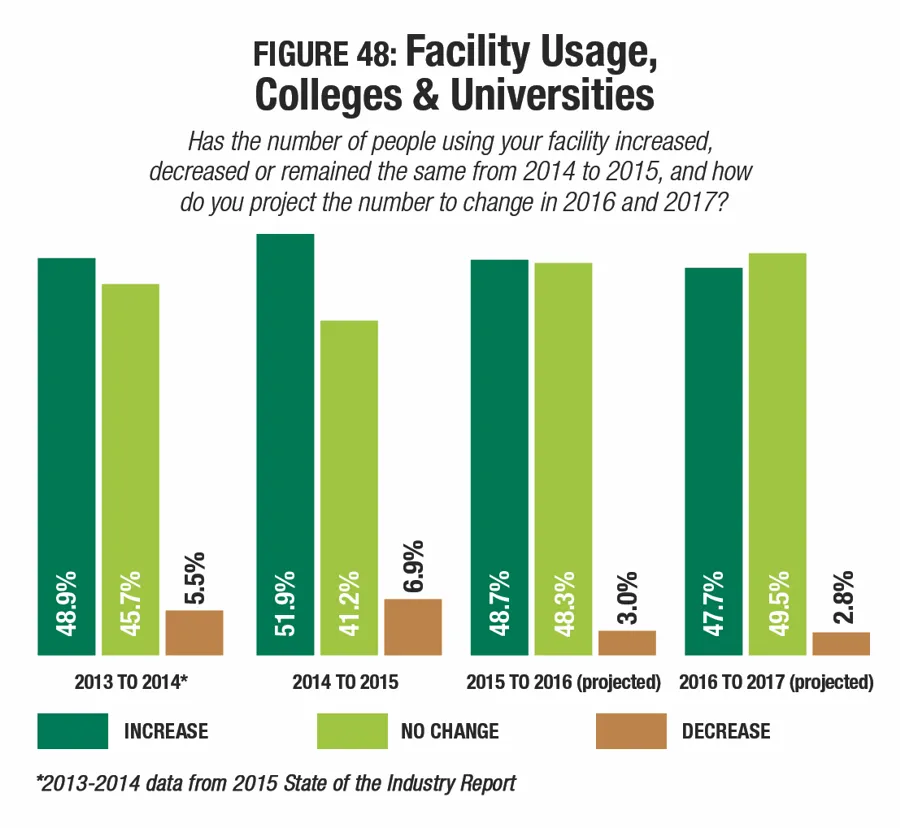
More than half (51.9 percent) of college respondents said they had seen an increase in the number of people using their facilities from 2014 to 2015, with similar numbers expecting increases in 2016 and 2017. Some 48.7 percent said they expect usage to increase in 2016, and 47.7 percent expect increases in 2017. (See Figure 48.) And while 6.9 percent saw a decrease from 2014 to 2015, just 3 percent expect a decrease in 2016, and 2.8 percent projected a decrease in 2016.
After increasing slightly in 2013 and 2014, the percentage of college respondents who report that they are planning construction has fallen for the past couple of years. While 54.6 percent of college respondents in 2012 had plans for construction, that number rose to 59.2 percent in 2013, and 60.4 percent in 2014, before falling to 58.7 percent in 2015. This year, 56.5 percent of college respondents said they had plans for construction. This compares with 67.7 percent of non-college respondents.
Nearly a quarter of college respondents in 2016 said they are planning new construction (24.1 percent) or additions to their existing facilities (24.9 percent). Another 36.7 percent are planning to make renovations to their existing facilities. (See Figure 49.)
Despite the fact that they are less likely to be planning construction, college respondents continue to be the biggest spenders when it comes to the construction they are planning. College respondents with construction plans reported that they would spend, on average, 71.6 percent more than the average for all respondents—$6,037,000 vs. $3,519,000. That said, college respondents saw their construction budgets fall at a sharper rate than the across-the-board decrease. While construction budgets for all respondents 
fell by 12.5 percent from 2015 to 2016, among college respondents, construction spending fell 22.4 percent, from $7,775,000 in 2015 to $6,037,000 in 2016.
There was very little change in the past year in the various features most commonly found among college respondents' facilities. The 10 features that are currently most common include: fitness centers; locker rooms; indoor courts for sports like basketball and volleyball; exercise studio rooms; classrooms and meeting rooms; bleachers and seating; natural turf sports fields such as football or soccer fields; Wi-Fi services; outdoor sports courts; and indoor tracks.
College respondents were less likely than non-college respondents to report that they had plans to add features at their facilities over the next three years. While 43.6 percent of non-college respondents had such plans, some 36.3 percent of college respondents said they would be adding features. This is a slight decrease from 2015, when 37.9 percent of college respondents said they had plans to add features.
The most commonly planned features for college respondents in 2016 include:
- Synthetic turf sports fields (planned by 33.7 percent of those who intend to add features at their facilities)
- Fitness centers (23.3 percent)
- Locker rooms (22.1 percent)
- Bleachers and seating (18.6 percent)
- Outdoor courts for sports like basketball and tennis (17.4 percent)
- Fitness trails and outdoor fitness equipment (16.3 percent)
- Exercise studios (16.3 percent)
- Wi-Fi services (14 percent)
- Concessions (12.8 percent)
- Indoor running/walking tracks (12.8 percent)
Synthetic turf sports fields continue to hold the top position, and the number of college respondents who plan to add them has actually increased, from 27.1 percent in 2013 to 33.7 percent in 2016). There were also increases in the percentage of college respondents planning to add fitness centers (up 8.5 percent from 2015 to 2016), fitness trails and outdoor fitness equipment (up 2.4 percent), and exercise studios (up 1.5 percent). Commonly planned features in 2016 that did not appear on this list in 2015 include: outdoor courts for sports like basketball and tennis, Wi-Fi services, and indoor running or walking tracks. They replace natural turf sports fields, outdoor tracks, and classrooms and meeting rooms.
Synthetic Turf Still No. 1
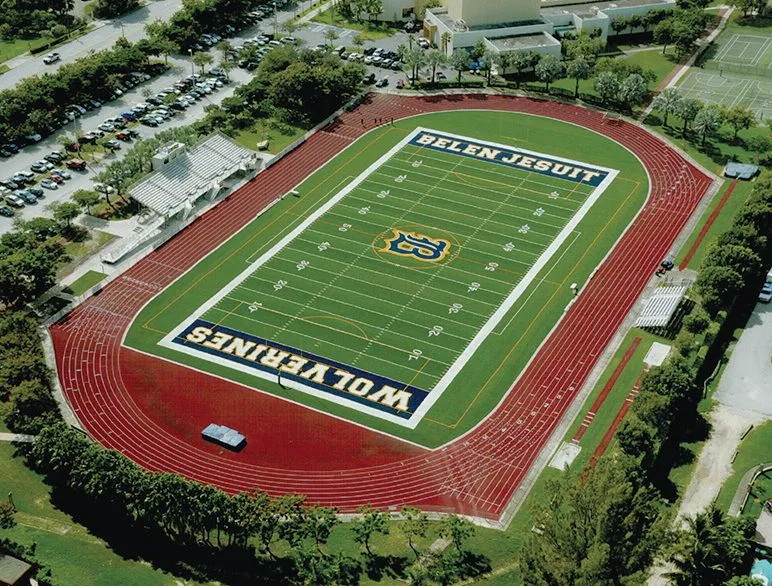
Synthetic turf sports fields have been the most commonly planned feature addition at colleges and universities since 2011. They also are commonly planned among schools and school districts.
Currently, 43.5 percent of college respondents said they have synthetic turf sports fields, compared with just 12.7 percent of non-college respondents. Looking forward, 33.7 percent of college respondents with plans to add any features at their facilities said they would be adding synthetic turf. This compares with just 12.3 percent of non-college respondents.
Among schools respondents, 25.3 percent said they currently have synthetic turf sports fields at their facilities. This compares with 15 percent of non-schools respondents. Looking forward, 33.9 percent of schools respondents with plans to add features at their facilities said they would be adding synthetic turf, compared with just 13 percent of non-schools respondents.
Programming
Some 96.6 percent of college respondents said they offer programming at their facilities. This compares with 94.8 percent of non-college respondents. Fitness programs continue to be the most commonly offered program among college respondents. Some 83.5 percent of college respondents said they provide fitness programs, up from 81.4 percent in 2015. More than half of college respondents provide: mind-body balance programs such as yoga and tai chi (66.2 percent); educational programs (60.8 percent); adults sports teams (54 percent); personal training (52.7 percent); and sports tournaments and races (51.9 percent). Other commonly offered programs among college respondents include: swimming programs (46.4 percent); aquatic exercise (42.2 percent); day camps and summer camps (41.8 percent); and holidays and special events (33.8 percent).
In addition to fitness, other programming offerings that were provided by more college respondents in 2016 than 2015 include: educational programs (up 5.2 percent); mind-body balance programs (up 5.1 percent); personal training (up 2.5 percent); adult sports teams (up 0.9 percent); and aquatic exercise programs (up 0.4 percent).
College respondents were less likely than non-college respondents to report that they had plans to add programming at their facilities. While 31.8 percent of non-college respondents had such plans, just 24.9 percent of college respondents said they were planning to add programs at their facilities. This is a slight increase from last year, when 23.9 percent of college respondents had such plans.
The top 10 planned programs for college and university respondents include:
- Fitness programs (up from No. 3 in 2015)
- Mind-body balance programs such as yoga and tai chi (up from No. 6)
- Swimming programs (up from No. 8)
- Personal training (up from No. 5)
- Aquatic exercise programs (up from No. 7)
- Educational programs (up from No. 9)
- Sports tournaments and races (did not appear in 2015)
- Adult sports teams (down from No. 4)
- Day camps and summer camps (down from No. 2)
- Individual sports activities (no change from 2015)
Sports tournaments and races is the only program that did not appear among the top 10 in 2015. It replaces nutrition and diet counseling, which held the No. 1 spot last year.