


A Look at Trends in Health, Fitness & Sports Clubs
According to the International Health, Racquet & Sportsclub Association (IHRSA), there were 36,180 health clubs in the United States as of Jan. 1, 2016, up 4.8 percent from 2015, and 55.3 million Americans belong to at least one of them. Total industry revenues in the United States grew 6.1 percent in 2015 to reach $25.8 billion, and more than 64 million Americans used a club at least once in 2015.
The health club market continues to evolve and grow, and it's no surprise, given that Americans rely on these spaces to connect them with effective and engaging fitness offerings, whether it happens on the cardio floor or in one of the group exercise studios. Equipment manufacturers continue to up their game, bringing innovative new ways to work out to the market, and health club operators continue to find new ways to engage members and boost fitness for all.
This section of the report will cover our health club respondents, which includes health clubs, sports clubs and fitness clubs, as well as medical fitness facilities. These respondents made up 4.4 percent of the survey population.
While the general survey population was more likely to be from the Midwest than from other regions, health club respondents were most heavily concentrated in the West. Some 26.7 percent of health club respondents said they were located in the West. They were followed by the Midwest (21.3 percent), the South Atlantic (18.7 percent), the South Central region (18.7 percent), and the Northeast (14.7 percent). No health club respondents were located outside of the United States.
More than half (54.7 percent) of health club respondents said they were located in suburban communities. Another 30.7 percent were from rural areas, and 14.7 percent were from urban communities.
On average, health club respondents said they serve a population of 63,200 people. A majority of health club respondents, 63.2 percent, said they reach a population of 20,000 or fewer people, compared with 46.7 percent of non-health-club respondents. Conversely, while 15.8 percent of health club respondents said they reach a population of 100,000 or more, 22.3 percent of non-health-club respondents reach a population of at least 100,000.
Health club respondents were most likely to report from private, for-profit organizations. Some 53.3 percent said they were for-profit. Another 26.7 percent worked for private, nonprofit organizations, and 20 percent said they were with public organizations.
Respondents from health clubs managed an average of 3.5 facilities. They were far more likely than non-health-club respondents to report that they managed a smaller number of facilities. Some 61.8 percent of health club respondents said they manage just a single facility, compared with 34.7 percent of non-health-club respondents. And while 26.3 percent of health club respondents manage two to three facilities, 23.5 percent of non-health-club respondents have two to three facilities to manage.
Health club respondents were among the least likely to report that they form partnerships with other organizations, though a majority do so. While 71.6 percent of health club respondents said they partner with outside organizations, 87.5 percent of non-health-club respondents do so. The most common partners for health club respondents include: local schools (39.2 percent of health club respondents partner with them), health care or medical facilities (36.5 percent), corporate or local businesses (31.1 percent), nonprofit organizations (23 percent), and colleges and universities (23 percent).
Respondents from health clubs were much more likely than others to report that their primary audience was made up of adults ages 19 to 64. Some 57.9 percent of health club respondents said this was their primary audience, compared with 15.3 percent of non-health-club respondents. Health club respondents were also more likely than others to serve seniors 65 and older, with 9.2 percent naming this as their primary audience. This compares with just 2.5 percent of non-health-club respondents. The remainder of health club respondents said their audience was all ages (27.6 percent), college students (3.9 percent) or teens ages 13 to 18 (1.3 percent).
Revenues & Expenditures
The number of health club respondents who saw their revenues increase grew from 2015 to 2016, while at the same time, the number whose revenues decreased fell. From 2014 to 2015, 48.4 percent of health club respondents said their revenues had increased, while 24.2 percent reported lower revenues. From 2015 to 2016, 55.4 percent of health club respondents said revenues grew, while 12.2 percent reported a drop in revenues. (See Figure 53.)
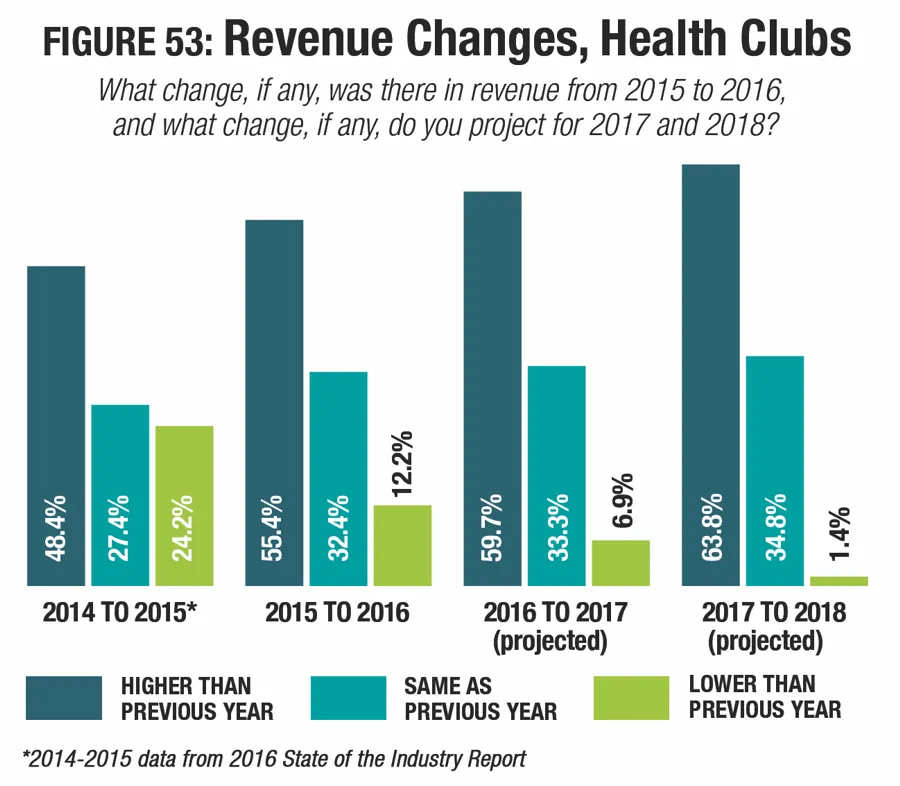
Health club respondents always tend to be among the most optimistic when considering their future revenues, and this year is no exception, with 59.7 percent projecting their revenues will increase in 2017, and 63.8 percent expecting higher revenues in 2018. Around one-third expect revenues to remain the same in each of those years.
From 2015 to 2016, health club respondents' average operating costs grew at nearly double the rate for all respondents. While all respondents saw their average operating expenditure increase by 17.5 percent in that time period, health club respondents' average operating expense grew 34.3 percent, from $1,343,000 in 2015 to $1,804,000 in 2016. Looking forward, however, health club respondents are among the only respondents who are expecting their average operating costs to fall over the next two years. They expect a 7 percent decrease, to an average of $1,678,000 in 2018.
On average, health club respondents report that they recover 67.6 percent of their operating costs via revenue. This compares with 49.9 percent of operating costs recovered via revenue for all respondents. Given the largely for-profit nature of this audience, it should come as no surprise that health club respondents were more likely to report that they earned back 91 to 100 percent of their operating costs via revenues. While just 17.3 percent of non-health-club respondents earned at least 91 percent of their costs back, some 40.3 percent of health club respondents earned 91 percent or more of their operating costs back via revenue. Some 19.4 percent of health club respondents said they earn less than 30 percent of their costs back via revenues. Another 5.6 percent earn between 31 percent and 50 percent of their costs back. Some 8.3 percent earn between 51 percent and 70 percent of their operating costs back. And 55.6 percent of health club respondents said they cover at least 71 percent or more of their operating costs via revenue.
The percentage of health club respondents who said they had taken action to reduce operating expenditures at their facilities fell this year. While 87.1 percent of health club respondents had taken such action in 2016, this year, that number fell to 80.8 percent. The most common actions they had taken include: improving energy efficiency (54.8 percent), increasing fees (37 percent), reducing staff (27.4 percent), cutting programs or services (20.5 percent), and putting construction or renovation plans on hold (16.4 percent).
Health Club Facilities
A majority of health club respondents report that the number of people using their facilities has increased, and a majority expect further increases. While 51.6 percent of health club respondents said they saw membership increase from 2014 to 2015, 55.3 percent said memberships had grown from 2015 to 2016. At the same time, 19.4 percent of health club respondents reported a decline in memberships from 2014 to 2015, and 11.8 percent reported a decrease from 2015 to 2016. (See Figure 54.)
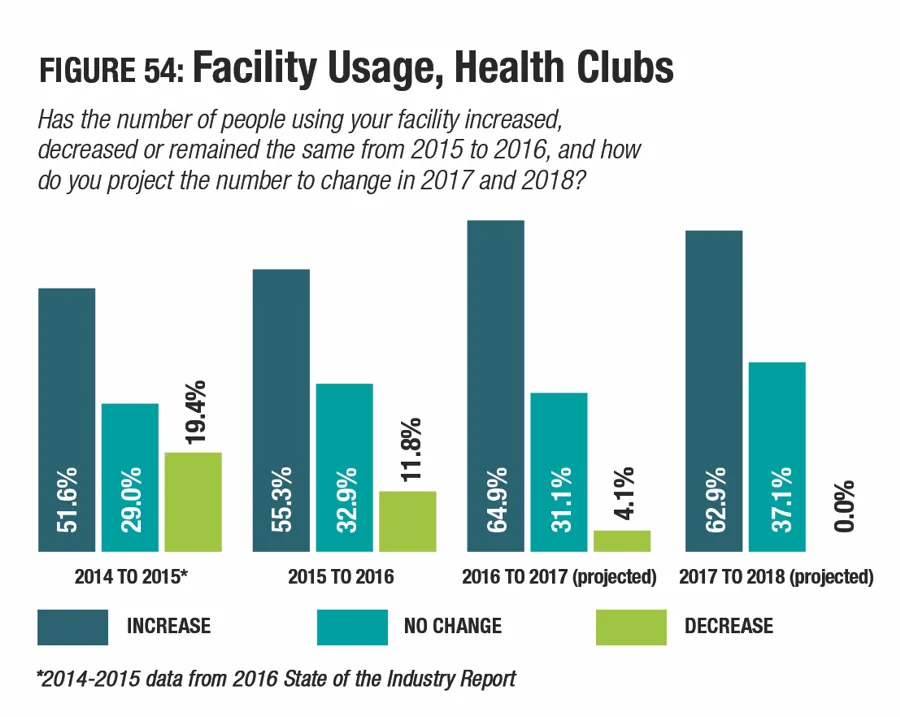
Looking forward, health club respondents continue to be optimistic about membership increases, as is typically the case with these respondents. Some 64.9 percent of health club respondents said they expect to see utilization of their facilities increase from 2016 to 2017, and 62.9 percent are expecting memberships to increase from 2017 to 2018.
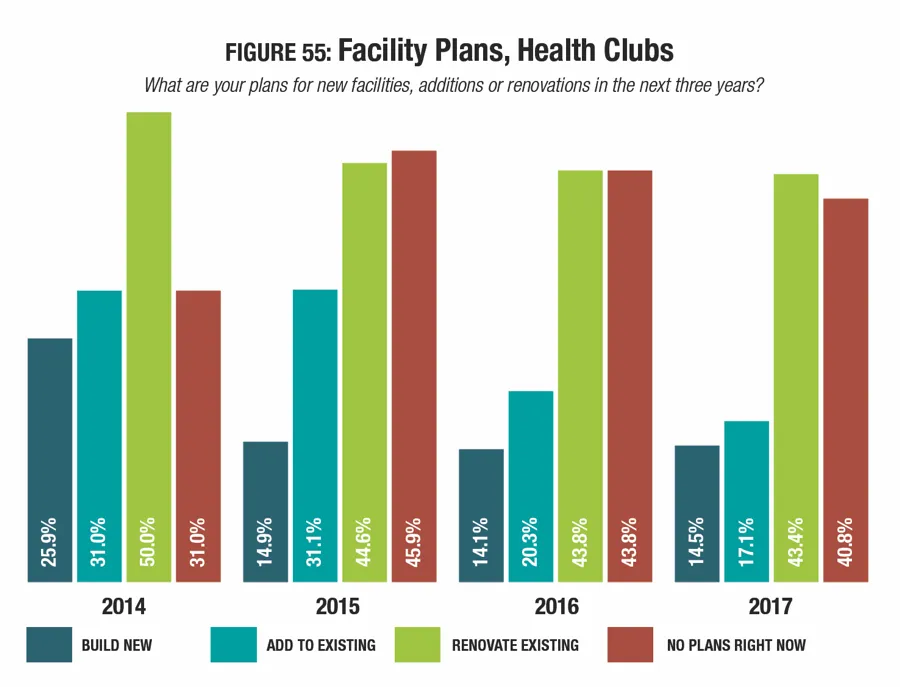
The percentage of health club respondents who are planning construction over the next few years has been on a gradual increase since 2015. At that time, 54.1 percent of health club respondents said they had plans for construction. This year, 59.2 percent of health club respondents said they were planning construction. Some 43.4 percent of health club respondents said they will be renovating their existing facilities. Another 17.1 percent are planning additions, and 14.5 percent are planning to build new facilities. (See Figure 55.)
Health club respondents in 2017 are planning to spend an average of $963,000 on their construction plans, 77.6 percent less than the average for all respondents. What's more, health club respondents saw their budgets for construction fall substantially from 2016 to 2017, dropping 61.5 percent from an average of $2,500,000 last year.
The features most commonly included among health club respondents' facilities in 2017 include: fitness centers, exercise studio rooms, locker rooms, Wi-Fi services, indoor aquatic facilities, childcare centers, indoor sports courts for sports like basketball, classrooms and meeting rooms, indoor tracks, and outdoor aquatic facilities.
The percentage of health club respondents who said they had plans to add features at their facilities over the next three years grew slightly, from 15.6 percent in 2016 to 19.7 percent in 2017. This compares with 42.5 percent of non-health-club respondents who plan to add features in 2017. The most commonly planned additions among health club respondents include: fitness trails and outdoor fitness equipment, synthetic turf sports fields, fitness centers, exercise studios, and classrooms and meeting rooms.
Programming
Offering engaging, innovative and effective programs is one of the keys to a successful health club business, as it gets new members in the door and keeps existing members coming back for more.
The top 10 programs currently offered among health club respondents' facilities include: fitness programs (provided by 90.7 percent of health club respondents), personal training (81.3 percent), mind-body balance programs such as yoga and tai chi (80 percent), nutrition and diet counseling (60 percent), aquatic exercise programs (58.7 percent), holidays and other special events (54.7 percent), programs for active older adults (53.3 percent), swimming programs (52 percent), day camps and summer camps (38.7 percent), and sport-specific training such as golf lessons or tennis instruction (36 percent).
Programming types that saw growth from 2016 to 2017 include: fitness programs (up from 89.1 percent), nutrition and diet counseling (up from 53.1 percent), aquatic exercise programs (up from 50 percent), holidays and other special events (up from 46.9 percent), and swimming programs (up from 45.3 percent).
The percentage of health club respondents who plan to add programming at their facilities grew from 28.1 percent in 2016 to 32.9 percent in 2017. This compares with 32.2 percent of non-health-club respondents who are planning to add new programs at their facilities.
The most commonly planned program additions among health club respondents include:
- Individual sports activities such as running or swim clubs (up from No. 2)
- Nutrition and diet counseling (up from No. 3)
- Fitness programs (up from No. 4)
- Teen programming (did not appear in 2016)
- Mind-body balance programs such as yoga and tai chi (up from No. 6)
- Programs for active older adults (up from No. 7)
- Educational programs (down from No. 1)
- Special needs programs (up from No. 9)
- Personal training (down from No. 8)
- Swimming programs (did not appear in 2016)