


Our 10th Annual Salary Survey

In April 2017, the U.S. unemployment rate fell to 4.4 percent, reaching its lowest level since May 2007. Median household income, according to the U.S. Census Bureau, hit $55,775 in 2015 (the most recent year for which data is available). This is still 3.84 percent lower than 2007, when median household income peaked at $58,003, but represents a 5.17 percent increase from the number's post-peak low of $53,031, in 2012.
So, while the average American is still working to recover income lost during the Great Recession, things are looking up. This is especially true for respondents to our annual Salary Survey.
This year, more than 1,700 professionals working in the recreation, sports and fitness industry responded to our survey, which found that salaries in the industry are up 1.6 percent from last year, on average. On top of that, job satisfaction continues to be overwhelmingly positive among respondents.
Welcome to our 10th annual Salary Survey. Over the course of the next few pages, we'll take a closer look at what respondents to our survey had to say about their careers, salaries and more.
Who Are You?
Recreation, sports and fitness facility management is a varied field, and a diverse array of people are called to join the profession. But if you're a fan of averages, know that the "average" respondent to the annual survey is a 50-year-old white male working in the Midwestern suburbs as a director of a parks and recreation department or district, earning $68,400.
Some 29.9 percent of respondents were from the Midwest, the largest region represented in the survey. They were followed by the South Atlantic states (20.2 percent), the West (18.6 percent), the Northeast (16.3 percent) and the South Central region (14.2 percent). Another 0.7 percent of respondents reported from outside the United States.

Some 42.4 percent of respondents said they work in suburban communities. Another third or so (33.7 percent) are located in rural areas, and 23.9 percent are in urban areas.
Nearly two-thirds (65.9 percent) of respondents work for public organizations. Another 23.1 percent are with private nonprofit organizations, and 10.8 percent said they work with private, for-profit facilities.
When it comes to the type of facility or part of the industry respondents were working in, the largest number—41.1 percent—were with parks and recreation organizations. Other more prominent facility types included: colleges and universities (12.4 percent), schools and school districts (9.9 percent), community or private recreation and sports centers (7.4 percent), YMCAs, YWCAs, JCCs and Boys & Girls Clubs (7 percent), campgrounds, RV parks, and private and youth camps (6.6 percent), and sports, health, fitness clubs and medical fitness facilities (4.4 percent). Others that were home to smaller numbers of respondents included: golf or country clubs (2.5 percent), resorts and resort hotels (1.6 percent), homeowners associations (1 percent), waterparks, theme parks and amusement parks (0.8 percent), military installations (0.6 percent), churches (0.5 percent), ice rinks (0.5 percent), racquet and tennis clubs (0.5 percent), corporate recreation or sports centers (0.5 percent), and stadiums, arenas and tracks (0.2 percent). Another 2.7 percent of respondents said they worked for other types of facilities.
Well over a third (36.3 percent) of respondents said they were between 50 and 59 years old, the largest age group represented. They were followed by respondents between the ages of 40 and 49 (24.1 percent), 30 to 39 (15.4 percent) and 60 to 65 (14 percent). Just 4.4 percent of respondents said they were younger than 30, and 5.9 percent were 65 or older.
Some 62.2 percent of respondents were male, while 37.8 percent were female. In addition, the survey audience is predominantly white, with 89.2 percent of respondents identifying as such. Another 4.3 percent are black/non-Hispanic, while 4 percent are Hispanic, 1.5 percent are Asian/Pacific Islanders, 1.1 percent are Native American or Alaskan Natives, and 2.1 percent are of "other" or "unknown" ethnicity.
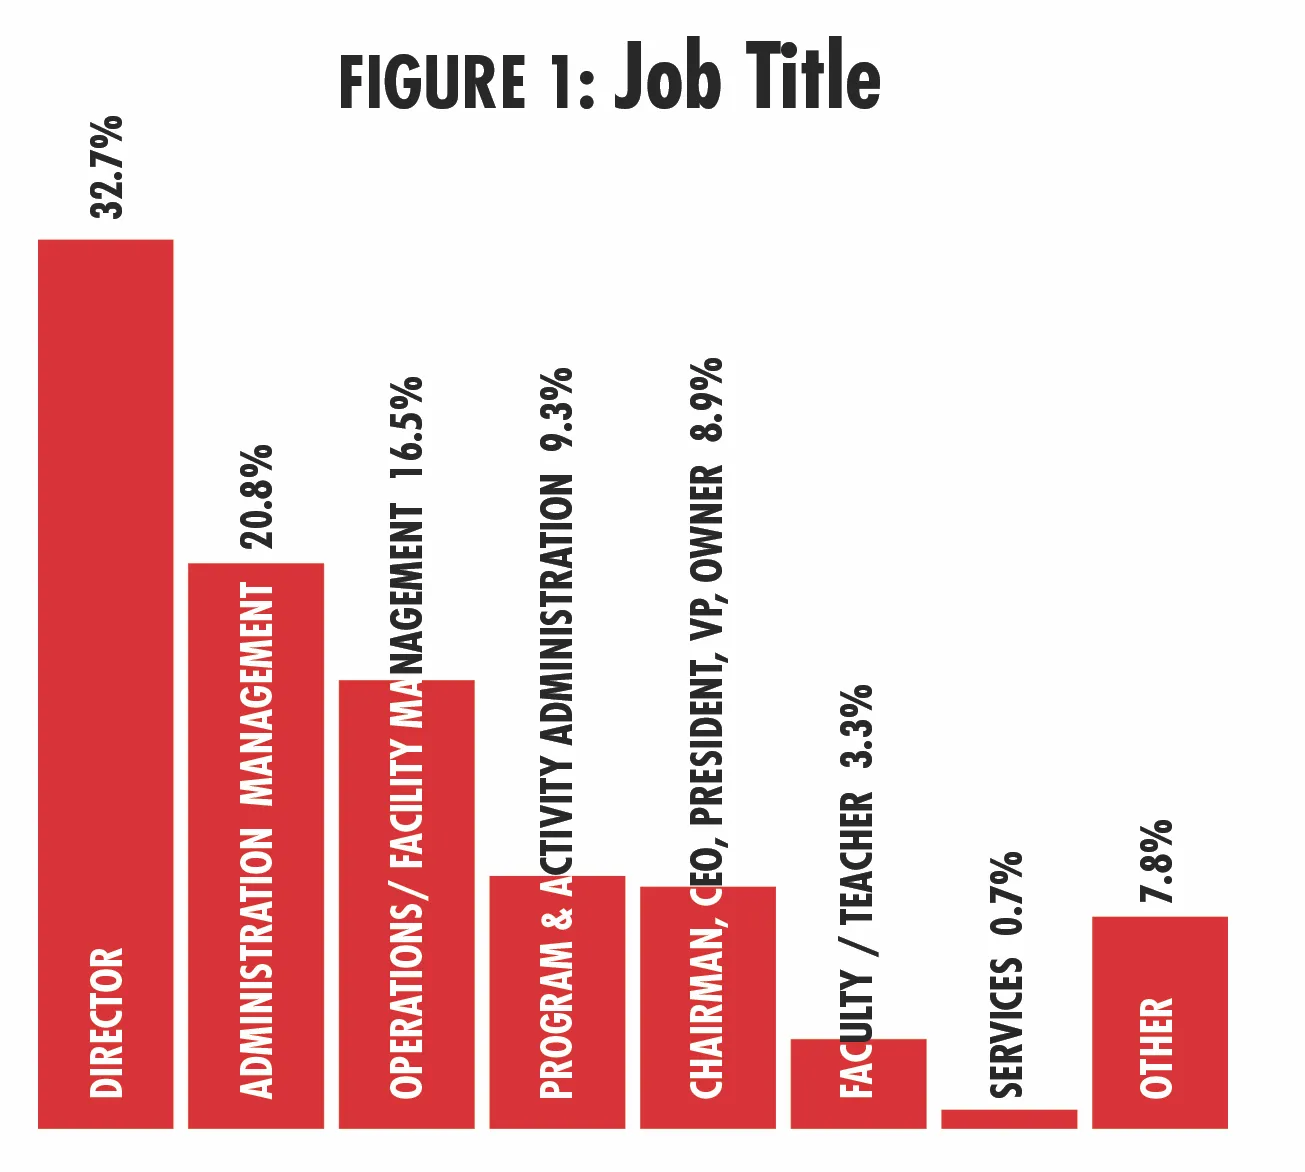
When it comes to job titles represented by the survey, a majority of respondents—as is the case with the Recreation Management readership—are in leadership positions. Nearly one-third (32.7 percent) hold the title of "director." Another 20.8 percent are in administration management, which includes such job titles as administrator, manager or superintendent. Some 16.5 percent of respondents were in operations and facility management, including operations managers, facility managers, building managers and supervisors. Another 9.3 percent are in program and activity administration, which includes activity or program directors, managers, coordinators, specialists, coaches and instructors. Some 8.9 percent of respondents were the chairman, CEO, vice president or owner of their organizations. Some 3.3 percent were faculty or teachers, and 0.7 percent were in services, which includes planners, designers, architects and consultants. Finally, 7.8 percent were in "other," unspecified job roles. (See Figure 1.)
Career Paths
Not surprisingly, given their career achievements, the majority of respondents to the survey were better educated than the U.S. population as a whole. According to the Lumina Foundation, 40.4 percent of working-age Americans had at least a two-year degree in 2014, the most recent year for which data is available. This compares with 86 percent of survey respondents. Some 45.6 percent said they had earned a bachelor's degree, while 30.8 percent had earned a master's, 6.5 percent had earned an associate's degree, and 3.1 percent had earned an advanced degree or Ph.D. Some 11.5 percent said they had attended college but without completing a degree. Finally, just 2.5 percent said they had earned only a high school diploma.
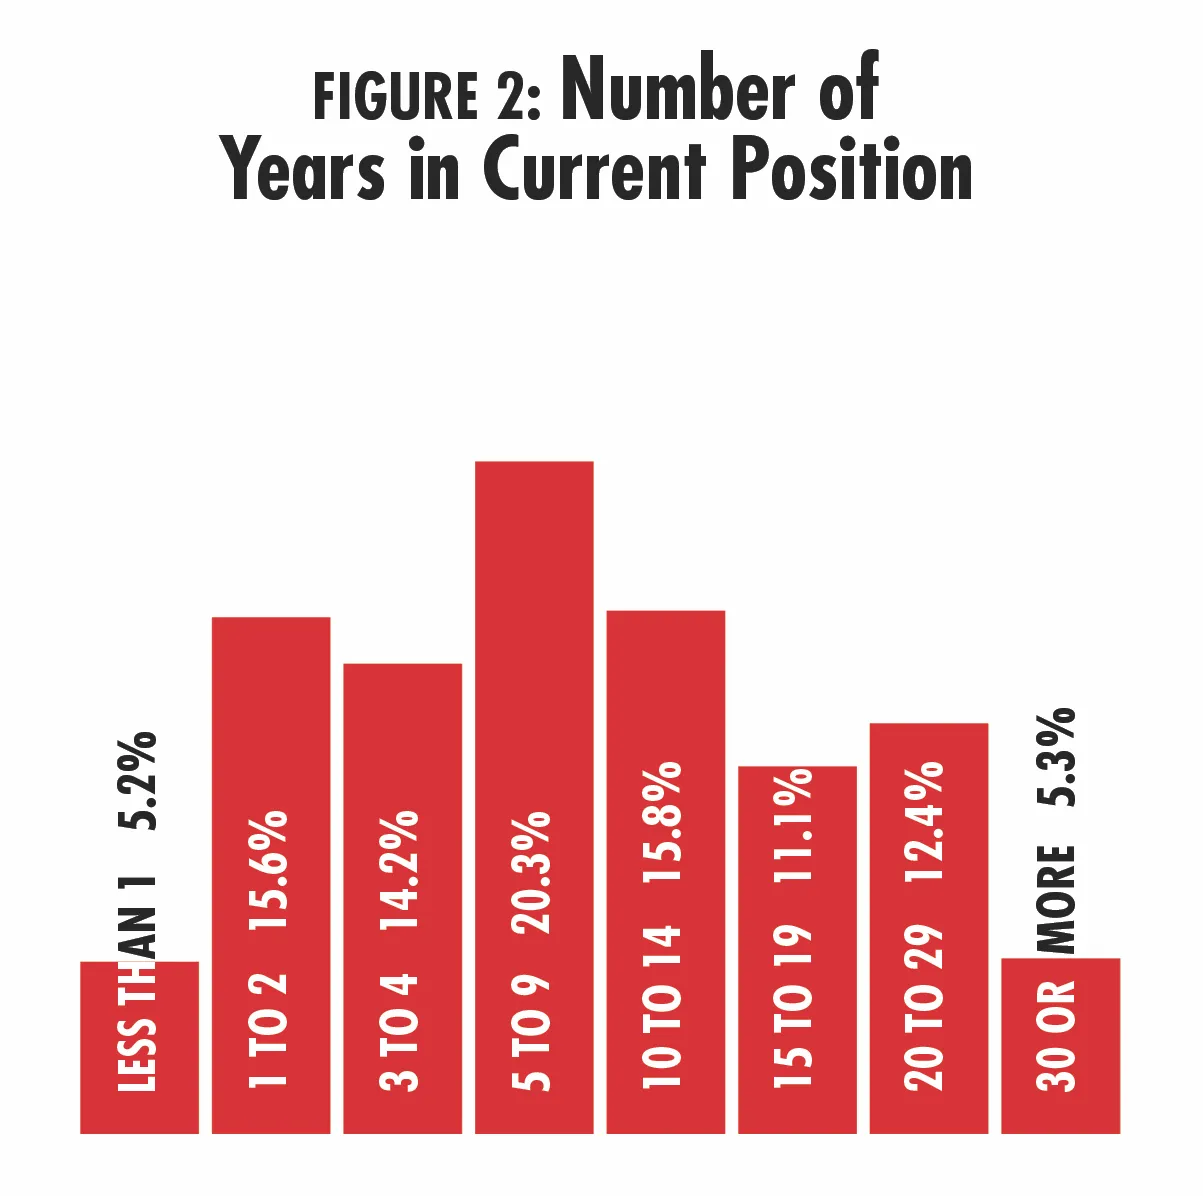
On average, respondents have been working in their current position for 11.3 years. Some 44.6 percent of respondents said they had been in their current position for at least 10 years, with 17.7 percent indicating they'd been in their current job for 20 years or more. Just over a fifth (20.3 percent) said they'd been in their current position between five and nine years, and 35 percent have been in their current jobs for less than five years. (See Figure 2.)
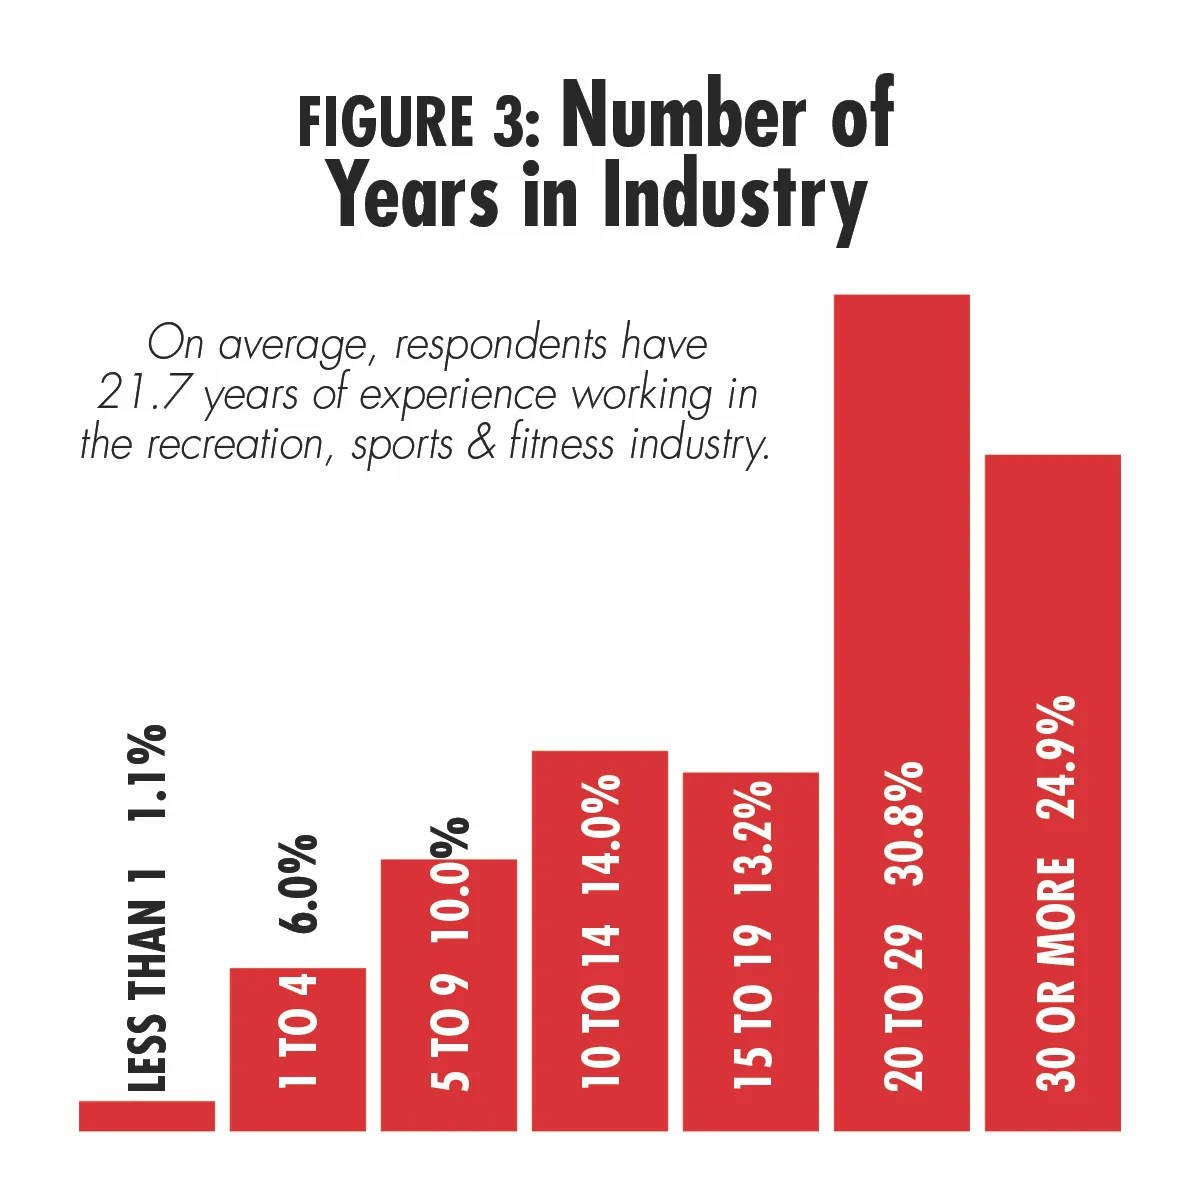
On average, respondents have been working in the recreation, sports and fitness industry for 21.7 years. More than half (55.7 percent) said they had been working in the industry for at least 20 years, and 24.9 percent have been in the industry for 30 years or more. Those with less than 10 years of industry experience make up 17.1 percent of the survey population. (See Figure 3.)
Let's Talk Money
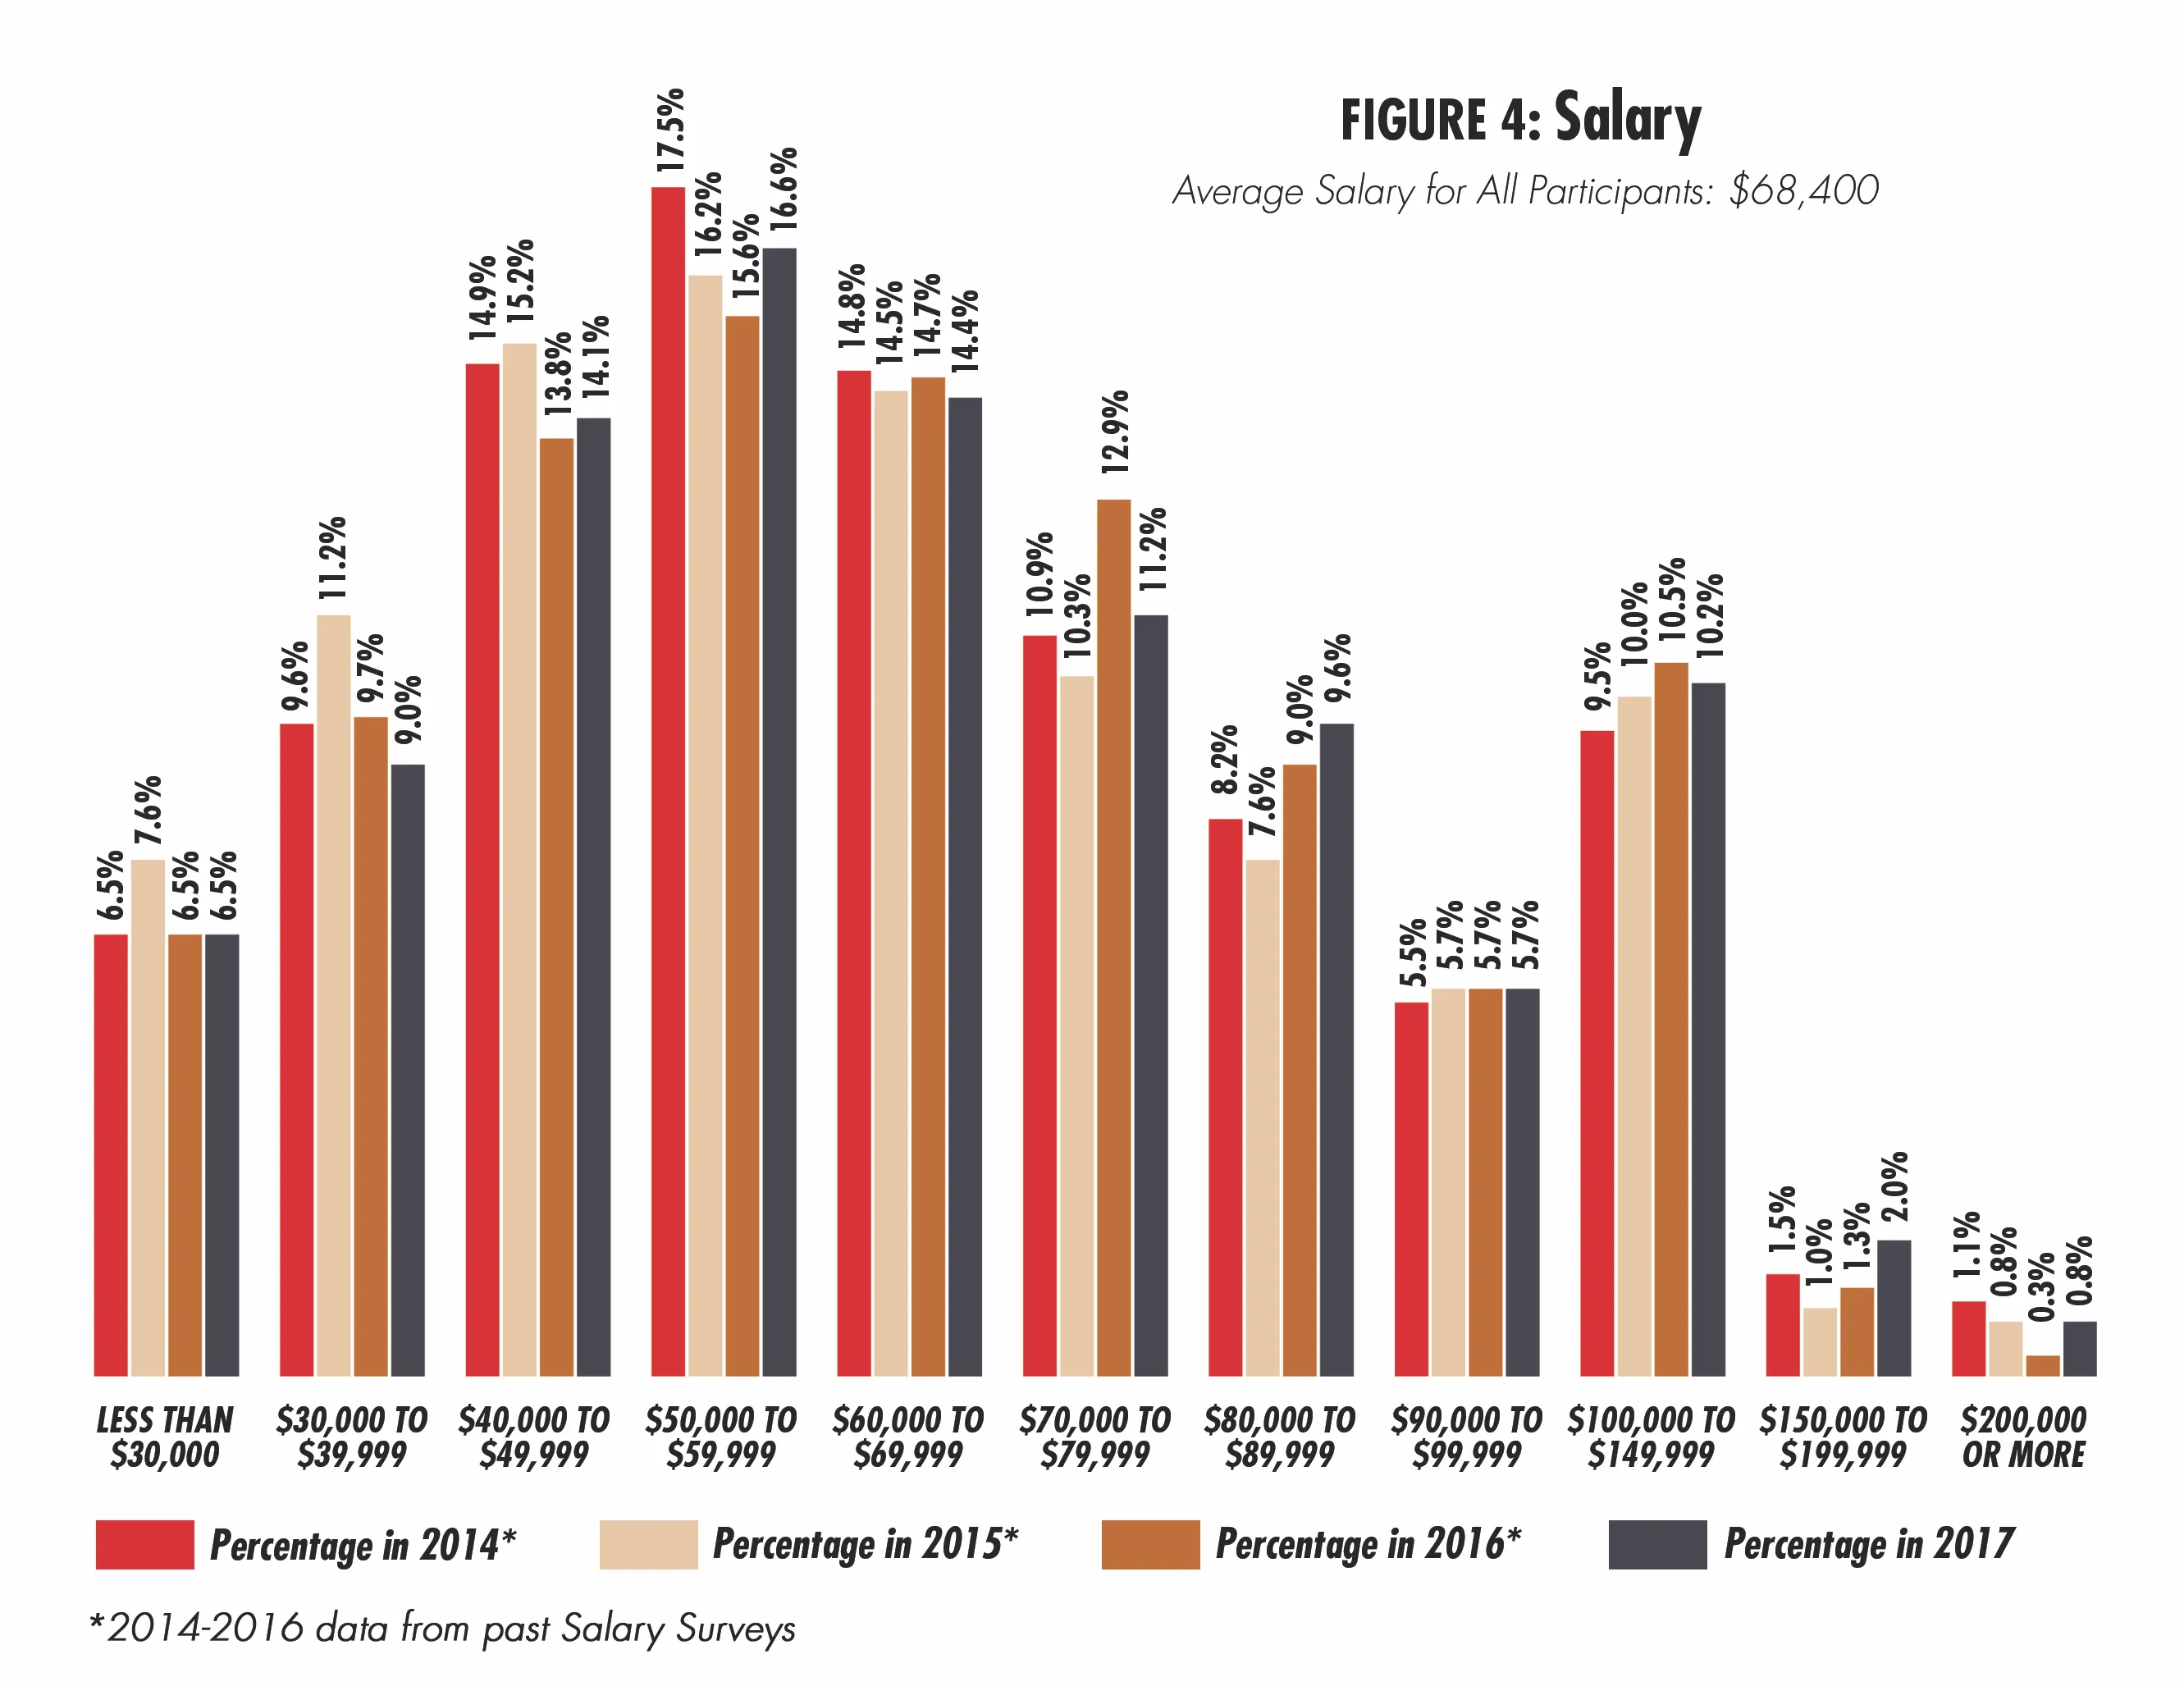
Last year's salary survey showed a 2.6 increase in the average salary over 2015. In 2017, the average salary was up 1.6 percent from 2016, to $68,400.
There was a slight increase to the percentage of respondents who said they earned more than $100,000, from 12.1 percent in 2016 to 13 percent in 2017. The percentage of respondents who said they earned a salary between $50,000 and $100,000 held fairly steady, falling slightly from 57.9 percent in 2016 to 57.5 percent in 2017. The percentage of respondents earning less than $50,000 fell slightly, from 30 percent in 2016 to 29.6 percent in 2017. (See Figure 4.)
While overall, respondents saw a 1.6 percent increase in their average salary, some industry segments saw greater increases. The sharpest increase was seen among respondents from resorts and resort hotels, who saw an increase of 24.9 percent from 2016 to 2017. They were followed by YMCAs, with a 9.7 percent increase, health clubs (8.2 percent), golf and country clubs (6.1 percent), schools and school districts (3.4 percent), and parks (1.5 percent). (See Figure 5.)
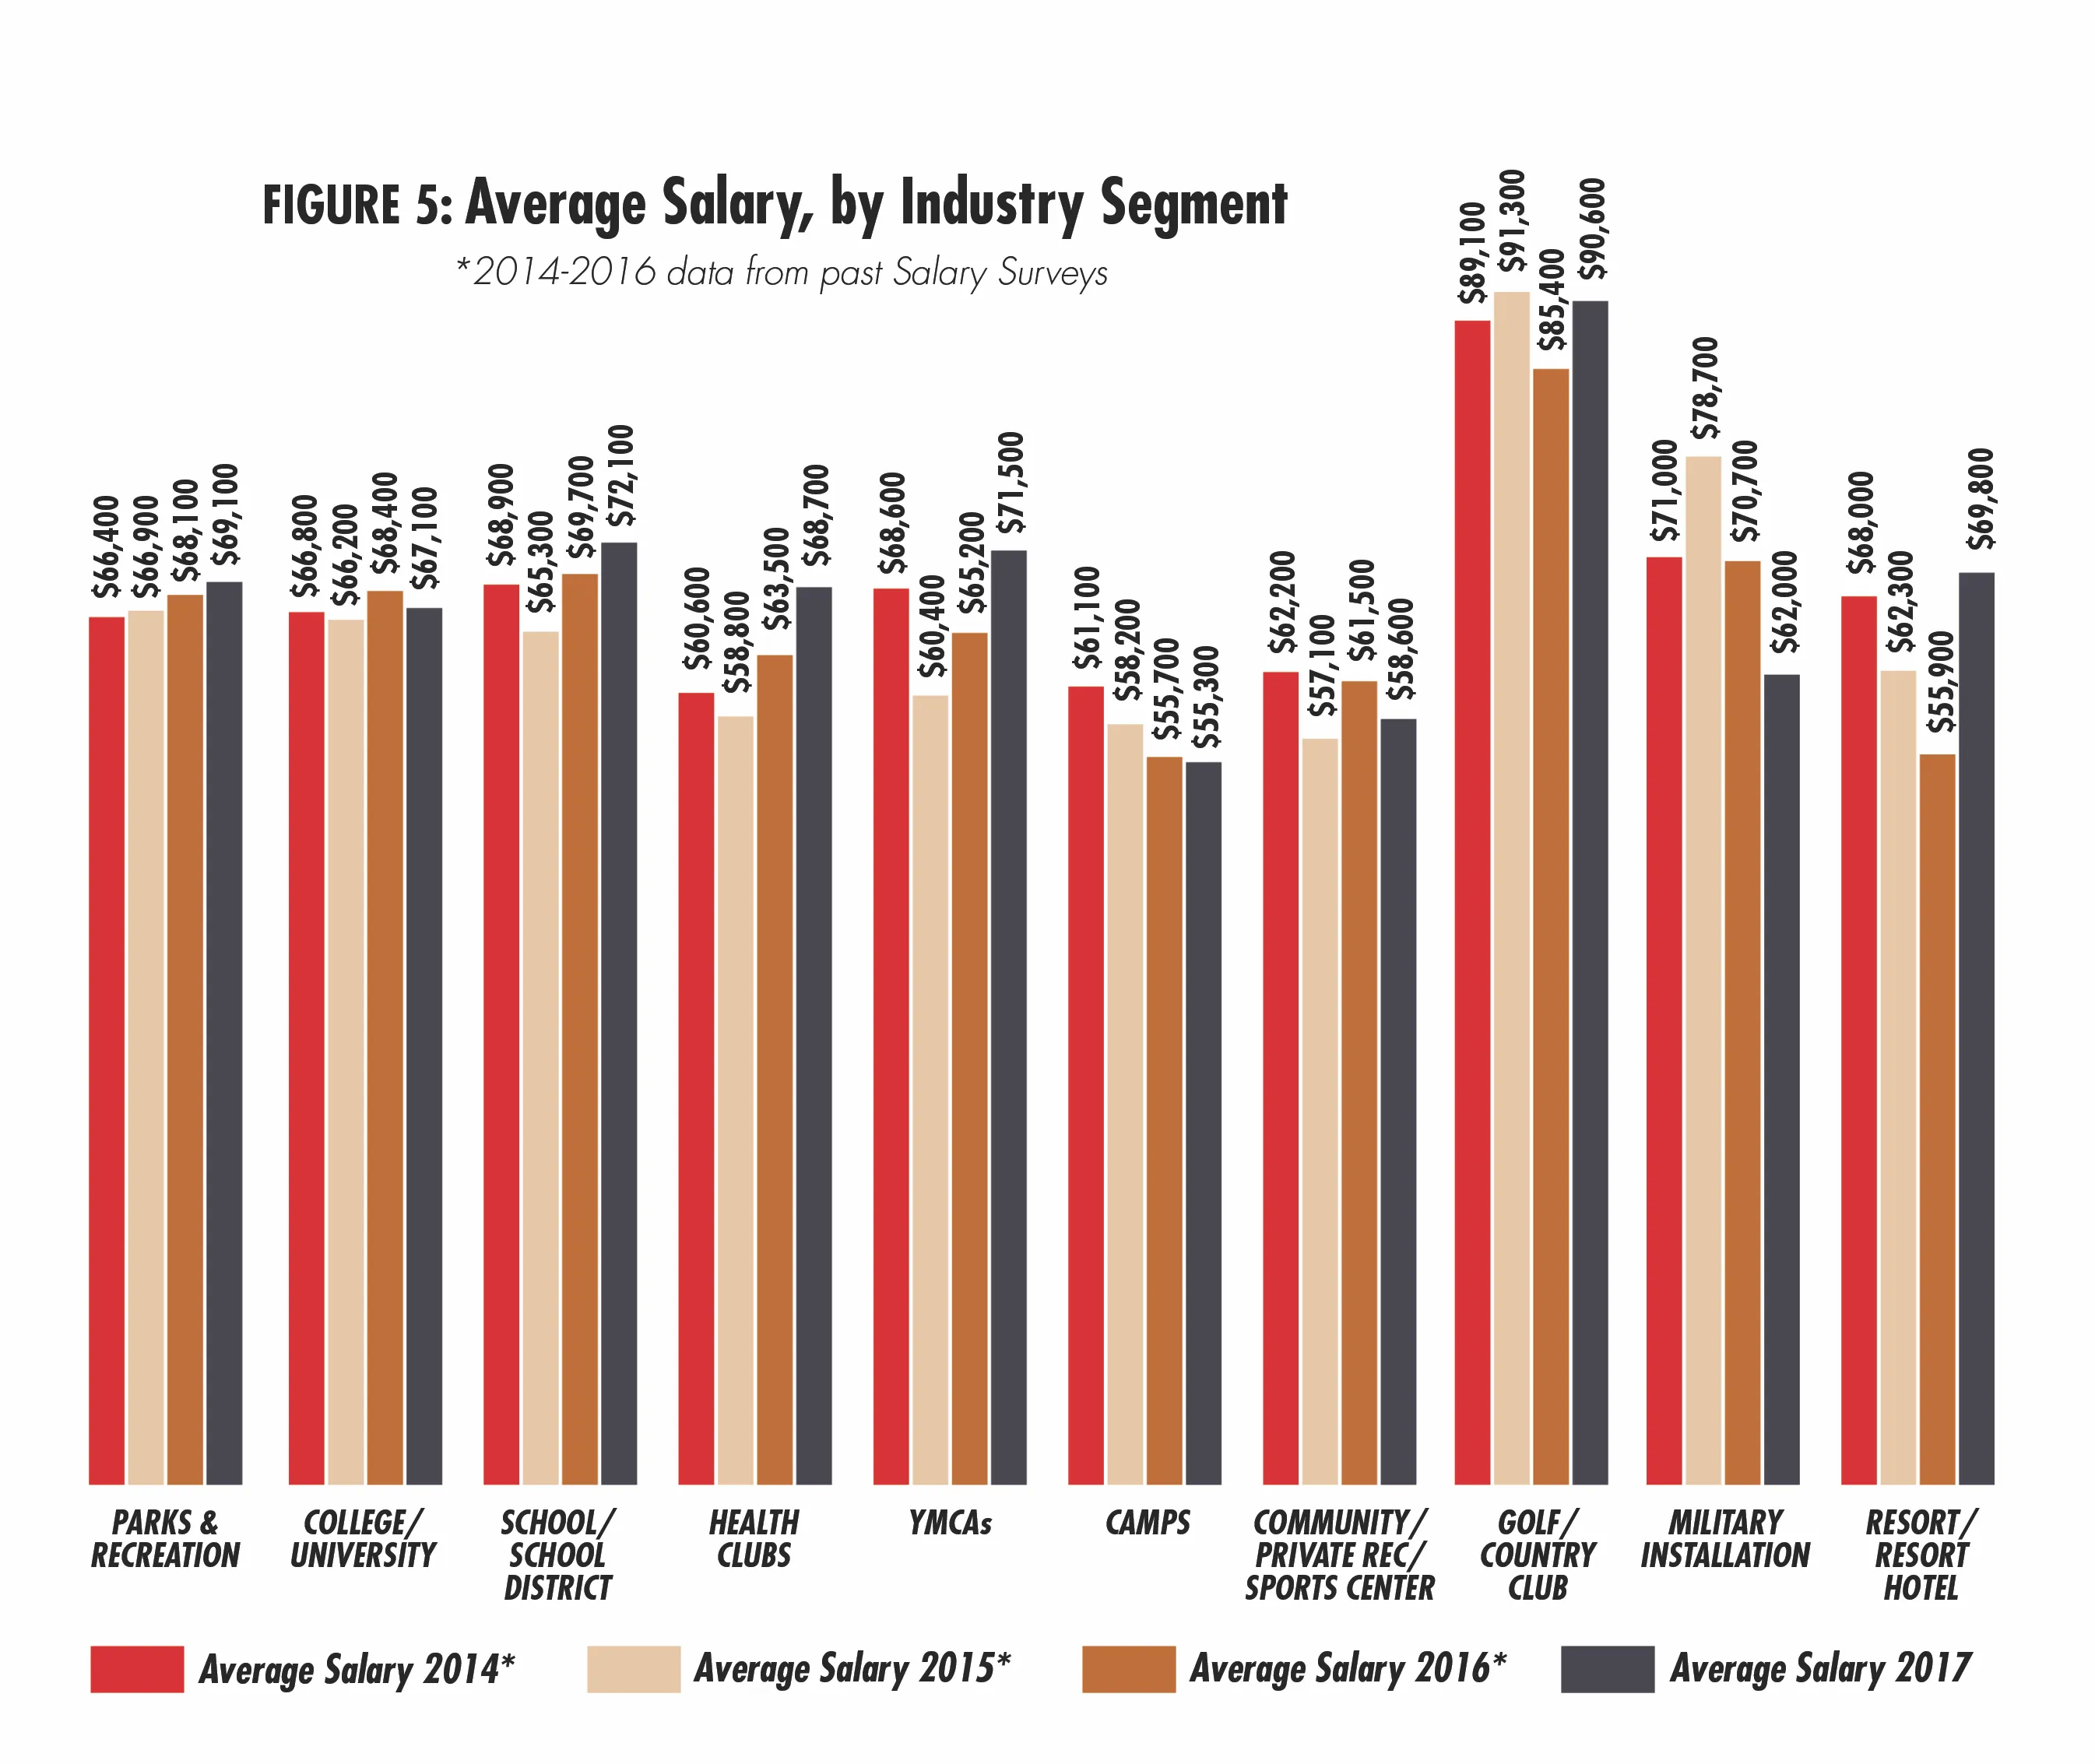
Some industry segments did report a decrease in average salary from 2016 to 2017. The greatest decrease was reported by respondents from military installations, whose average salaries fell 12.3 percent from 2016 to 2017. Other industry segments reporting decreases include: community and private recreation and sports centers (down 4.7 percent), colleges and universities (down 1.9 percent) and camps (down 0.7 percent).
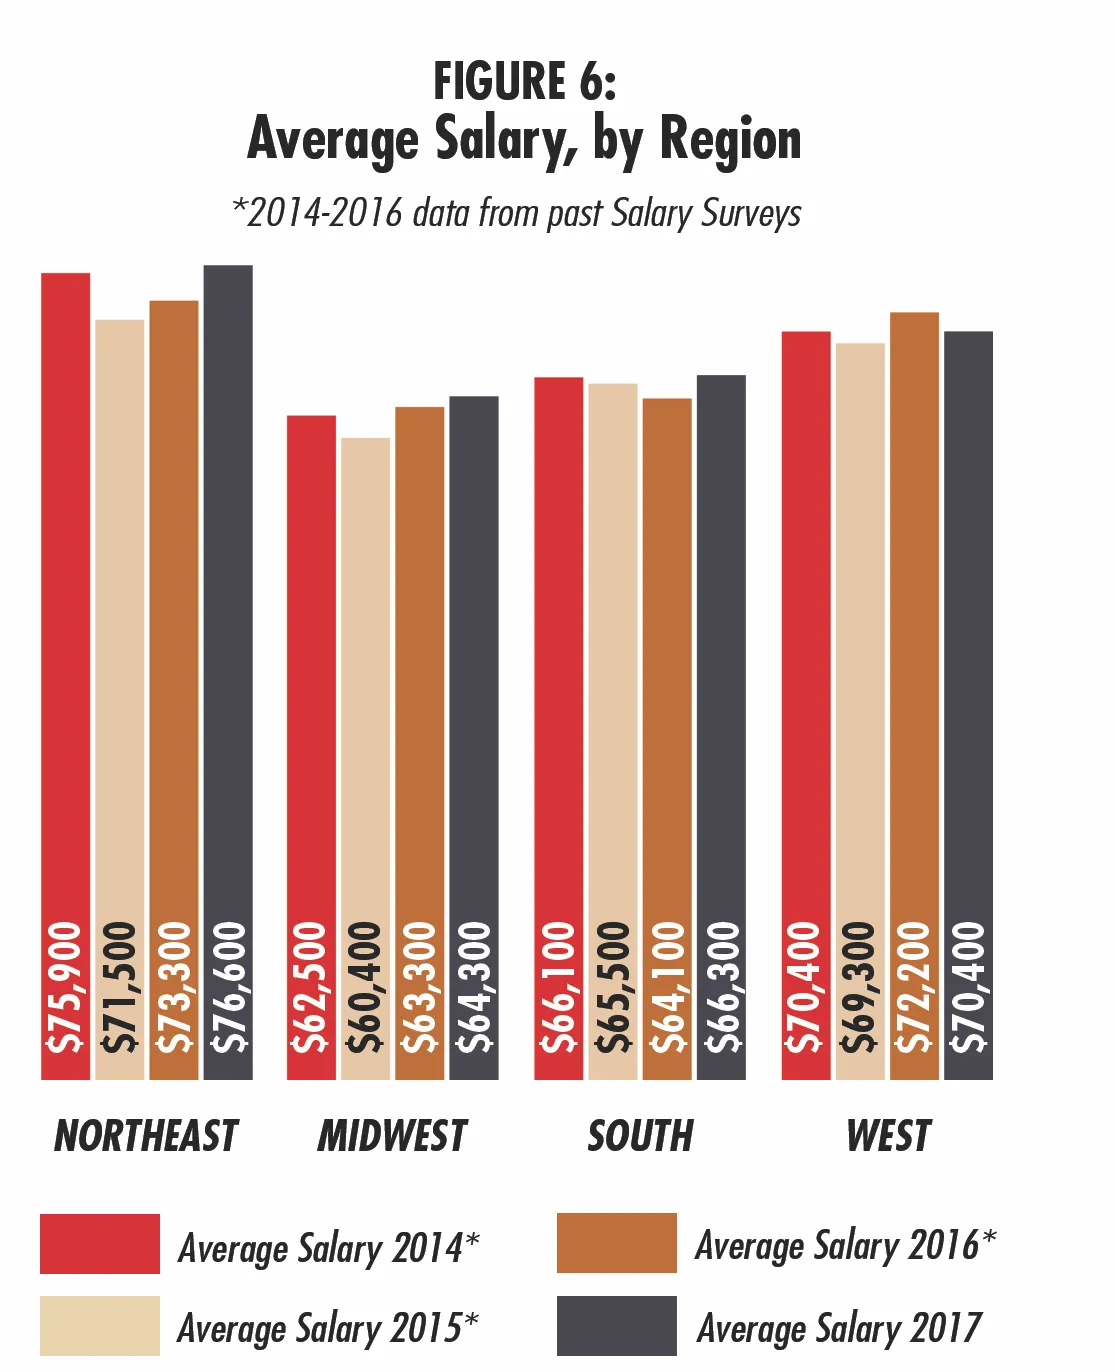
Respondents from the Northeast region continue to be the highest earners, with an average salary of $76,600, 12 percent higher than the average for all respondents. In addition, respondents in this region saw the greatest increase in salary from 2016 to 2017, with a 4.5 percent jump from an average of $73,300. Respondents from the South saw the second-highest increase to salaries, with an increase of 3.4 percent from $64,100 in 2016 to $66,300 in 2017. Respondents in the Midwest reported a more modest increase of 1.6 percent, while the West was the only region to report a decrease in average salaries, which fell 2.5 percent from $72,200 in 2016 to $70,400 in 2017. (See Figure 6.)
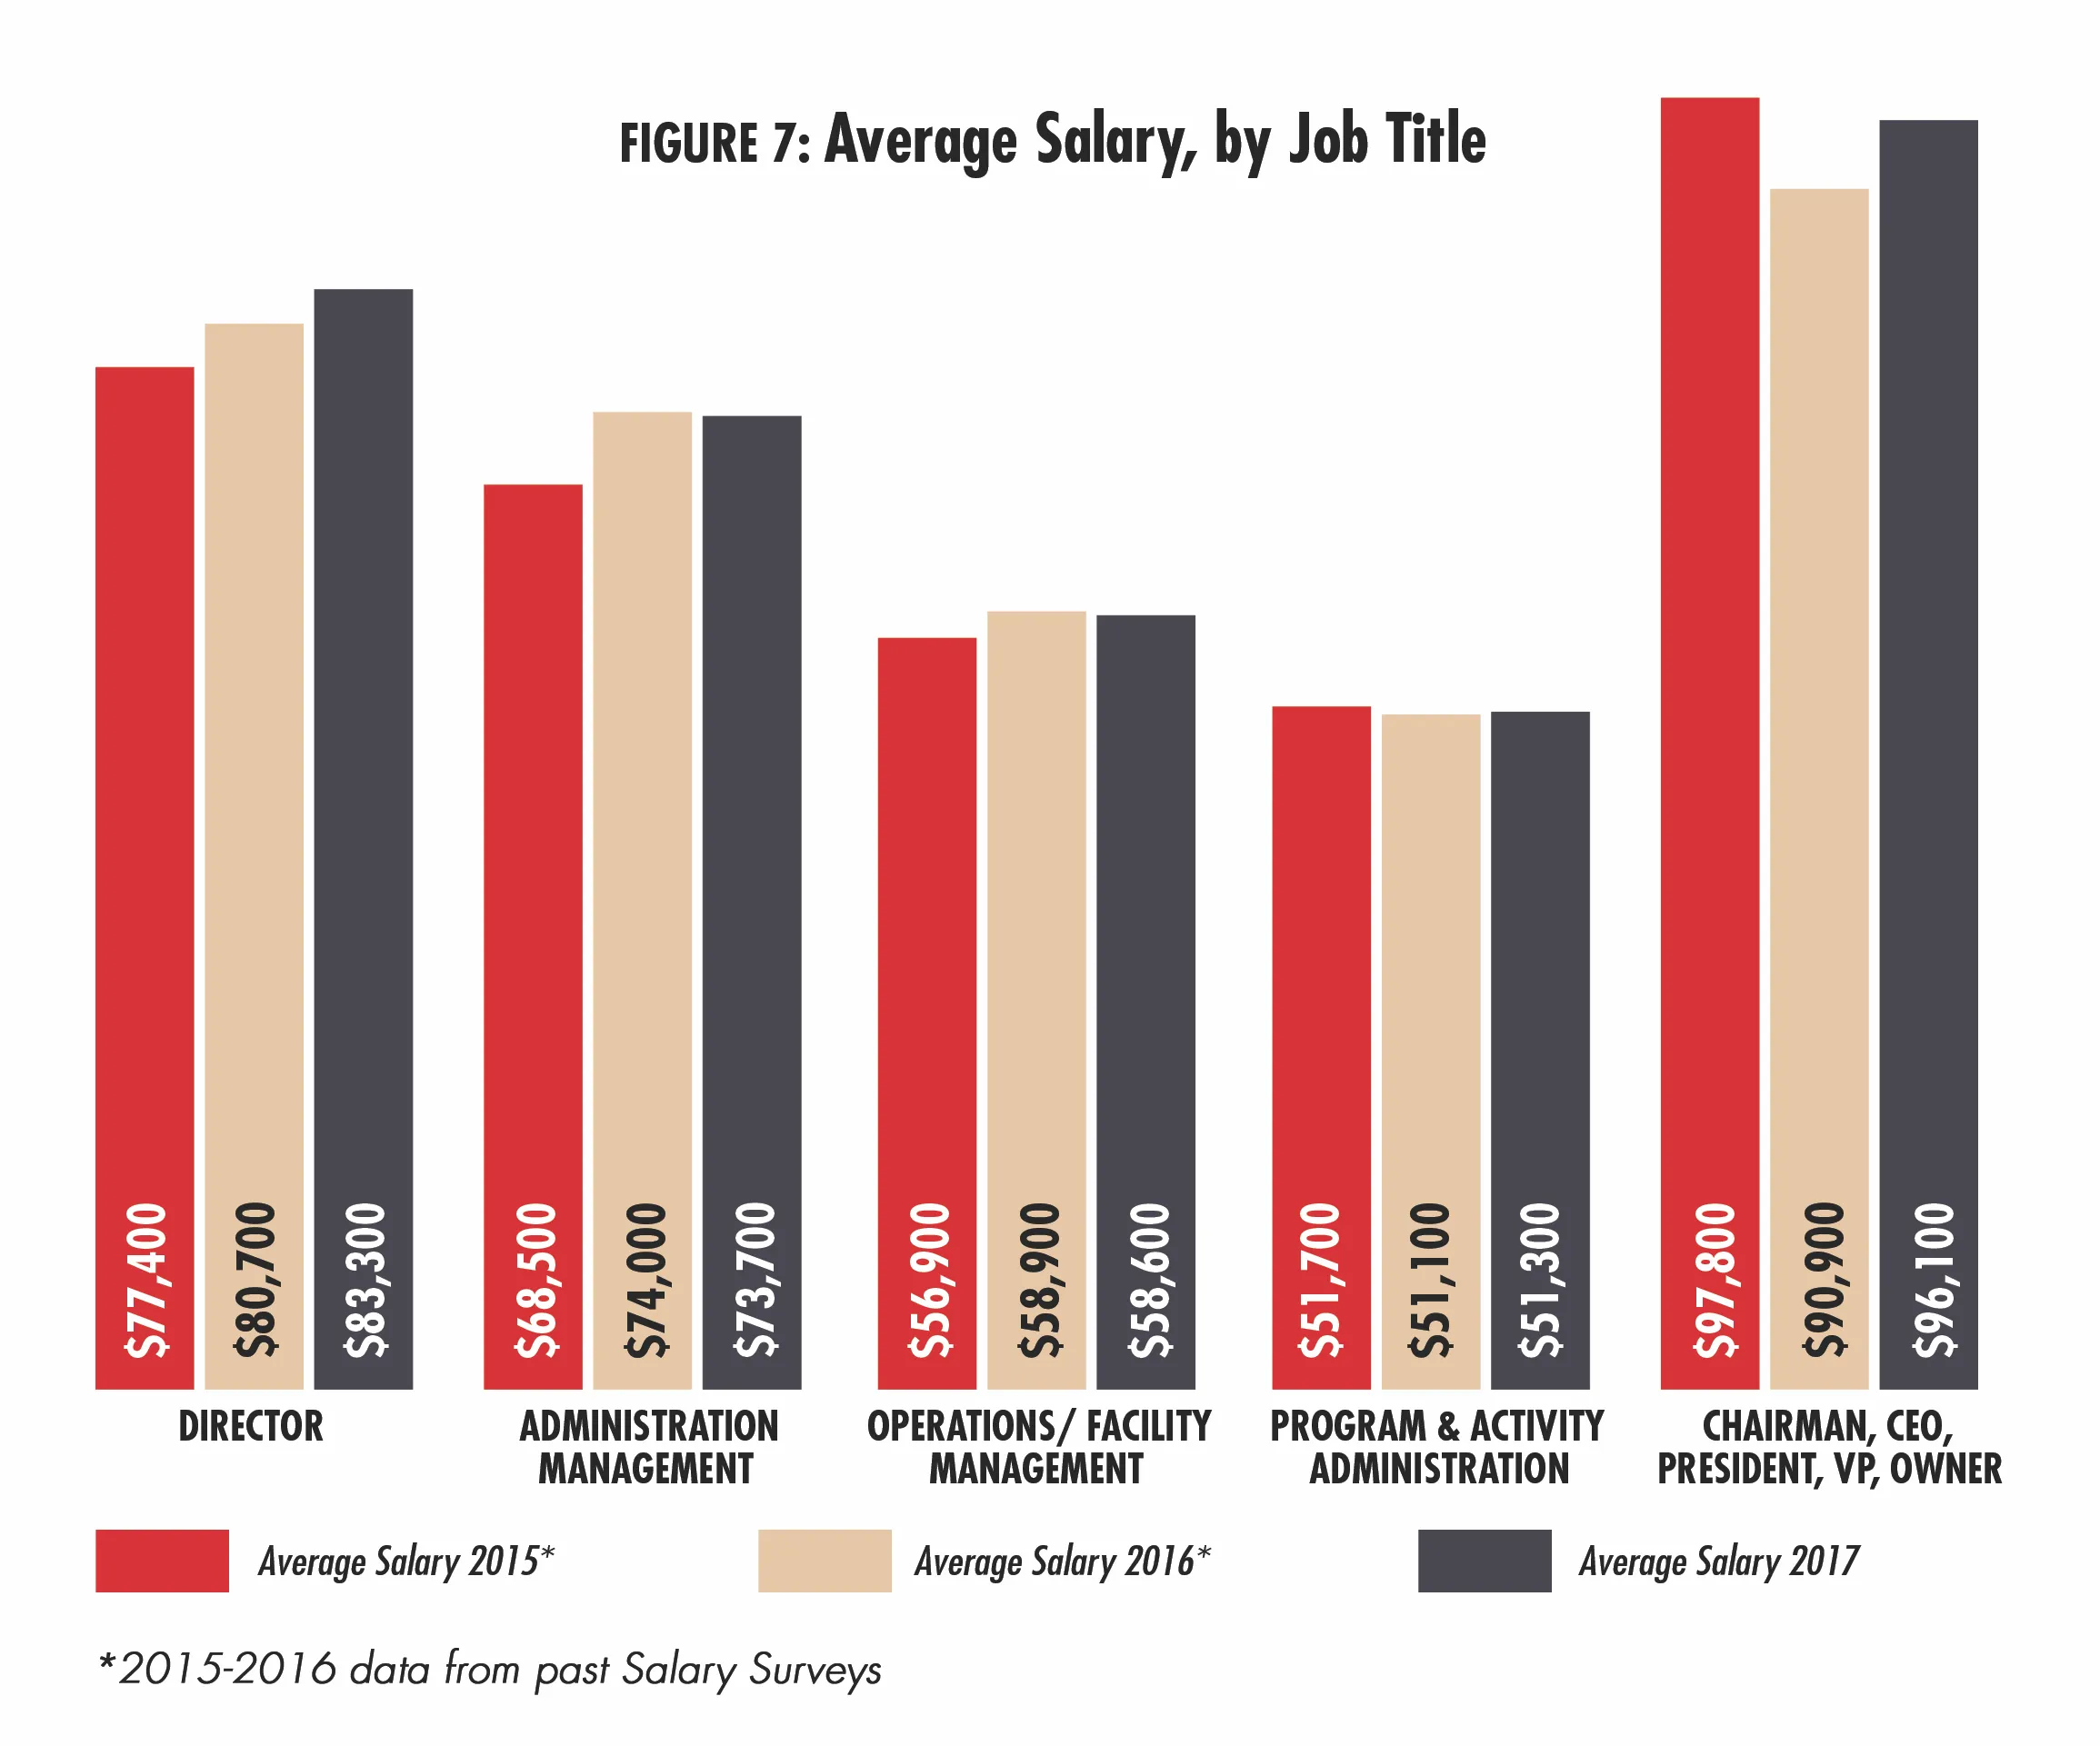
Respondents who are the chairman, CEO, president, vice president or owner of their organizations again earned the highest average salary by job title, earning 40.5 percent more than the average for all respondents. They also reported the greatest salary increase from 2016 to 2017, with their average salary growing 5.7 percent from $90,900 in 2016 to $96,100 in 2017. Respondents with the "Director" job title also reported a salary increase in this time period, with a jump of 3.2 percent. Respondents in program and activity administration reported a much more modest, 0.4 percent increase to average salaries, while those in administration management, and operations and facility management saw their average salary decrease slightly from 2016 to 2017, by 0.4 percent and 0.5 percent, respectively. (See Figure 7.)
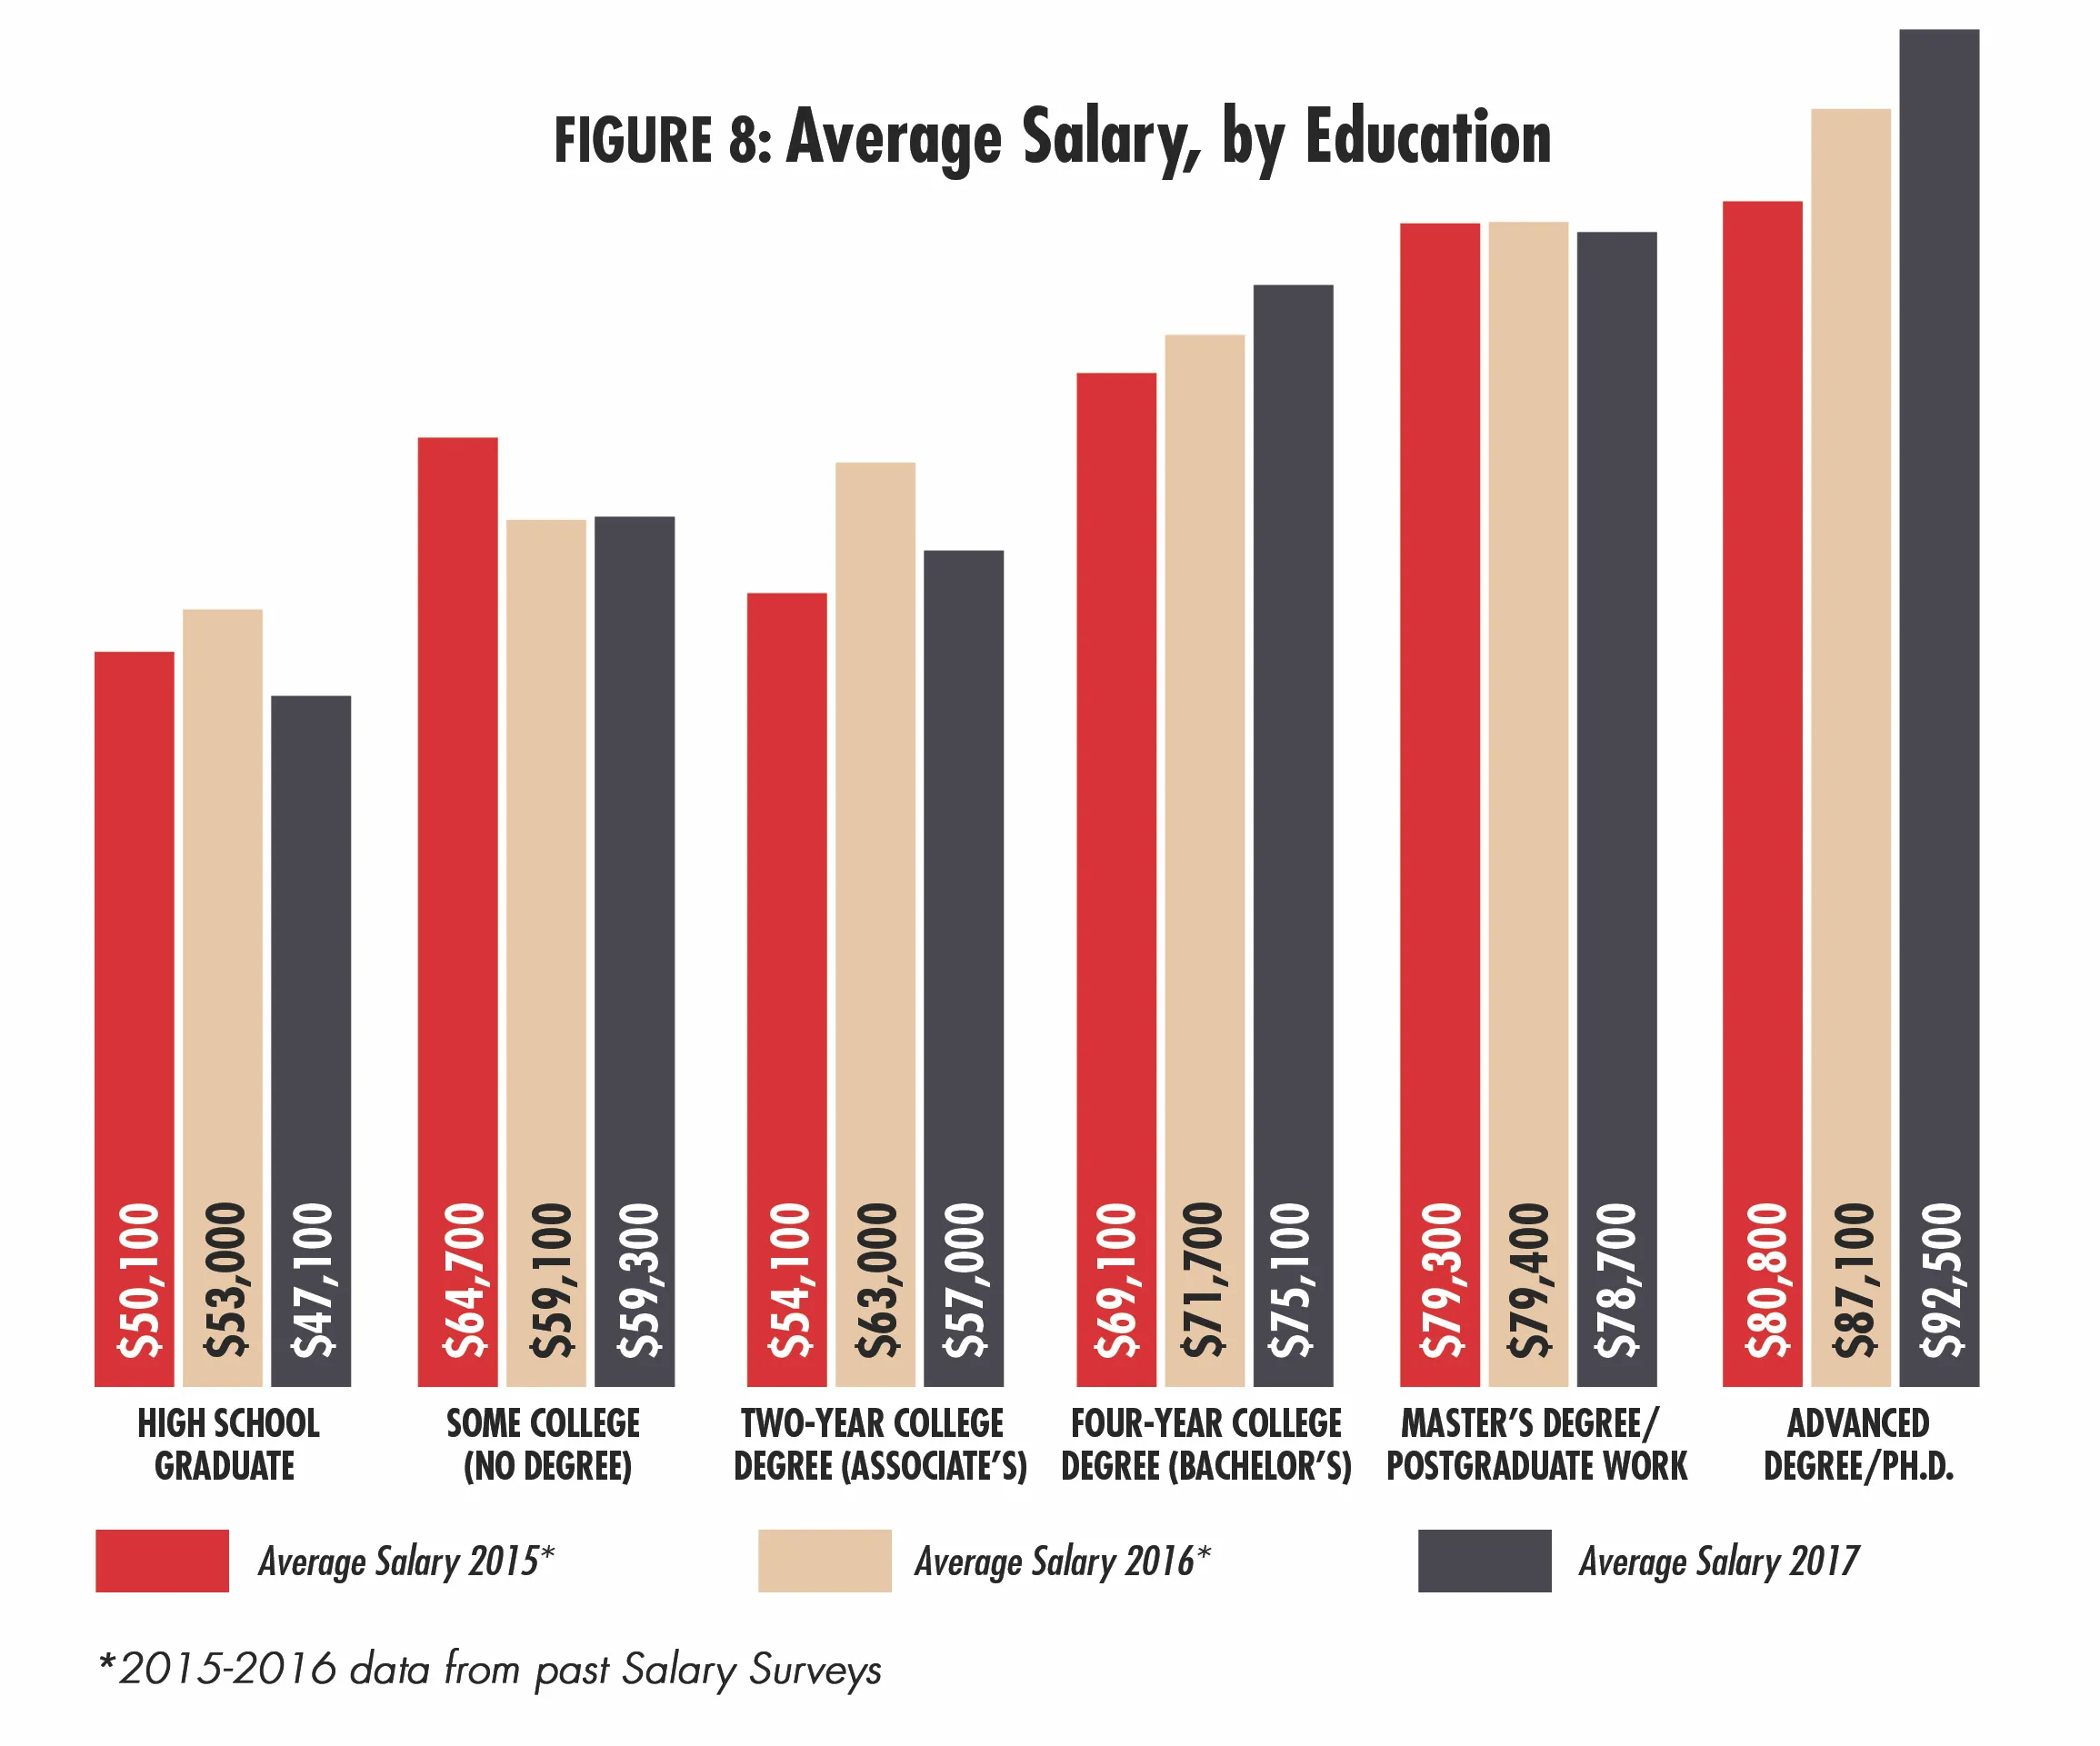
Typically, the higher the level of education a respondent has achieved, the higher their salary. Respondents with advanced degrees reported the highest average salary of all respondents, at $92,500. They also saw the greatest increase to their salaries from 2016, with a rise of 6.2 percent. Respondents with bachelor's degrees also reported an increase, with their average salaries rising 4.7 percent, from $71,700 in 2016 to $75,100 in 2017. The only other respondents who reported an increase to average salaries were those with some college, but no degree. Their average salary remained virtually the same, rising 0.3 percent. Decreases were seen among respondents with master's degrees (a drop of 0.9 percent), associate's degrees (down 9.5 percent), and high school diplomas (11.1 percent). (See Figure 8.)
Over the past several years, the number of respondents who have reported increases to their salaries has gradually risen. While less than half of respondents said they had seen a salary increase from 2012 to 2013, this year, nearly six in 10 (57.4 percent) respondents said they had seen a salary increase in the previous year. Just 7.9 percent reported that their salaries were lower in 2016 than in 2015. (See Figure 9.)
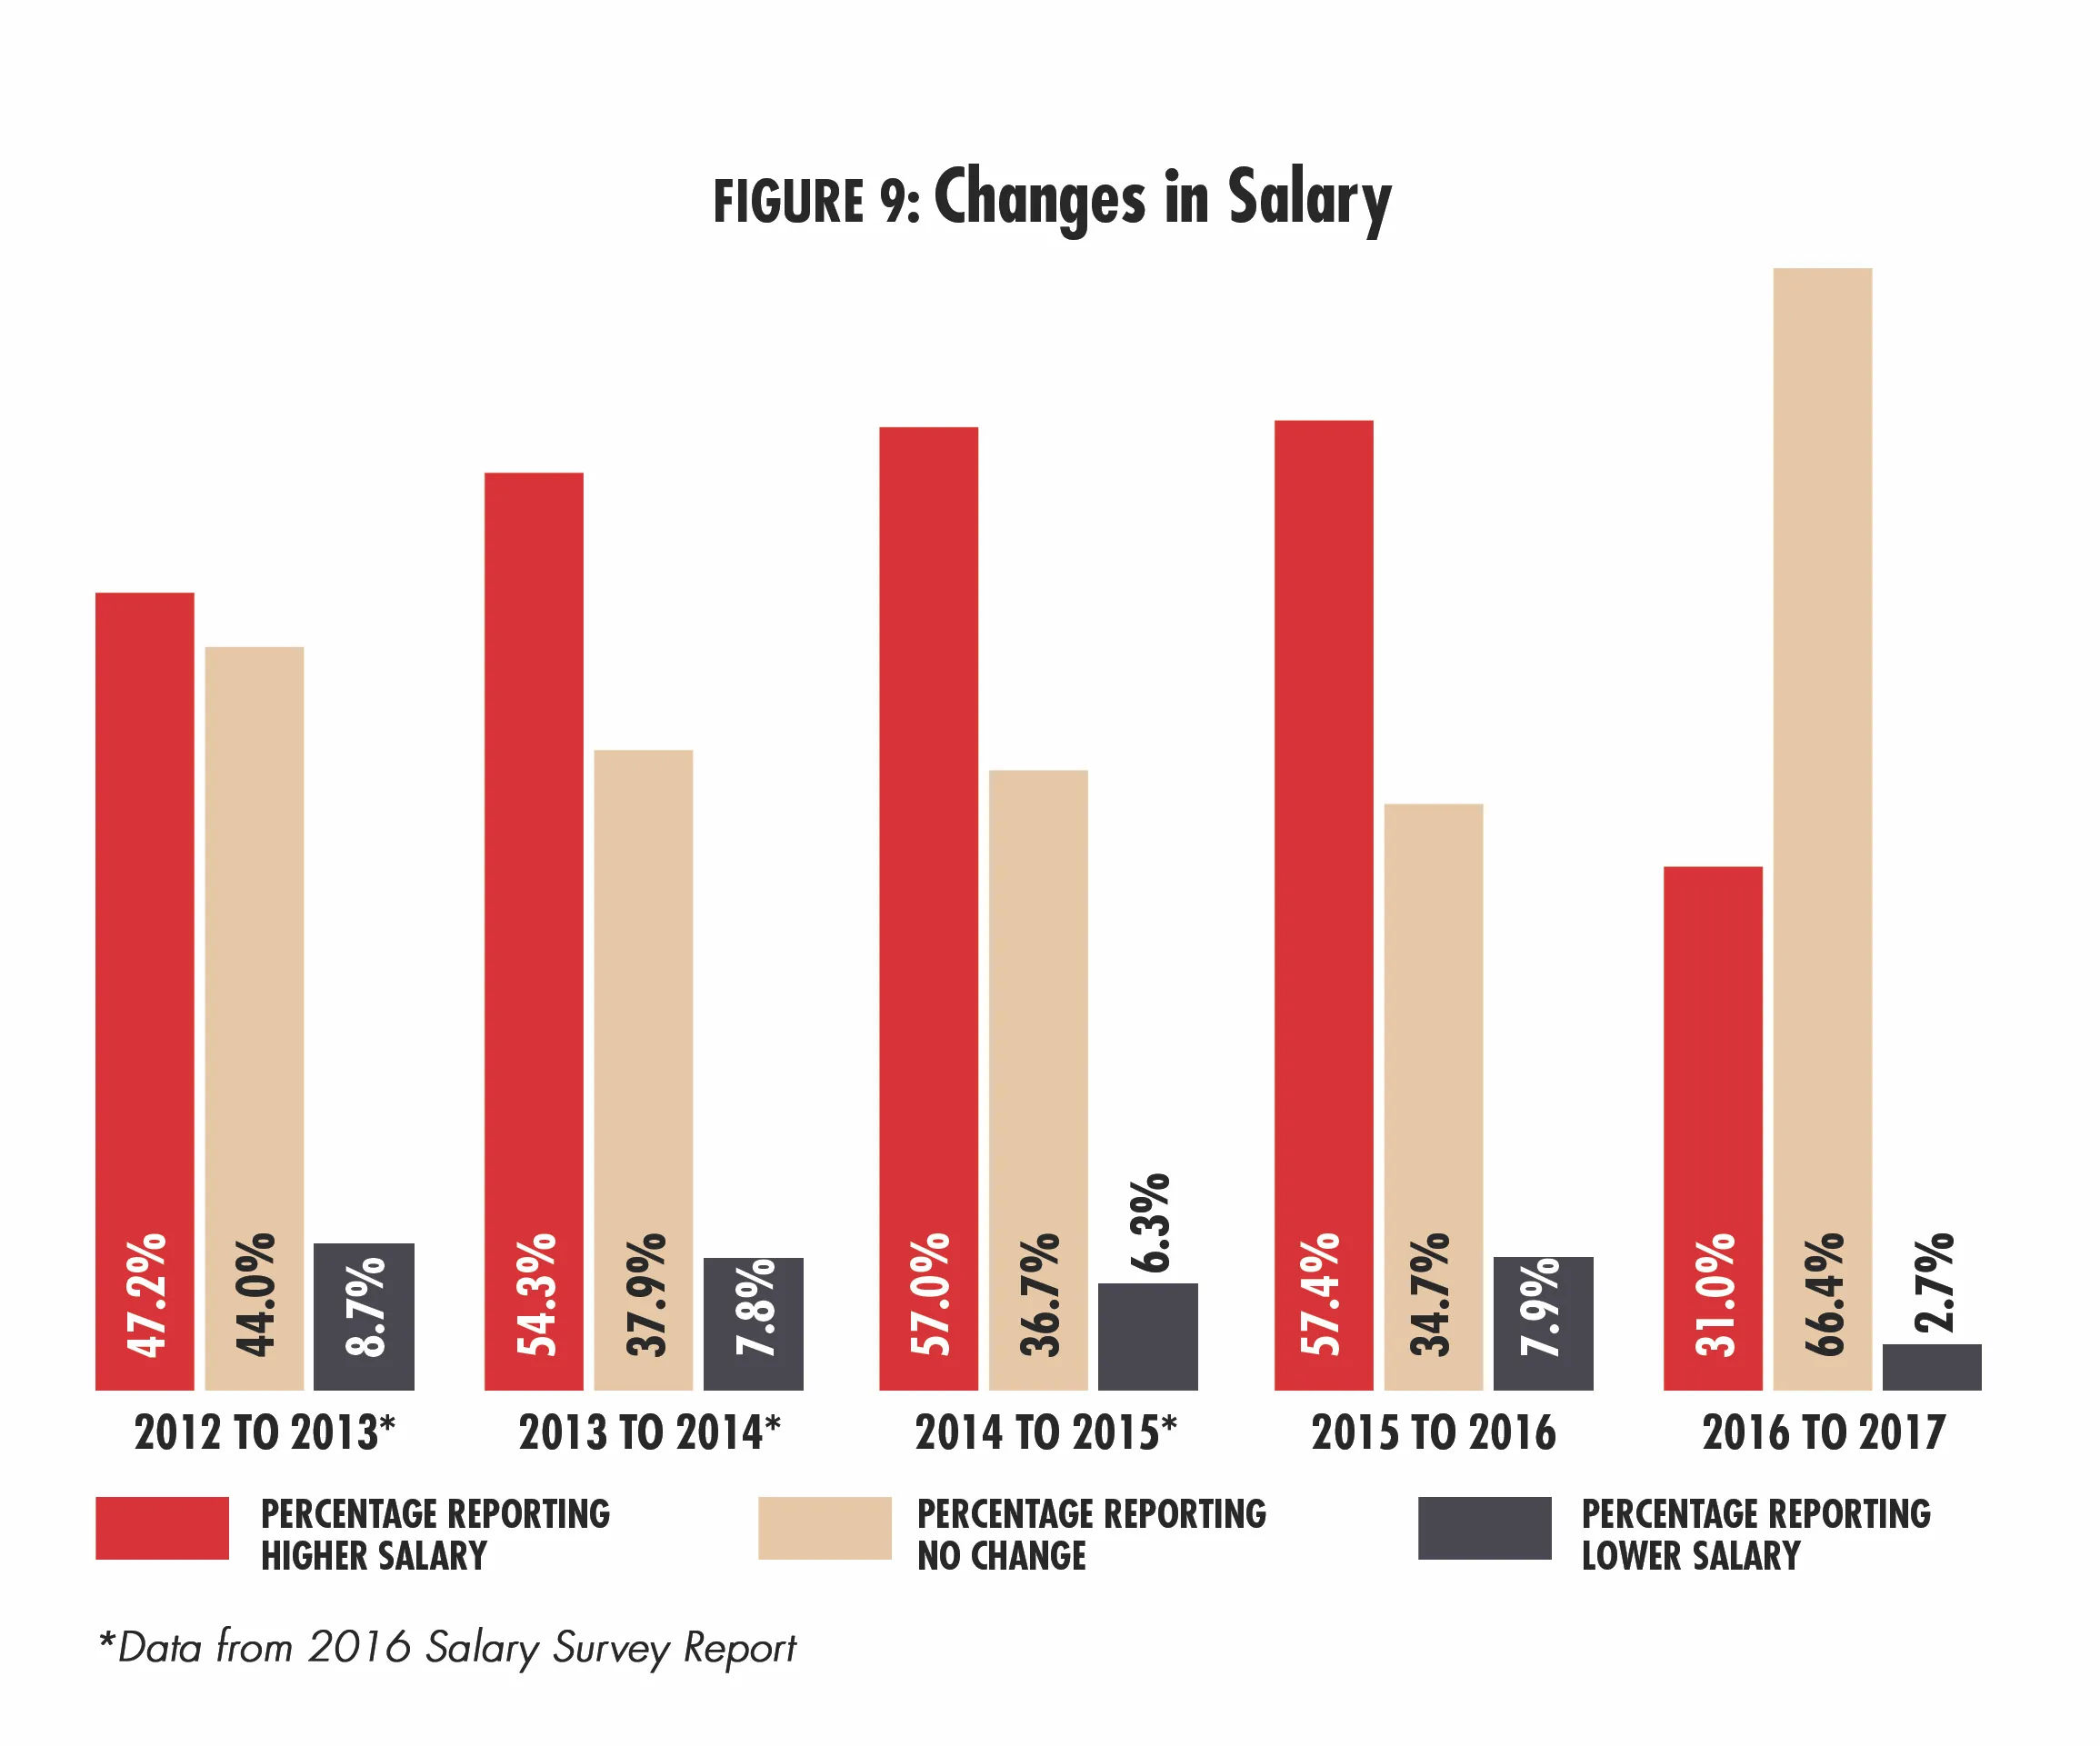
Typically, the percentage of respondents who project increases to their salaries is actually much lower than the percentage who end up receiving a salary increase. (Perhaps we're all afraid of jinxing ourselves.) In 2017, 31 percent of respondents said they expect to see a salary increase in 2017. This number can be expected to increase dramatically when we report the number who actually received such an increase in next year's survey.
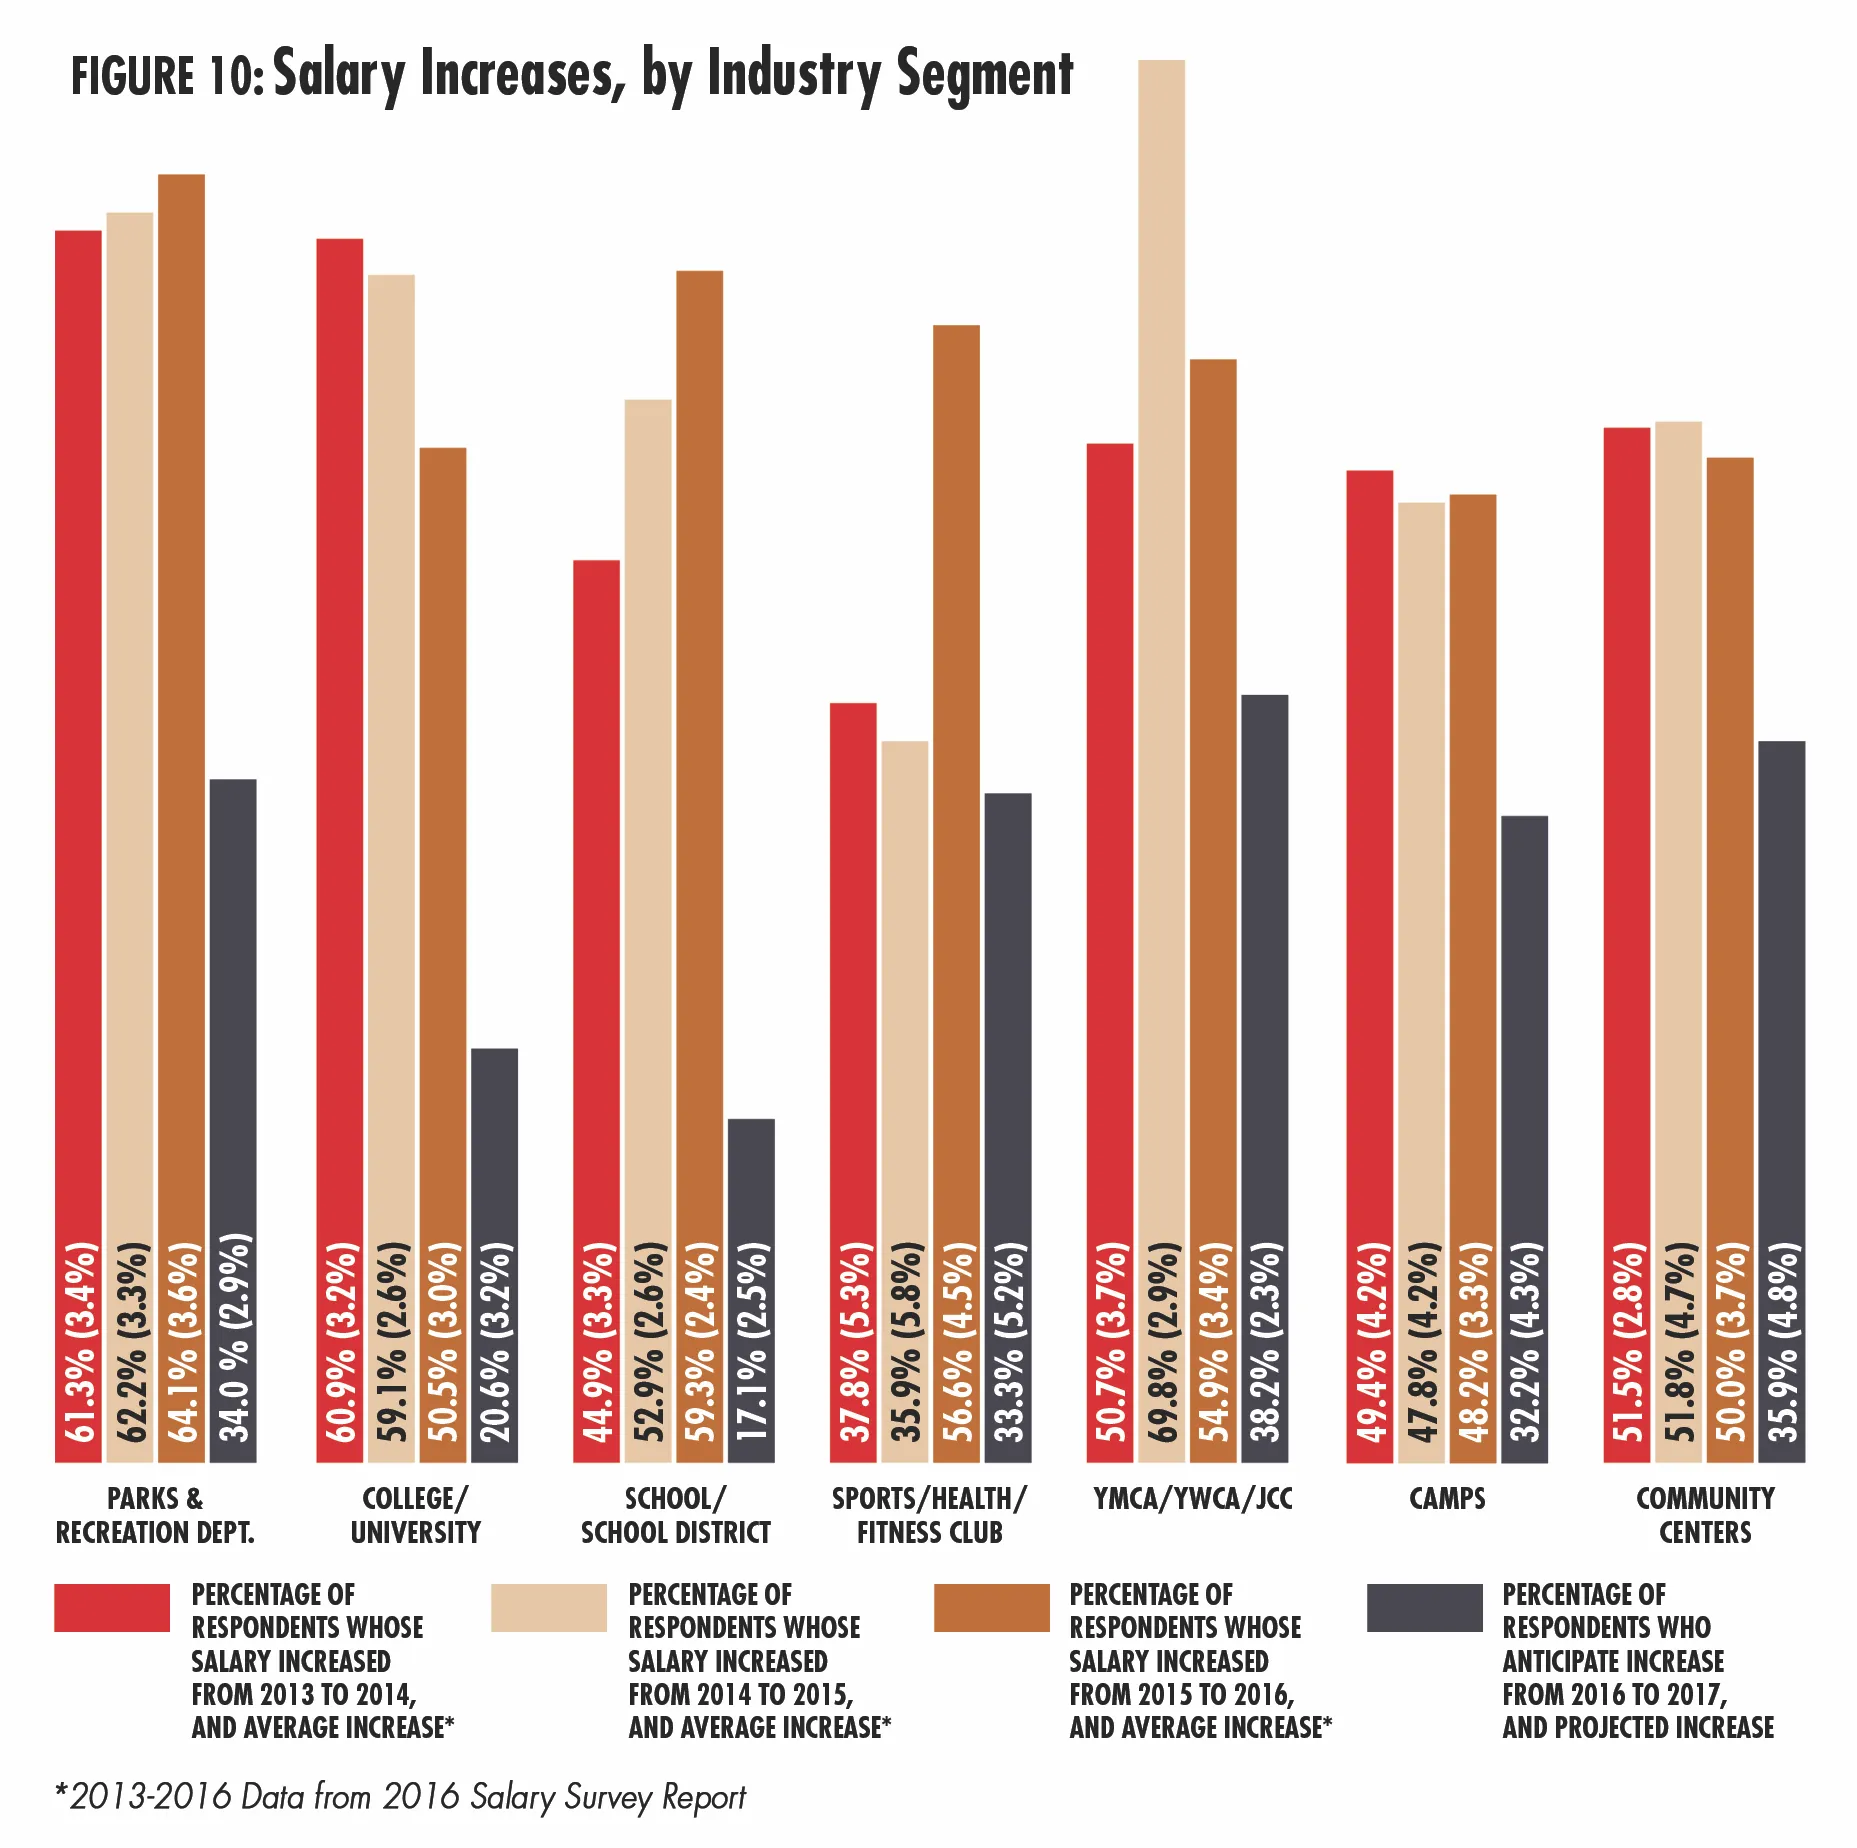
Respondents from parks were the most likely to report that their salaries had increased from 2015 to 2016, with 64.1 percent
indicating they'd seen a salary increase in that time period. They were followd by those from schools and school districts, 59.3 percent of whom reported an increase, and sports, fitness and health clubs, 56.6 percent of whom reported an increase. Respondents from camps were the least likely to see salaries go up in this time frame, though nearly half (48.2 percent) said they had seen an increase. (See Figure 10.)
Hard at Work
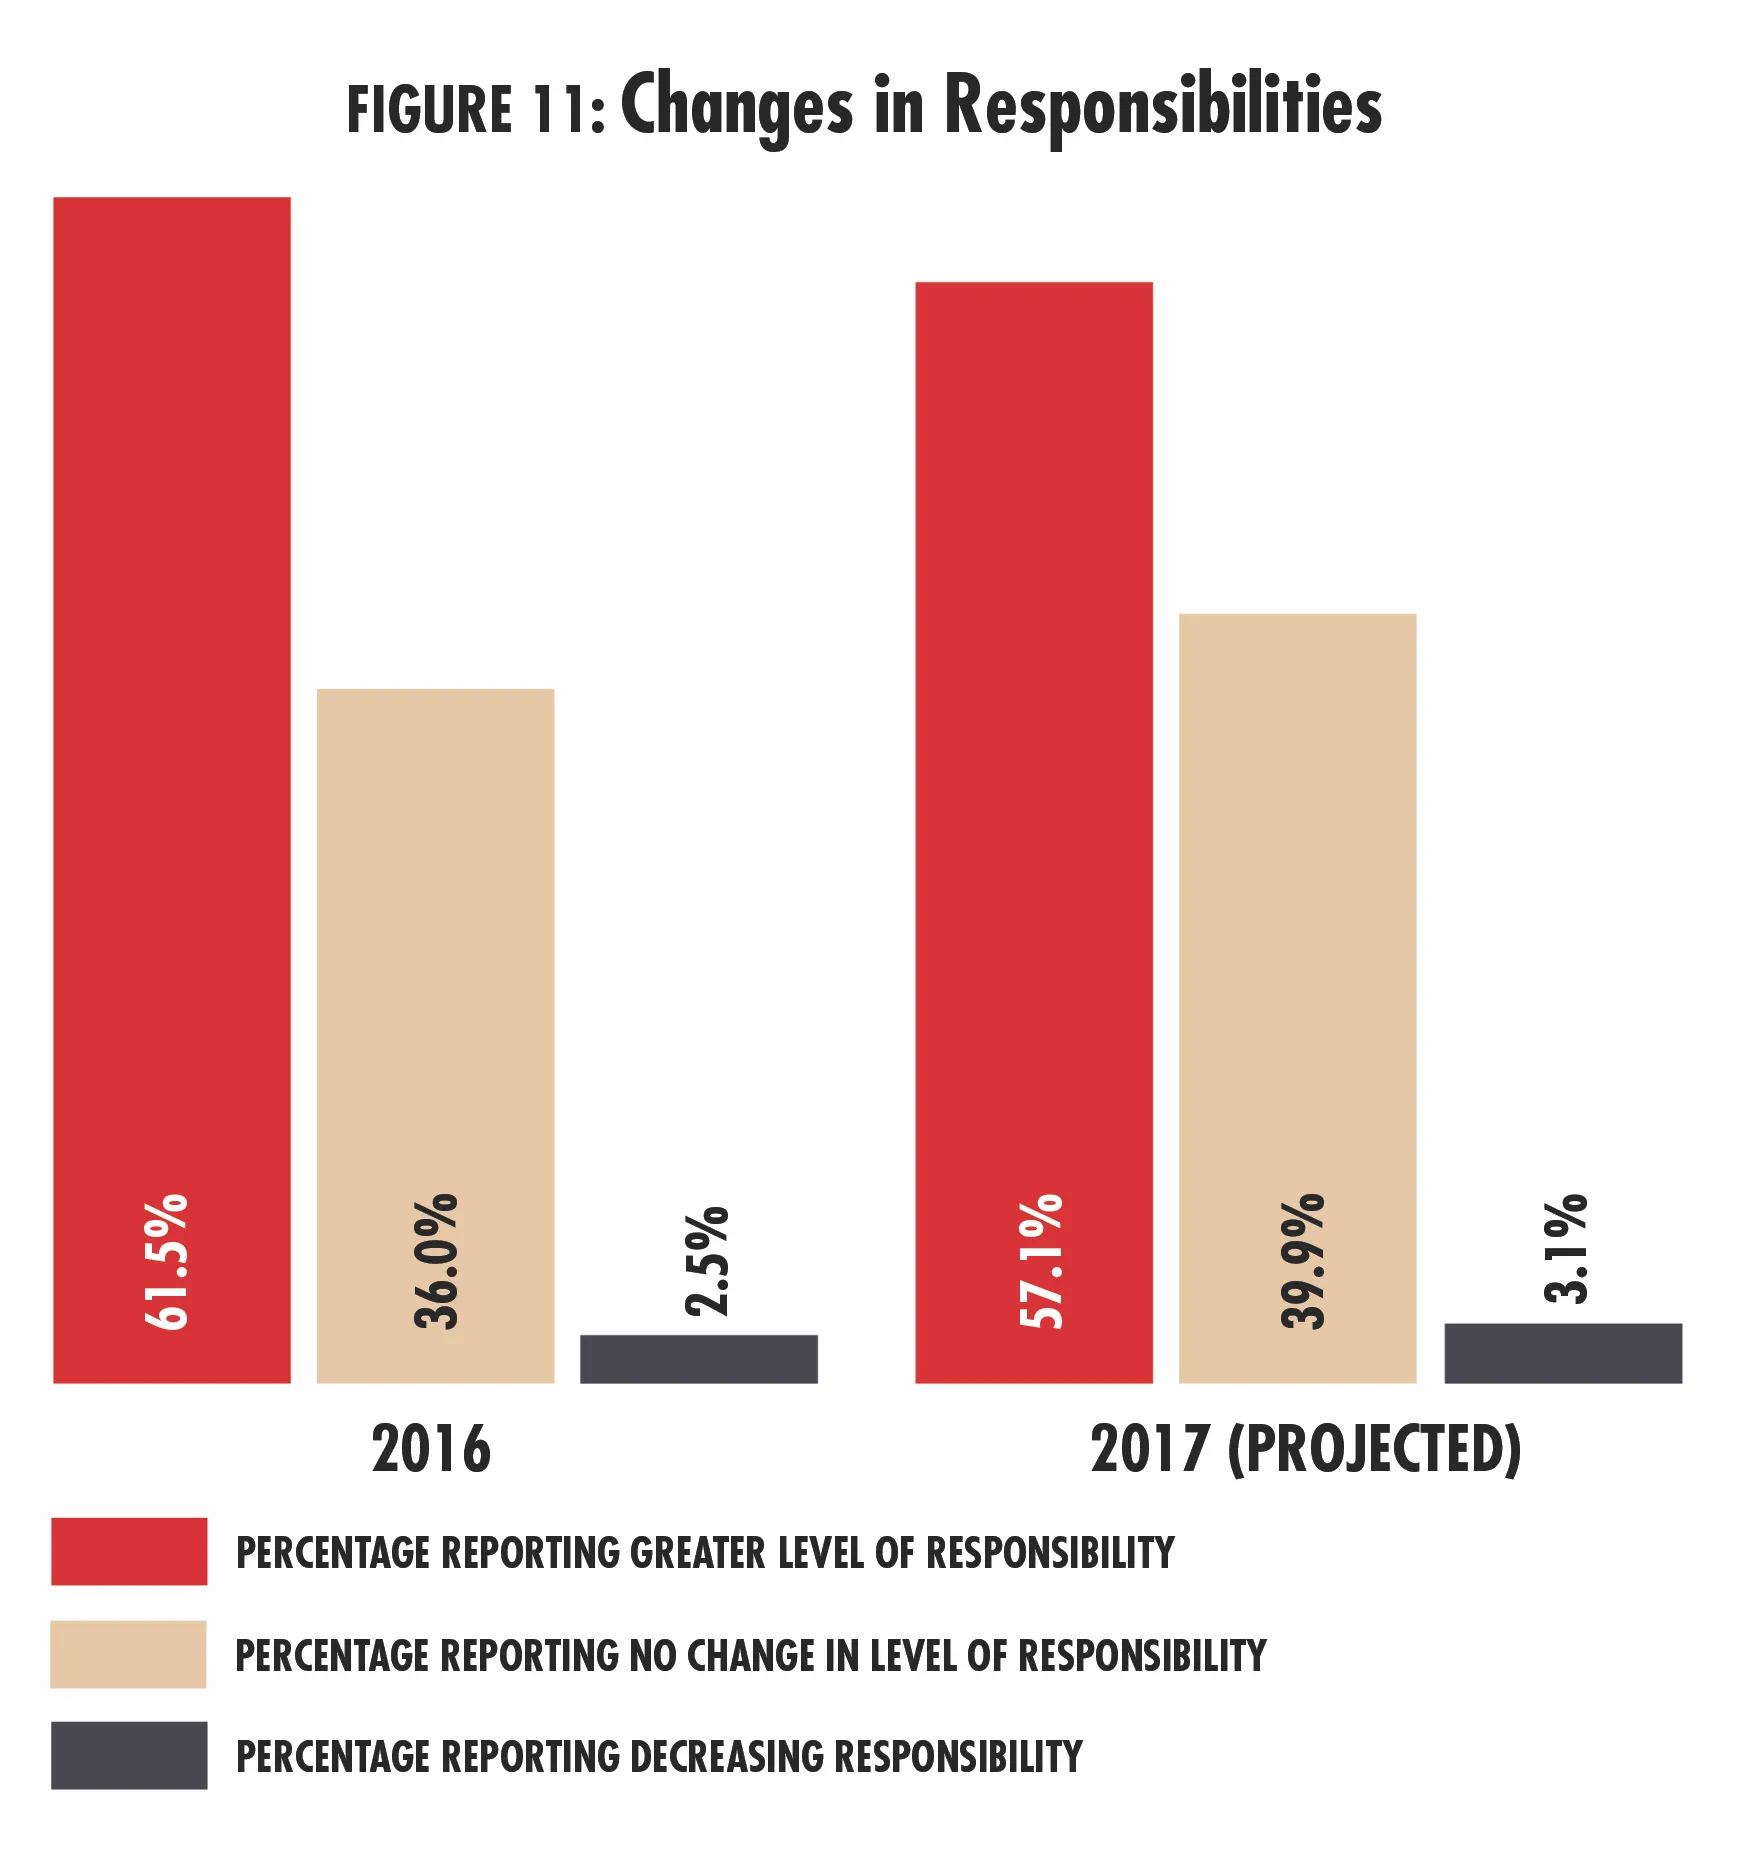
The percentage of respondents who are reporting that their level of responsibility is increasing year-over-year saw a slight increase in 2017. While 59.8 percent said their level of responsibility had increased in 2015, some 61.5 percent said their level of responsibility had increased in 2016. This is still down from 2014, when nearly two-thirds (66.1 percent) saw greater levels of responsibility. Looking ahead, slightly fewer (57.1 percent) are expecting their level of responsibility to increase this year. (See Figure 11.)
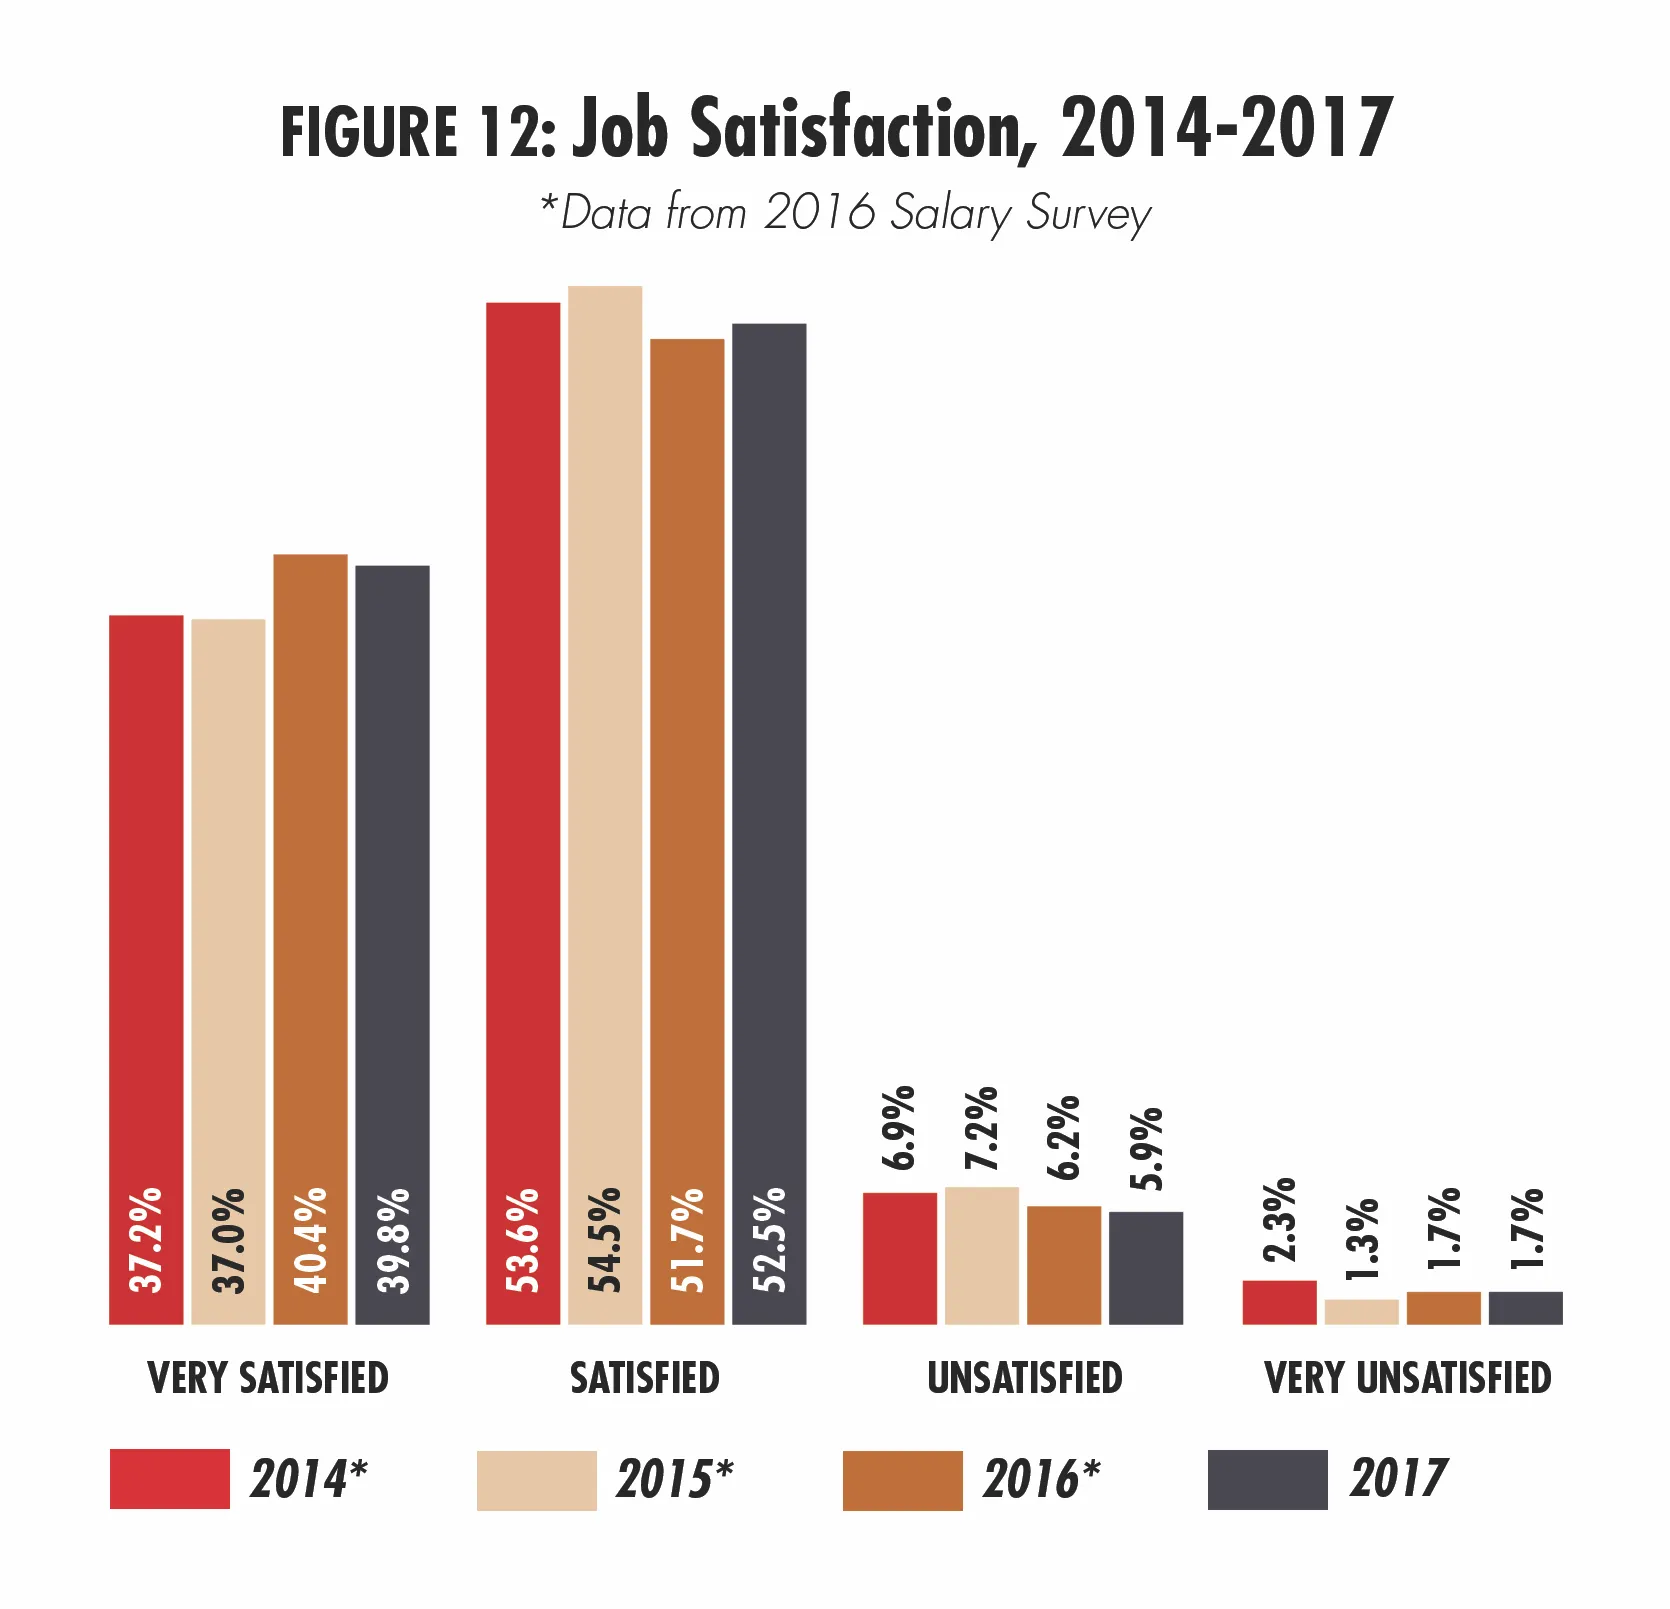
Finally, let's take a moment to appreciate how happy most of you are with your work. As has been the case in every year we've reported on the salary survey, the vast majority of survey respondents report that they are either satisfied (52.5 percent) or very satisfied (39.8 percent) with their work. In 2017, only 5.9 percent said they were unsatisfied, and 1.7 percent were very unsatisfied. (See Figure 12.)
Survey Methodology
This report is based on a survey conducted for Recreation Management by Signet Research Inc., an independent research company. An e-mail was broadcast and respondents were invited to participate. From the launch of the survey on Feb. 7, 2017, to the closing of the survey on Feb. 27, 2017, 1,743 returns were received. The findings of this survey may be accepted as accurate, at a 95 percent confidence level, within a sampling tolerance of approximately +/- 2.3 percent.
