


A Look at Trends in Parks & Recreation
Parks and recreation districts and departments have long struggled with funding and budgets, with staffing and outreach, and with equipment and facility maintenance and management. But despite the challenges, the professionals employed in this discipline are overwhelmingly satisfied with their work, and see a positive future for the places and programs they provide.
For many Americans, parks and recreation form a foundation on which community and healthy living are built. Just take a quick scan through the National Recreation and Park Association's regular "Park Pulse) surveys, and you'll see Americans turn to parks for everything from curing their winter blues and attending events to engaging kids with nature and boosting activity levels at all ages. The NRPA's "Americans' Engagement With Parks Survey" showed a majority of Americans believe parks and recreation are important services, and that they are more likely to vote for local politicians who make parks and recreation a priority.
And the benefits aren't just based on the NRPA's three pillars—Conservation, Health and Wellness, and Social Equity. A recent report from the association showed that local parks generated more than $154 billion in economic activity and supported more than 1.1 million jobs in 2015 from operations and capital spending alone.
In this section, we take a look at the latest trends among our parks and recreation respondents. The largest cohort covered in the survey, respondents from these types of organizations made up 40.6 percent of the survey population.
As is the case with the general survey population, the largest percentage of parks respondents (31.3 percent) are from the Midwest. Nearly one-quarter (24.1 percent) are from the West. The South Atlantic is home to 17.6 percent of parks respondents, while 16.5 percent are from the Northeast. The smallest number of parks respondents are from the South Central region, which is home to 10.5 percent. No parks respondents are located outside of the United States.
Parks respondents in 2018 are much more likely than non-parks respondents to be from suburban communities. Some 50.2 percent of parks respondents reported from the suburbs, compared with 38.8 percent of non-parks respondents. Parks respondents are slightly more likely to be from urban areas, with 21.6 percent calling urban communities home, compared with 20.4 percent of non-parks respondents. They are much less likely to be from rural communities. While 40.8 percent of non-parks respondents call rural areas home, just 28.2 percent of parks respondents are from rural communities.
Given that they are more likely to be from suburban and urban communities, it comes as no surprise that parks respondents serve a larger population than most other respondents. On average, parks respondents said they reach a population of 94,710. Parks respondents were more likely than non-parks respondents to report that they serve a population of at least 100,000 people, with 21.7 percent of parks reporting that they reach a population of at least 100,000. This compares with 15.2 percent of non-parks respondents. Conversely, while 33.4 percent of parks respondents said they reach a population of 20,000 or less, for non-parks respondents, that number jumps to 58.3 percent.
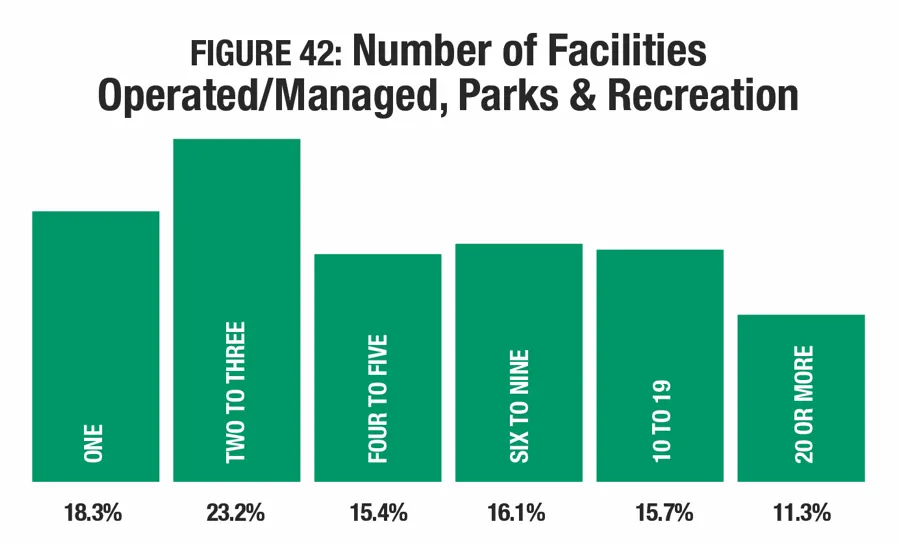
On average, parks respondents said they manage 9.9 facilities, down from 11.1 in 2017. Nearly three in 10 (27 percent) parks respondents said they manage 10 or more facilities. (See Figure 42.) This compares with just 10.2 percent of non-parks respondents. Conversely, parks respondents are far less likely than non-parks respondents to manage just a single facility. While 18.3 percent of parks respondents manage just one facility, some 47.7 percent of non-parks respondents said they have just one facility to manage.
Parks respondents are more likely than non-parks respondents to reach either an all-ages audience or an audience of children ages 4 to 12. While 54.9 percent of parks respondents said they primarily reach all ages, just 35.2 percent of non-parks respondents reach an all-ages audience. And, while 26 percent of parks respondents said that their primary audience is children ages 4 to 12, just 11.6 percent of non-parks respondents primarily reach this age group. Other audiences served by parks include: adults (13 percent of parks respondents said they primarily reach adults), teens (3.3 percent), seniors (2.5 percent), and college students (0.3 percent). No parks respondents said they primarily reach infants and toddlers.
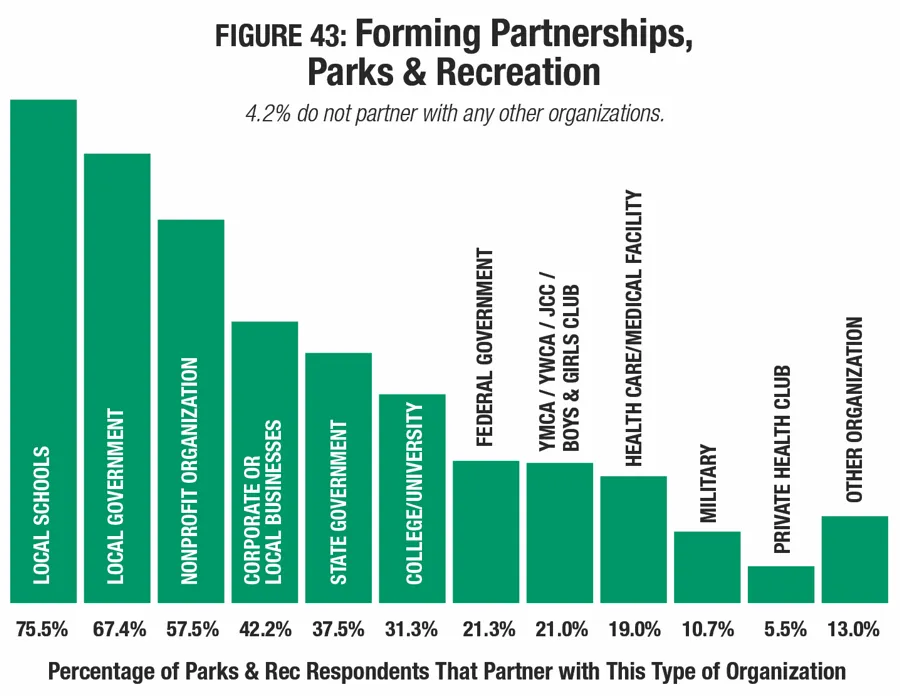
A majority of parks respondents (95.8 percent) said that they form partnerships with outside organizations, up from 94.7 percent in 2017. This compares with 80.3 percent of non-parks respondents. The most common partners for parks are: local schools (75.5 percent of parks respondents partner with them); local government (67.4 percent); nonprofit organizations (57.5 percent); corporate and local businesses (42.2 percent); and state government (37.5 percent). (See Figure 43.)
Revenues & Expenditures
Revenues for parks respondents continue to see growing stability this year, with 46.7 percent reporting that their revenues did not change from 2016 to 2017, up from 44.3 percent who saw no change from 2015 to 2016. That said, the number who reported a decrease in revenues grew from 7.9 percent (2015 to 2016) to 9.1 percent (2016 to 2017), and the number reporting an increase fell from 47.8 percent (2015 to 2016) to 44.2 percent (2016 to 2017). (See Figure 44.)
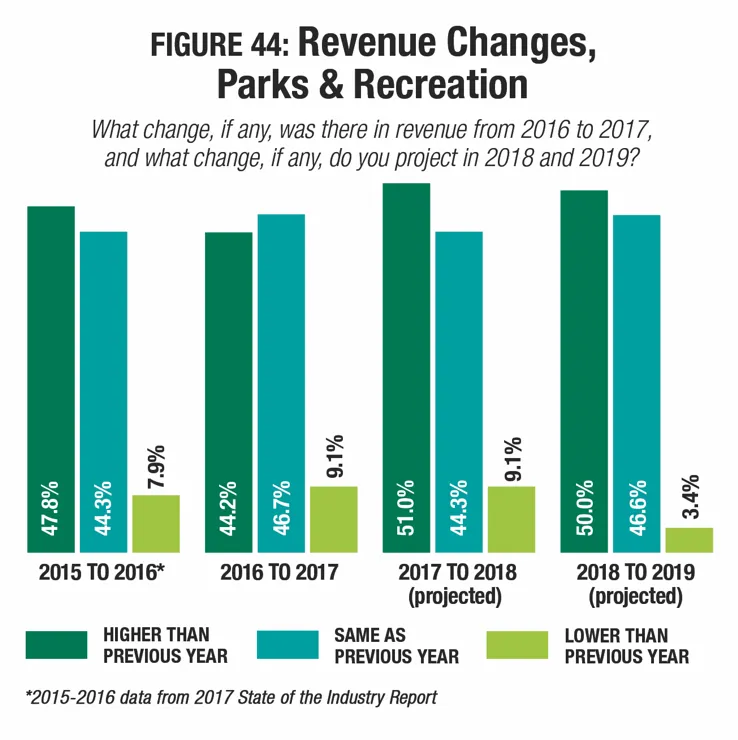
Looking forward, more parks respondents said they expect their revenues to increase, with more than half (51 percent) projecting an increase in 2018, and half (50 percent) projecting an increase in 2019. At the same time, the percentage who expect revenues to fall holds steady for 2018 at 9.1 percent, but falls to 3.4 percent for 2019.
Parks respondents reported a steeper decrease to their operating expenses from 2016 to 2017 than the average for all respondents, but looking forward, they expect revenues to increase at a faster pace. From 2016 to 2017, the average operating expense fell by 11.9 percent for all respondents, while parks respondents reported a drop of 16.8 percent, from an average of $2,428,000 in 2017 to $2,020,000 in 2018. Looking forward, parks respondents projected a 7.4 percent increase in their average operating expenses, from $2,020,000 in 2017 to $2,170,000 in 2019. This compares with a smaller 6.7 percent increase for all respondents.
On average, parks respondents report that they recover 43.9 percent of their operating costs via revenue, representing virtually no change from 2017, when 43.4 percent of costs were recovered, on average. Slightly more than one-third (34.8 percent) of parks respondents said they recover 30 percent or less of their operating costs via revenue. Another 20.2 percent said they recover between 31 percent and 50 percent of their operating costs. Some 17.6 percent earn back 51 percent to 70 percent of their costs via revenue. And 18.1 percent of parks respondents earn back at least 71 percent of their operating costs via revenue.
Respondents from parks were slightly more likely than non-parks respondents to report that they have taken action to reduce their operating expenses. Some 80.9 percent of parks respondents said they had done so, compared with 80.2 percent of non-parks respondents. The most common actions parks respondents have taken to reduce expenses include: increasing fees (51 percent of parks had done so, up from 49.4 percent in 2017); improving energy efficiency (48.9 percent); putting construction or renovation plans on hold (28.5 percent); reducing staff levels (25.8 percent); and reducing hours of operation (18.3 percent).
Park Facilities
The number of parks respondents who reported increasing numbers of people using their facilities fell slightly, with 61.4 percent reporting an increase from 2015 to 2016, and 56.4 percent reporting an increase from 2016 to 2017. (See Figure 45.) At the same time, the percentage of parks respondents who saw the number of people using their facilities decrease grew from 5 percent reporting a decrease in 2016 to 6.2 percent reporting a decrease in 2017.
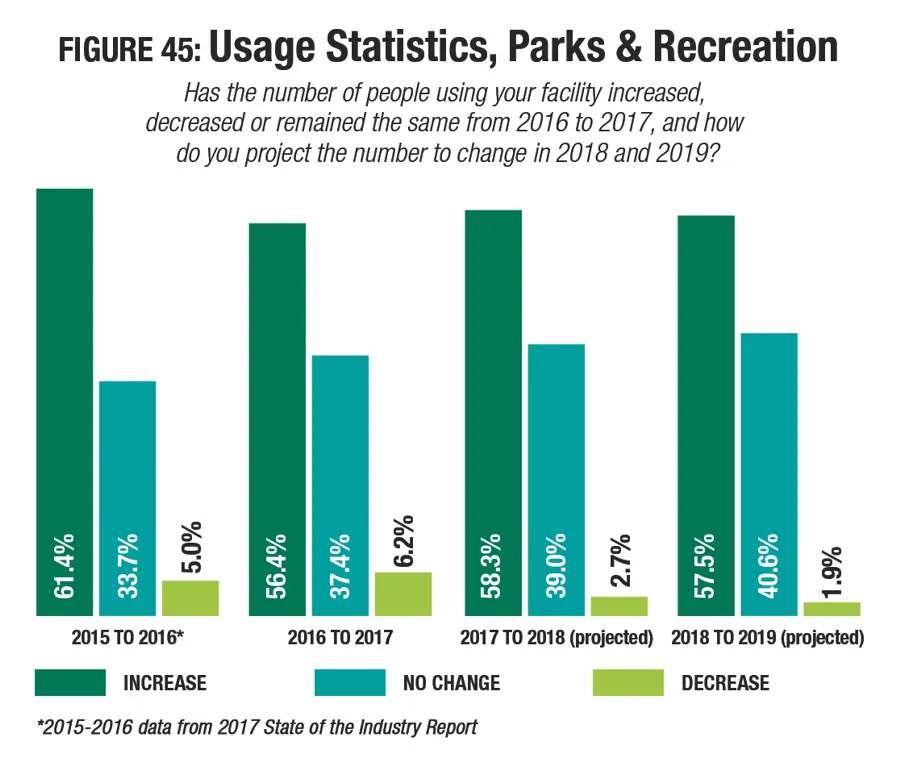
Looking forward, the percentage of parks respondents who expect to see further increases in the number of people using their facilities holds relatively steady, with 58.3 percent projecting an increase in 2018, and 57.5 percent projecting an increase in 2019. At the same time, the number of parks respondents expecting to see usage decrease fell to 2.7 percent projecting a decrease for 2018 and 1.9 percent for 2019.
The number of parks respondents who have plans for construction has been gradually increasing over the past several years. In 2015, 72.6 percent of parks respondents had plans for construction, and by 2018's survey, that number had grown to 76.6 percent. More than one-third of parks respondents (33.9 percent) said they are planning new construction. Slightly fewer (32.6 percent) are planning additions at their existing facilities, and nearly six in 10 (57.7 percent) said they are planning renovations. (See Figure 46.)
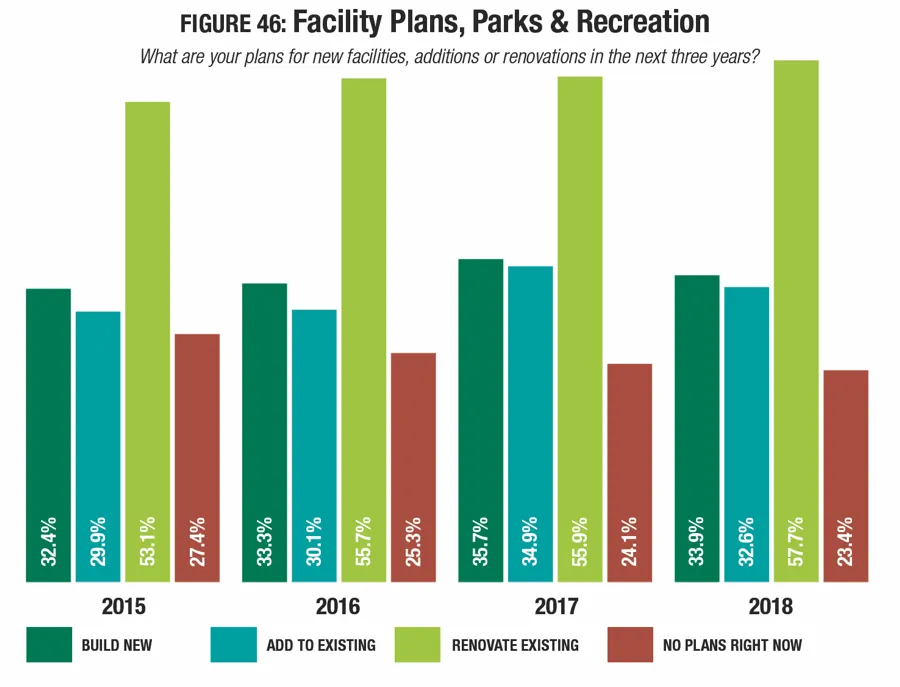
Parks respondents are much more likely than non-parks respondents to be planning construction. While 76.6 percent of parks respondents in 2018 have plans for construction over the next few years, only 64.7 percent of non-parks respondents have such plans.
Parks respondents reported a sharper-than-average decrease to their construction budgets from 2017 to 2018. This year's respondents will spend 7 percent less than 2017's respondents, with the average construction cost falling from $4,689,000 to $4,360,000. This compares with a 0.2 percent decrease for all respondents. In 2018, parks respondents plan to spend 1.6 percent more than the average for all respondents.
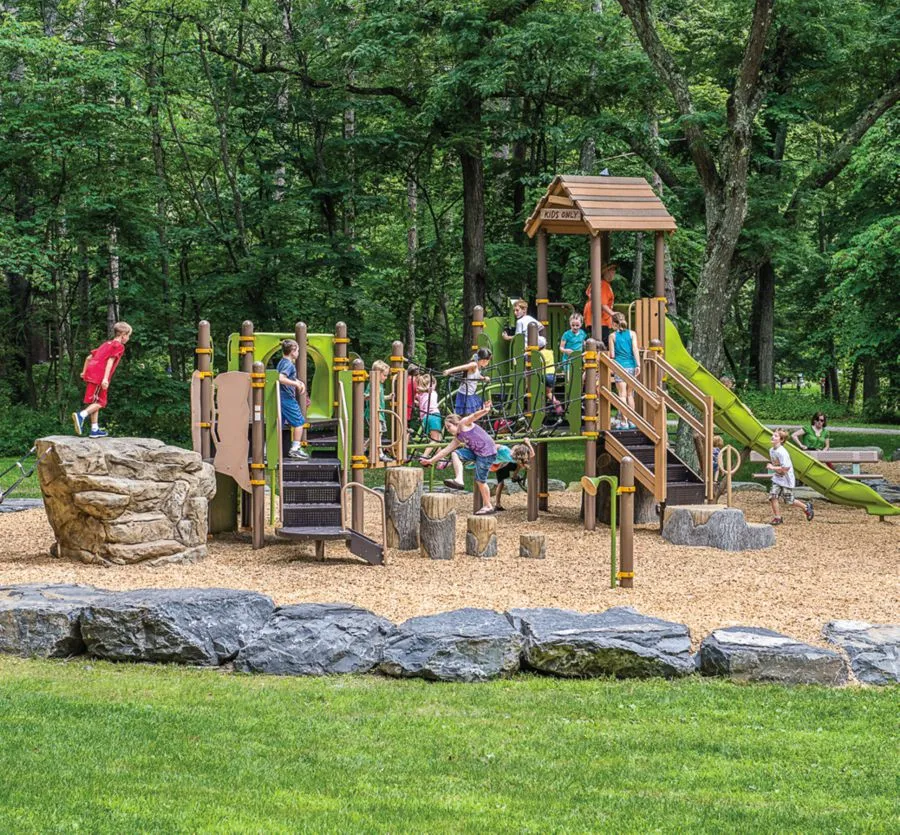
There was little change to the features most commonly found among park respondents' facilities from 2017 to 2018, with some features becoming more or less prevalent, but all of the most common features remaining the most common. The 10 most common features found among park respondents' facilities include: playgrounds, park shelters such as gazebos and picnic shelters, park restroom structures, bleachers and seating, outdoor sports courts for sports like basketball or tennis, open spaces such as gardens and natural areas, walking and hiking trails, natural turf sports fields, concessions, and classrooms and meeting rooms.
Parks respondents are much more likely than non-parks respondents to report that they have plans to add more features at their facilities over the next three years. More than half (56.2 percent) of parks respondents said they will be adding features at their facilities (up from 51.8 percent in 2017), while 34.3 percent of non-parks respondents have such plans.
The most commonly planned additions for parks respondents include:
- Splash play areas (planned by 31.4 percent of parks respondents who will be adding features)
- Dog parks (20.8 percent)
- Fitness trails and outdoor fitness equipment (20.6 percent)
- Walking and hiking trails (17.8 percent)
- Synthetic turf sports fields (16.9 percent)
- Playgrounds (16.4 percent)
- Disc golf courses (15.6 percent)
- Park shelters (15.3 percent)
- Park restroom structures (13.9 percent)
- Bike trails (13.9 percent)
Features that are planned by more respondents in 2018 than in 2017 include: splash play areas (up from 29.2 percent); dog parks (up from 17 percent); walking and hiking trails (up from 17.6 percent); and disc golf courses (up from 13.8 percent). Synthetic turf sports fields and bike trails did not appear in the top 10 planned features in 2017. They replace Wi-Fi services and fitness centers.
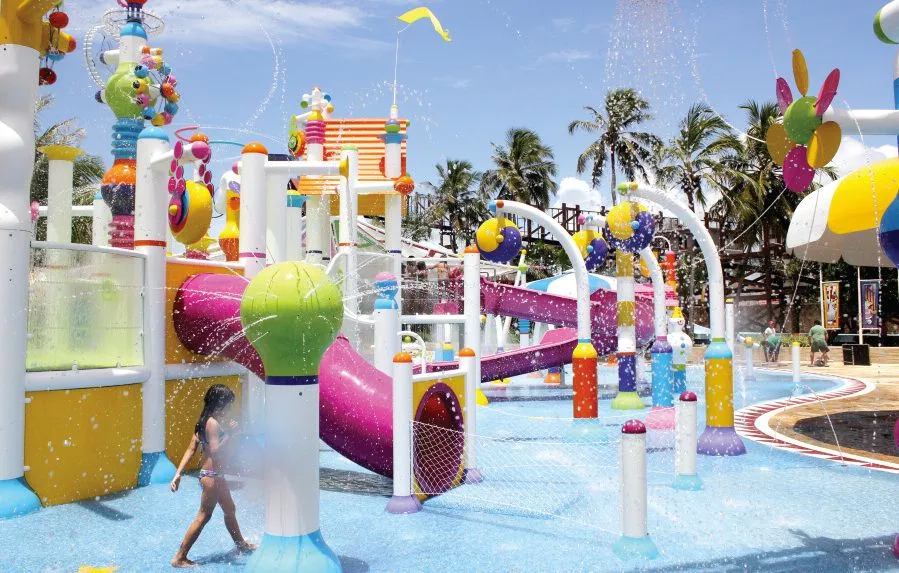
Keep On Splashin'
Splash play areas continue to hold onto the No. 1 spot on the list of most commonly planned features for park respondents' facilities. This year, that number increased from 29.2 percent in 2017 to 31.4 percent in 2018.
Splash play has come a long way since its introduction, with more aesthetic choices available, as well as more ways of conserving resources. Continue to keep an eye on splash play to see how it will further evolve as it moves from parks wish lists to a must-have amenity.
Programming
Parks respondents were more likely than non-parks respondents to report that they provide programming of some kind at their facilities. While 95.3 percent of non-parks respondents provide programs, 99.5 percent of parks respondents do so.
The most common programs found in parks and recreation respondents' lineup include: holiday events and other special events (82 percent of parks respondents include them); youth sports teams (75.6 percent); day camps and summer camps (71 percent); adult sports teams (63.9 percent); programs for active older adults (63.1 percent); fitness programs (62.8 percent); arts and crafts (62.6 percent); educational programs (62 percent); mind-body balance programs like yoga and tai chi (60.9 percent), and festivals and concerts (56.6 percent).
There were increases in the number of parks respondents providing youth sports teams, day camps and summer camps, adult sports teams, programs for active older adults, fitness programs, mind-body balance programs, and festivals and concerts.
Parks respondents were far more likely than non-parks respondents to report that they plan to add more programming options at their facilities over the next three years. Some 39.6 percent of parks respondents said they have such plans (up from 38.4 percent in 2017), compared with 26.4 percent of non-parks respondents.
The most commonly planned program additions in 2018 for parks include:
- Environmental education programs (no change from 2017)
- Fitness programs (up from No. 3)
- Teen programming (down from No. 2)
- Educational programs (up from No. 5)
- Mind-body balance programs such as yoga (down from No. 4)
- Day camps and summer camps (up from No. 8)
- Special needs programs (did not appear in 2017)
- Adult sports teams (did not appear in 2017)
- Individual sports activities like running clubs (did not appear in 2017)
- Sport-specific training like tennis or golf lessons (did not appear in 2017)

Gone to the Dogs
Dog parks moved into the No. 2 position on the list of most commonly planned features for park respondents' facilities. Dog parks can be a simple addition to any community, and provide a great outlet for people and their pets to socialize.
Some of the elements you should consider if you're planning to add a dog park include shade and seating for humans, as well as fun park elements, water fountains and dog waste pickup stations for the dogs. Be sure your fencing creates a safe space to contain off-leash pooches, and consider creating separate areas for large and small dogs.