A dozen years ago, in 2007, we launched the State of the Industry Report, publishing our first round-up of readers' responses to an extensive survey in the June issue of Recreation Management. We followed up annually, and over the course of 11 years' worth of surveys, have amassed a great deal of data from which to draw conclusions about where the industry has been—and where it is going.
Within the field of parks and recreation, sports and fitness facility management, there are myriad segments, any of which could bear further and deeper investigation. The aquatics industry, in particular, with its complex operations, unique costs and challenging staffing requirements, presents a fertile field for further study.
In 2018, we introduced more specific research into the aquatics industry, expanding on the information already provided in the State of the Industry Report. That information was published in various issues throughout the year.
This year, we've chosen to aggregate the data into a single report, which you now hold in your hands.
Welcome to our Aquatic Trends Report. In these pages, we expand on the information covered in our annual State of the Industry Report to discuss more specific trends within the aquatics industry, from staffing challenges (a good lifeguard can be hard to find) to equipment trends and more. This report does not replace the information covered in the State of the Industry Report. The June issue will still include aquatics information, including construction trends and more. But here, you'll find more detail about systems used for keeping pool water safe and clear, trends in resource conservation, pool features, programming, water safety, awareness of legal requirements, such as the Americans With Disabilities Act guidelines, and more.
We begin with some basic information about the 919 survey respondents whose facilities included aquatics—which could include the basics (swimming pool and hot tub) or more complex operations (full-blown aquatic parks and waterparks with rides, lazy rivers and more).
Survey Methodology
This report is based on a survey conducted for Recreation Management by Signet Research Inc., an independent research company. An e-mail was broadcast and respondents were invited to participate. From the launch of the survey on Oct. 2, 2018, to the closing of the survey on Oct. 30, 2018, 919 returns were received from respondents with aquatic facilities (out of 1,600 total returns). The findings of this survey may be accepted as accurate, at a 95 percent confidence level, within a sampling tolerance of approximately +/- 3.2 percent.
All regions of the United States were well represented in the survey, with the greatest number hailing from the Midwest. Nearly three in 10 (28.5 percent) respondents said they were from Illinois, Indiana, Iowa, Kansas, Michigan, Minnesota, Missouri, Nebraska, North Dakota, Ohio, South Dakota or Wisconsin. (See Figure 1.)
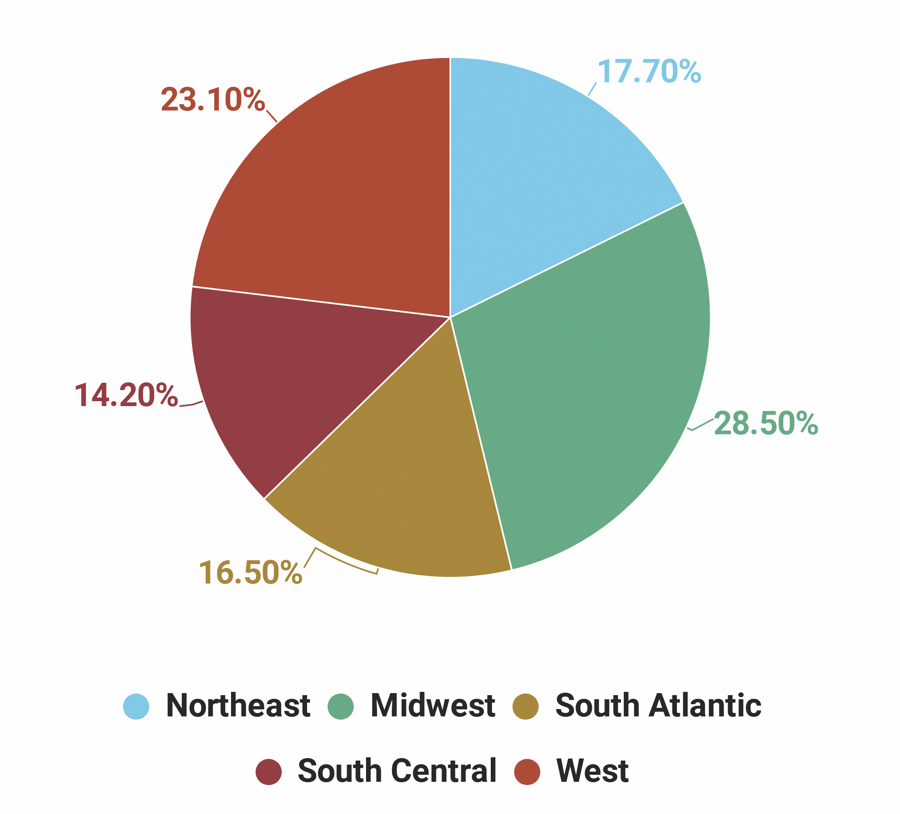
The second largest region was the West, with 23.1 percent. This includes Alaska, Arizona, California, Colorado, Hawaii, Idaho, Montana, Nevada, New Mexico, Oregon, Utah, Washington and Wyoming.
The Northeast was home to 17.7 percent of survey respondents. This includes Connecticut, Maine, Massachusetts, New Hampshire, New Jersey, New York, Pennsylvania, Rhode Island and Vermont.
Some 16.5 percent of respondents said they were from the South Atlantic states, including Delaware, Florida, Georgia, Maryland, North Carolina, South Carolina, Virginia, Washington, D.C., and West Virginia.
Finally, the South Central region was represented by 14.2 percent of respondents. This region includes Alabama, Arkansas, Kentucky, Louisiana, Mississippi, Oklahoma, Tennessee and Texas.
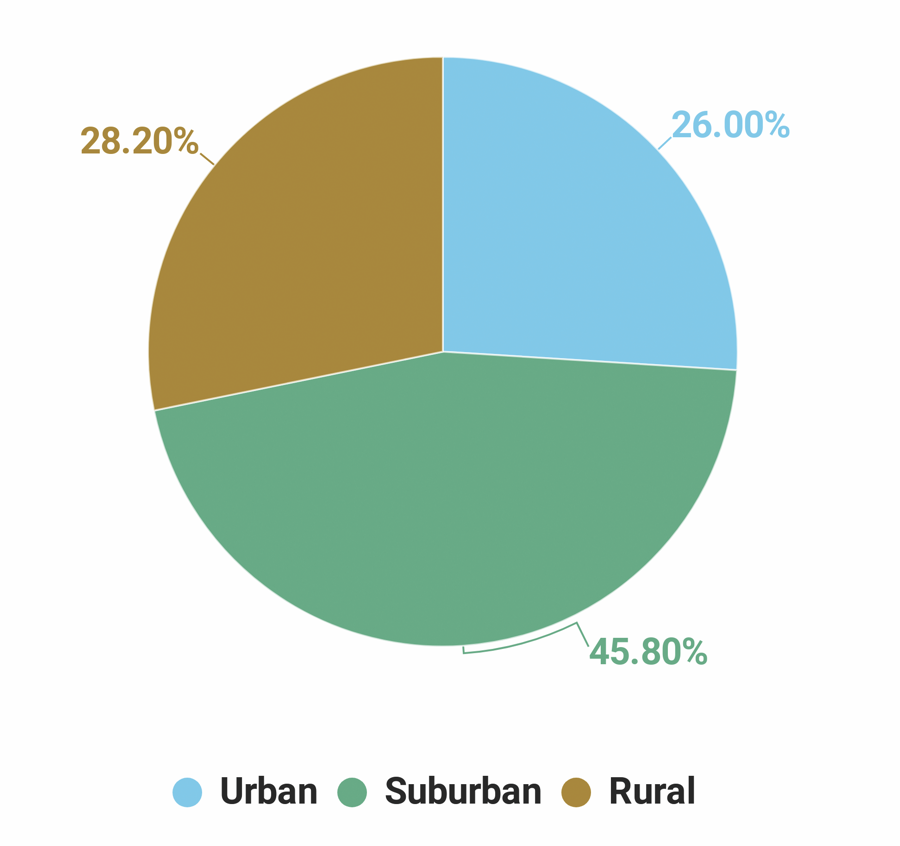
We also asked respondents to indicate the type of community they serve. Nearly half (45.8 percent) said they represented suburban communities. Smaller numbers were from rural areas (28.2 percent) and urban communities (26 percent). (See Figure 2.)
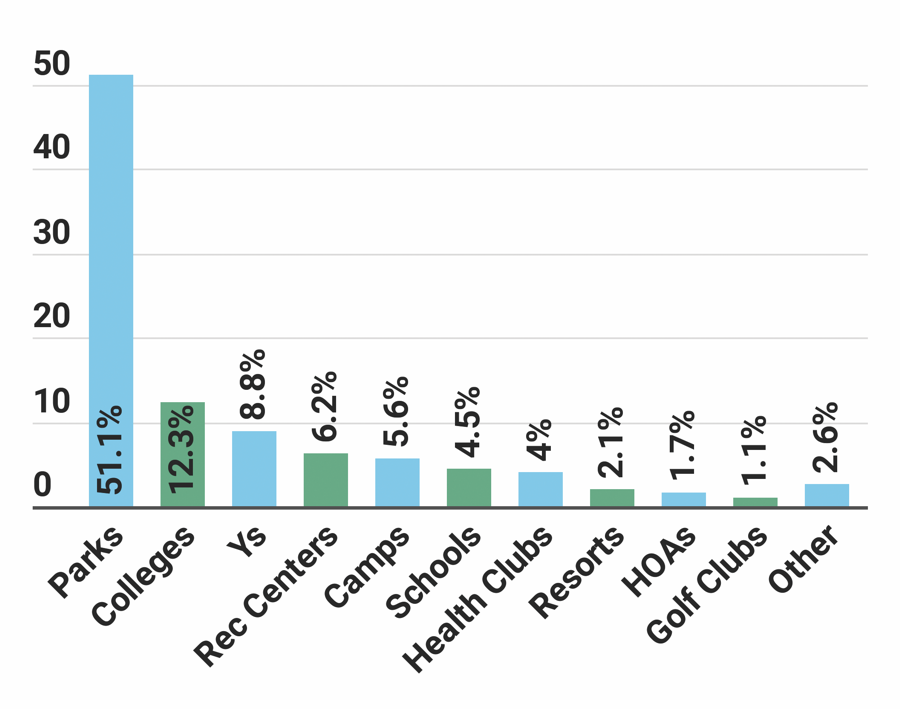
When it comes to the type of organization respondents work for, parks and recreation departments and districts were dominant, with more than half (51.1 percent) of respondents indicating they work for this type of organization. They were followed by: colleges and universities (12.3 percent); YMCAs, YWCAs, JCCs and Boys & Girls Clubs (8.8 percent); community or private recreation and sports centers (6.2 percent); campgrounds, RV parks and private or youth camps (5.6 percent); schools and school districts (4.5 percent); sports, health and fitness clubs, and medical fitness facilities (4 percent); resorts and resort hotels (2.1 percent); homeowners' associations (1.7 percent); and golf or country clubs (1.1 percent). Another 2.6 percent were from other types of organizations, including churches and military installations, among others. (See Figure 3.)
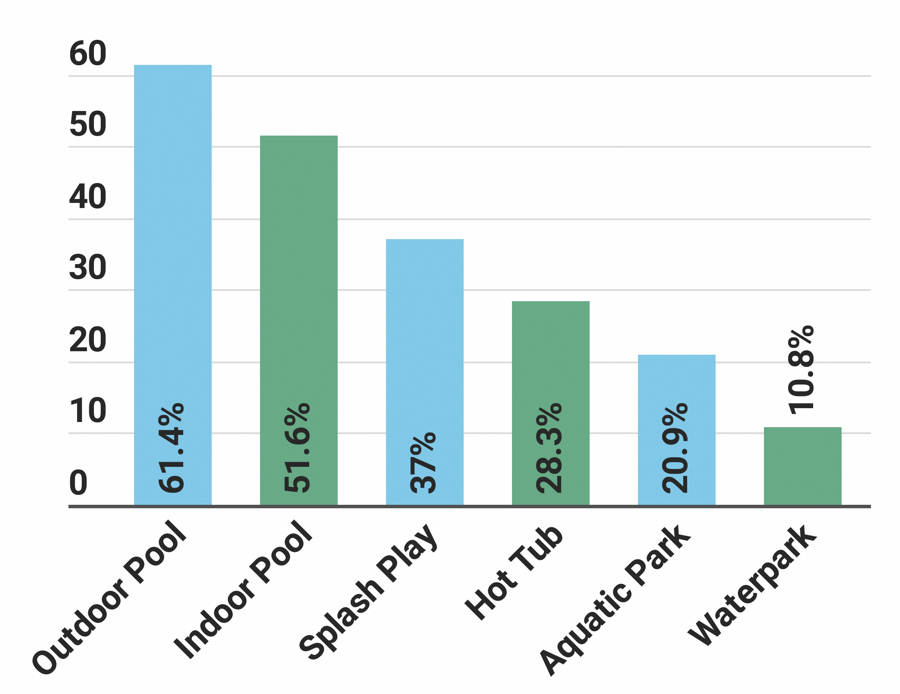
Different types of aquatic facilities were well represented in the report, with the predominant type being outdoor and indoor swimming pools. Some 61.4 percent of respondents said they have at least one outdoor swimming pool. More than half (51.6 percent) have at least one indoor swimming pool. Splash play areas were popular, with 37 percent of respondents indicating they had at least one. Some 28.3 percent had at least one hot tub, spa or whirlpool. More than one-fifth (20.9 percent) said they had at least one aquatic park (with a focus primarily on swimming pools and other aquatic activities). And 10.8 percent said they had at least one waterpark (with a focus primarily on rides and waterslides). (See Figure 4.)
Outdoor swimming pools were most commonly found among respondents from camp facilities, where 84.6 percent said they had at least one outdoor pool. They were followed by parks respondents, 72.6 percent of whom had at least one outdoor pool.
Indoor pools were most common for respondents from schools (90.2 percent had at least one indoor pool), Ys (86.4 percent), and colleges and universities (84.1 percent).
Splash play areas and aquatic parks were most commonly found among park facilities, where 54 percent said they had at least one splash play area and 30.4 percent said they had at least one aquatic park.
Waterparks were also most common among parks, with 13.4 percent of these respondents indicating they had at least one. They were followed by camps, where 11.5 percent said they had at least one waterpark.
Hot tubs, spas and whirlpools were most commonly found among community center respondents, with 50.9 percent reporting they have a hot tub. They were followed by respondents from Ys, 49.4 percent of whom have at least one hot tub.
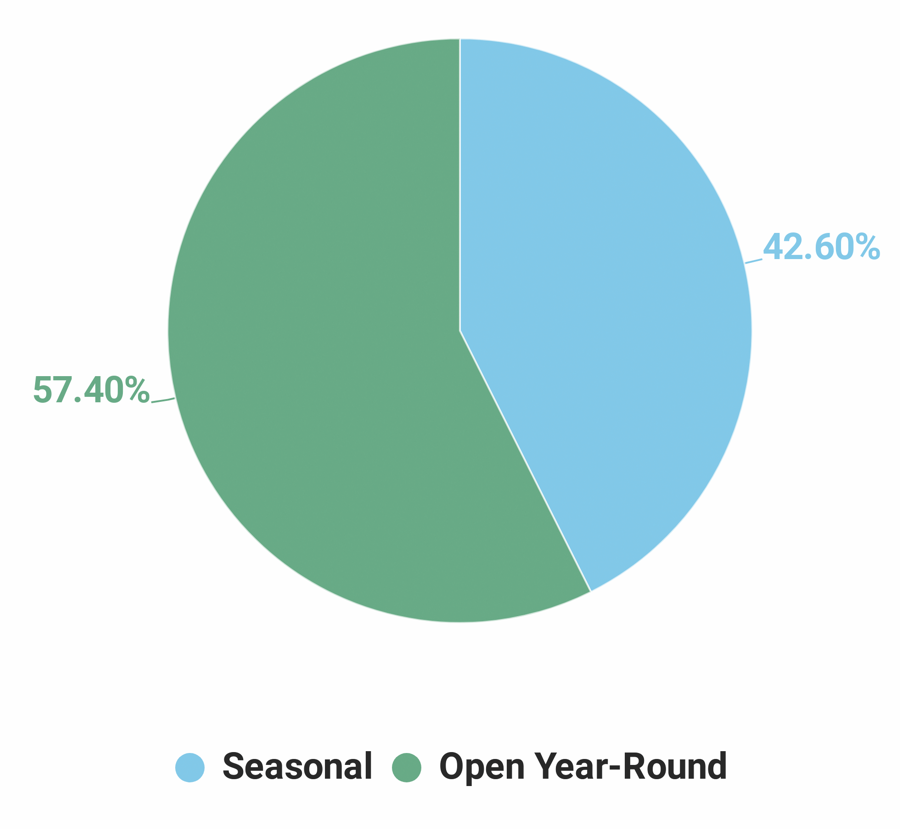
When it comes to season of operation, a majority of respondents (57.4 percent) said their aquatic facilities are open year-round. Some 42.6 percent said their operations are seasonal. (See Figure 5.)
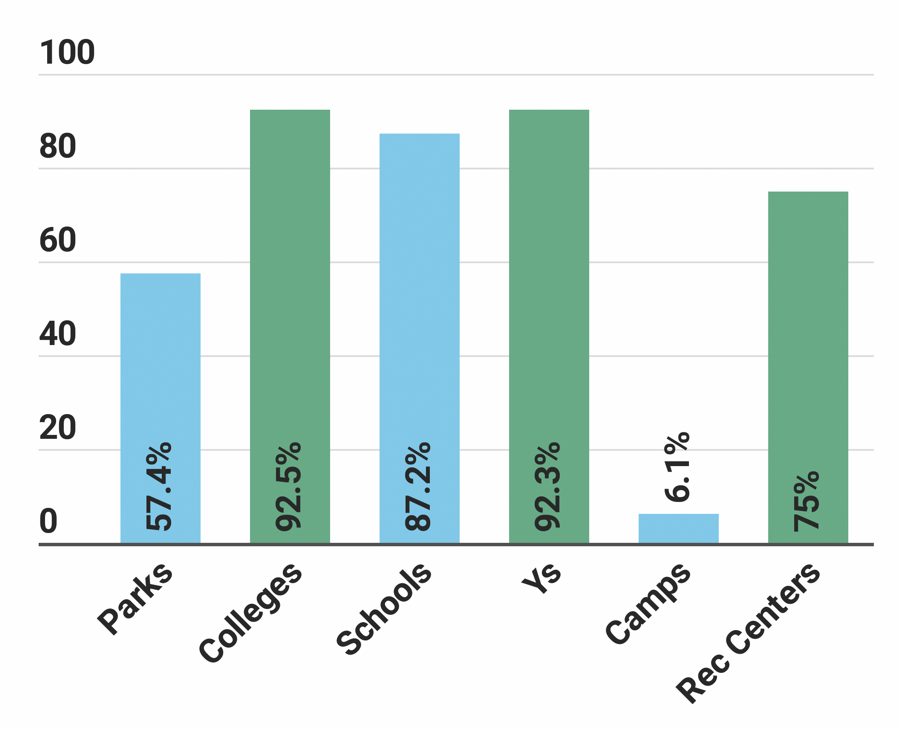
Respondents from colleges and Ys were the most likely to indicate that their aquatic facilities are open year-round. Some 92.5 percent of college respondents and 92.3 percent of Y respondents said they had year-round operations. They were followed by schools (87.2 percent) and community centers (75 percent). Well over half (57.4 percent) of parks respondents also said their aquatics were open year-round. (See Figure 6.)
Among respondents with seasonal operations, May was the most popular month for opening the season, and September the most likely month to close operations for the year. Some 26.4 percent of all respondents said their season begins in May, while 11.4 percent said their season starts in June. Nearly one-quarter (24.7 percent) said they close their seasons in September, while 15.3 percent see the season end in August.
Money-Wise
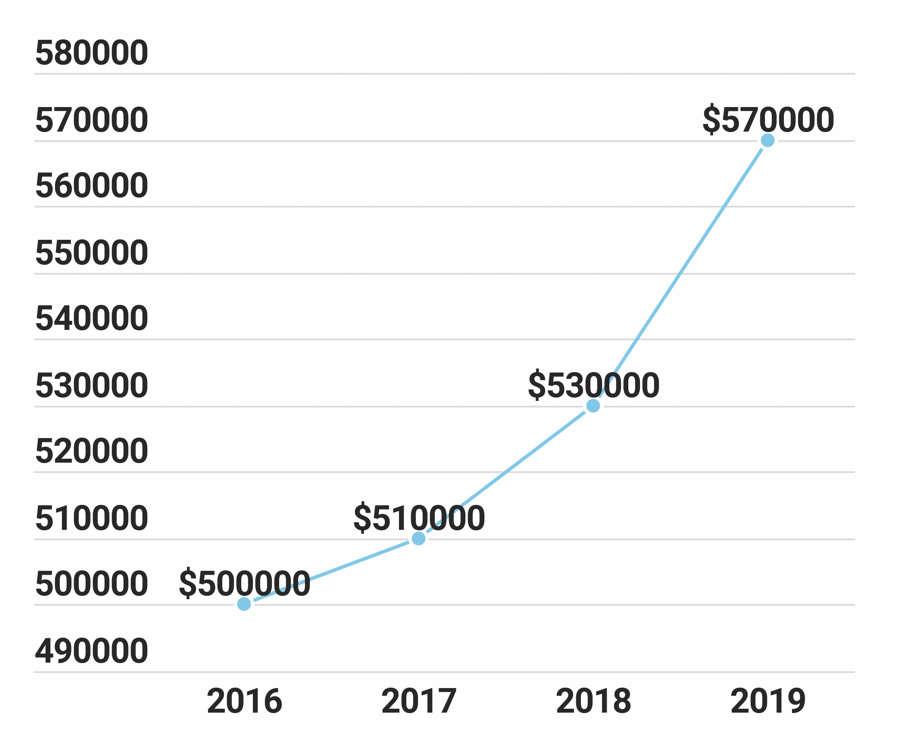
The average operating costs for aquatic facilities increased 2 percent from 2016 to 2017, from an average of $500,000 reported in the 2017 survey to $510,000 in the 2018 survey. Looking forward, respondents expect operating costs to increase another 11.8 percent between 2017 and 2019, from $510,000 to $570,000. (See Figure 7.)
Respondents from Ys and community centers had the highest average operating costs in 2017, both reporting that they spent $600,000 in that year. They were followed by parks ($570,000), colleges ($280,000), schools ($220,000) and camps ($200,000). (See Figure 8.)
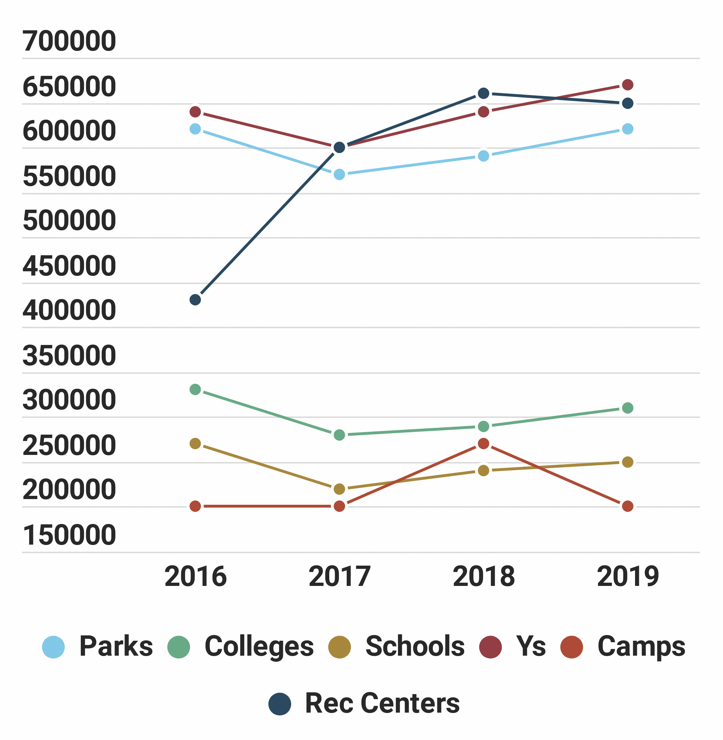
Only community center respondents reported an increase to their average operating expenses from 2016 to 2017, with a 39.5 percent increase from $430,000 to $600,000. Camps reported no change to their expenses in that time frame. All other facility types saw a decrease in average operating expenses from 2016 to 2017, with the greatest decrease reported by schools (dropping 18.5 percent) and colleges (down 15.2 percent).
Looking forward, the greatest increase to operating expenses from 2017 to 2019 is expected among respondents from schools, who expect their average cost to rise 13.6 percent, from $220,000 in 2017 to $250,000 in 2019. They were followed by Ys (reporting an 11.7 percent increase) and colleges (up 10.7 percent). Parks respondents are expecting operating costs to rise 8.8 percent, from $570,000 in 2017 to $620,000 in 2019, and community centers are expecting a similar increase, at 8.3 percent, from $600,000 to $650,000. Camp respondents reported that they expect no change to average operating costs in that time period.
Considered by region, respondents from the West consistently reported the highest average operating costs, while those in the Northeast reported the lowest costs. (See Figure 9.)
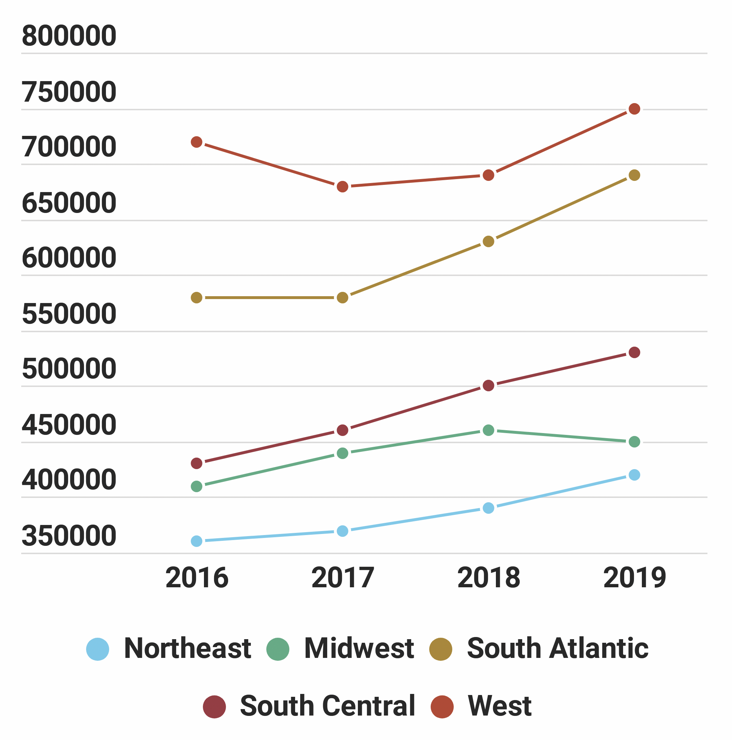
From 2016 to 2017, respondents in the Midwest reported the greatest increase in average operating expenditures, with a 7.3 percent jump from $410,000 to $440,000. They were followed by the South Central region, with a 7 percent increase. The only decrease was seen among respondents from the West, who saw their average operating expenses fall 5.6 percent from $720,000 in 2016 to $680,000 in 2017.
Looking forward, the greatest increase in average operating expenditures from 2017 to 2019 is projected by respondents from the South Atlantic states, who expect their costs to rise 19 percent, from $580,000 to $690,000. They were followed by the South Central region, with a 15.2 percent increase, and the Northeast, with a 13.5 percent increase. Respondents from the West projected their expenses to rise 10.3 percent from 2017 to 2019, and respondents from the Midwest reported the most modest increase, at 2.3 percent.
Systems & Resources
We asked respondents to indicate the various types of systems used to maintain water quality in their pools, as well as their use of secondary disinfection and their resource-conservation goals.
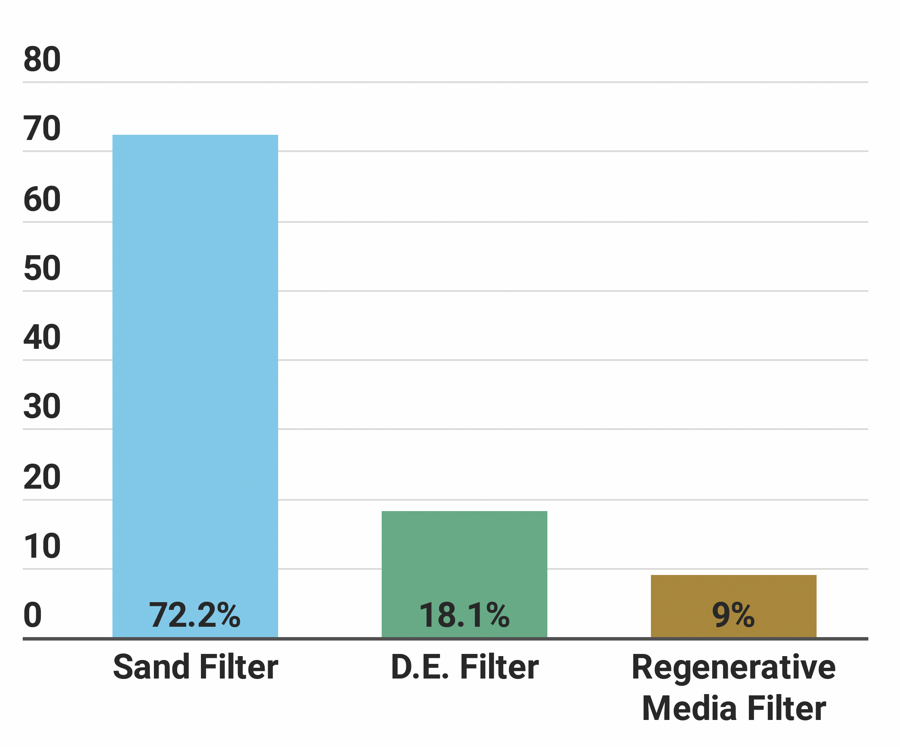
When it comes to pool filtration, sand filters are still dominant, with nearly three-quarters (72.2 percent) of respondents indicating they currently use sand filters. Another 18.1 percent use diatomaceous earth (D.E.) filters, and 9 percent are using regenerative media filters (RMFs). (See Figure 10.)
The vast majority of respondents (84.3 percent) said they use chlorination systems at their aquatic facilities, while 12.3 percent are using bromination systems. Tablet chlorinators are used by 36 percent of respondents, while 6.5 percent are using salt chlorine generators.
Looking forward, 14.4 percent of respondents said they had plans to add new systems or update existing systems at their aquatic facilities over the next three years. In regard to pool filtration, RMFs are the most commonly planned addition, with 23.5 percent of those respondents indicating they planned to add RMFs. They were followed by D.E. filters (18.9 percent) and sand filters (18.2 percent). In addition, 22.7 percent of those respondents said they plan to add salt chlorine generation, and 12.9 percent are planning to add tablet chlorinators.
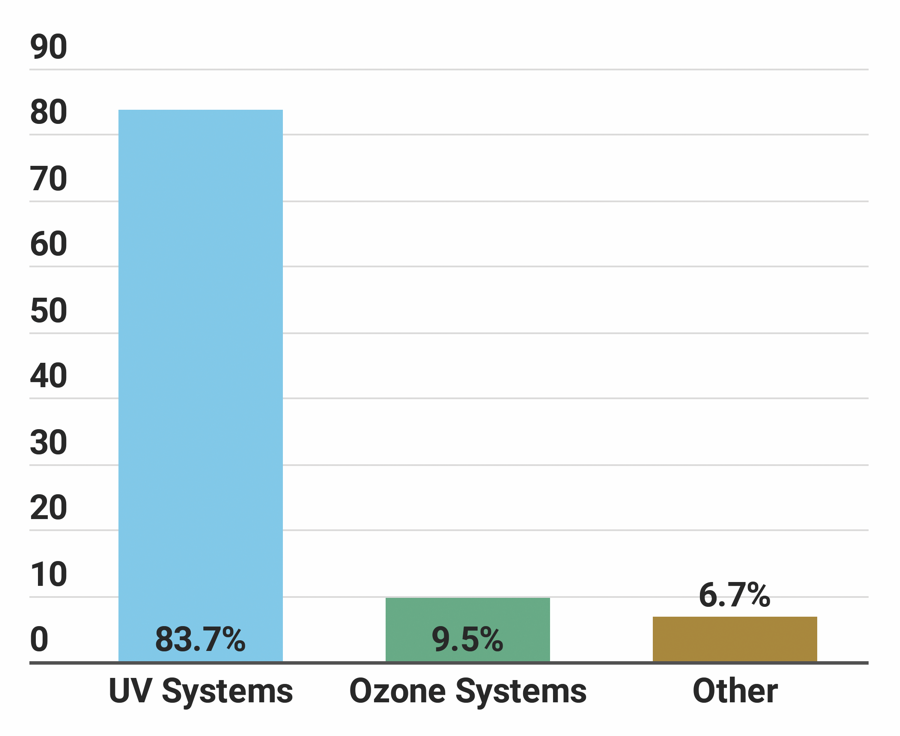
When it comes to secondary disinfection, 32 percent of respondents indicated that they currently use some form of secondary disinfection. The majority of those (83.7 percent) are using UV systems as their form of secondary disinfection, while 9.5 percent are using ozone systems. Another 6.7 percent said they use some other form of secondary disinfection. (See Figure 11.)
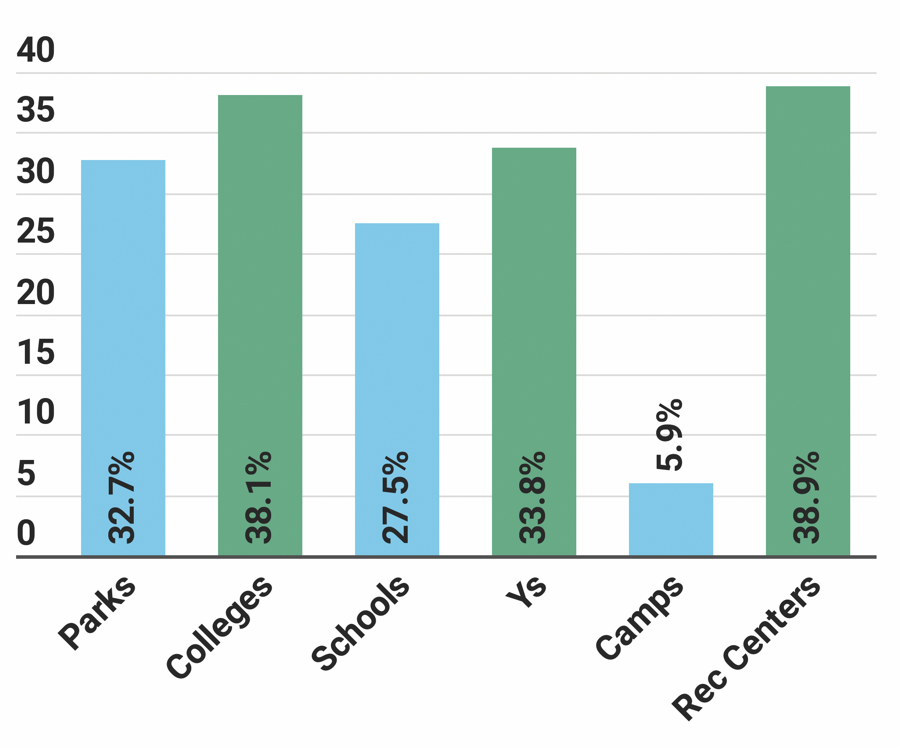
Respondents from community centers and colleges were the most likely to report that they are currently using some form of secondary disinfection. Some 38.9 percent of community center respondents and 38.1 percent of college respondents said they are using secondary disinfection. They were followed by Ys (33.8 percent), parks (32.7 percent) and schools (27.5 percent). Camp respondents were the least likely to indicate that they used secondary disinfection, with only 5.9 percent reporting that they do. (See Figure 12.)
Respondents whose facilities have higher average operating costs are more likely to report that they use secondary disinfection than those with lower costs. More than half (50.5 percent) of respondents with average costs of at least $500,000 said they use secondary disinfection. This compares with 35.2 percent of those whose costs fall in the range of $250,000 to $499,999, and 23.6 percent of those whose costs are less than $250,000 per year.
Looking forward, among respondents who plan to make additions at their pools in the next several years, 37.1 percent plan to add UV systems, and 18.2 percent plan to add ozone. Respondents from colleges and schools were the most likely to be planning to add UV. Some 56.3 percent of college respondents and 50 percent of schools with plans to make additions will be adding UV.
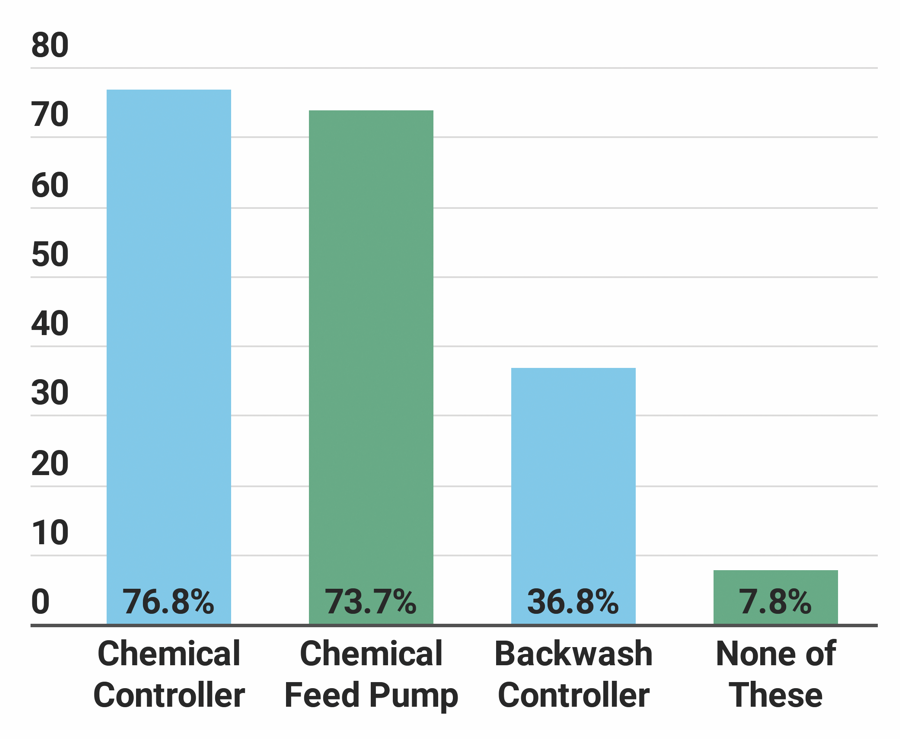
Pool automation systems were very common among survey respondents. Some 76.8 percent said they currently use chemical controllers, while 73.7 percent use a chemical feed pump. Another 36.8 percent said they currently use a backwash controller. (See Figure 13.)
When it comes to conservation of resources, a majority of respondents (71.3 percent) said they currently have strategies and tools in place to conserve energy, chemicals, water and more. More than half said they use strategies and tools to conserve energy (52.6 percent) and chemicals (51.6 percent). Another 44.8 percent said they aim to conserve water.
Respondents from recreation centers were the most likely to report that they currently aim to conserve energy, chemicals and water. Some 86.3 percent of these respondents said they have conservation strategies and tools in place. They were followed by Ys (76.6 percent), colleges (72 percent), parks (70.4 percent) and schools (70.3 percent). Camp respondents were the least likely to have conservation strategies and tools, with less than half (46.9 percent) indicating they do so.
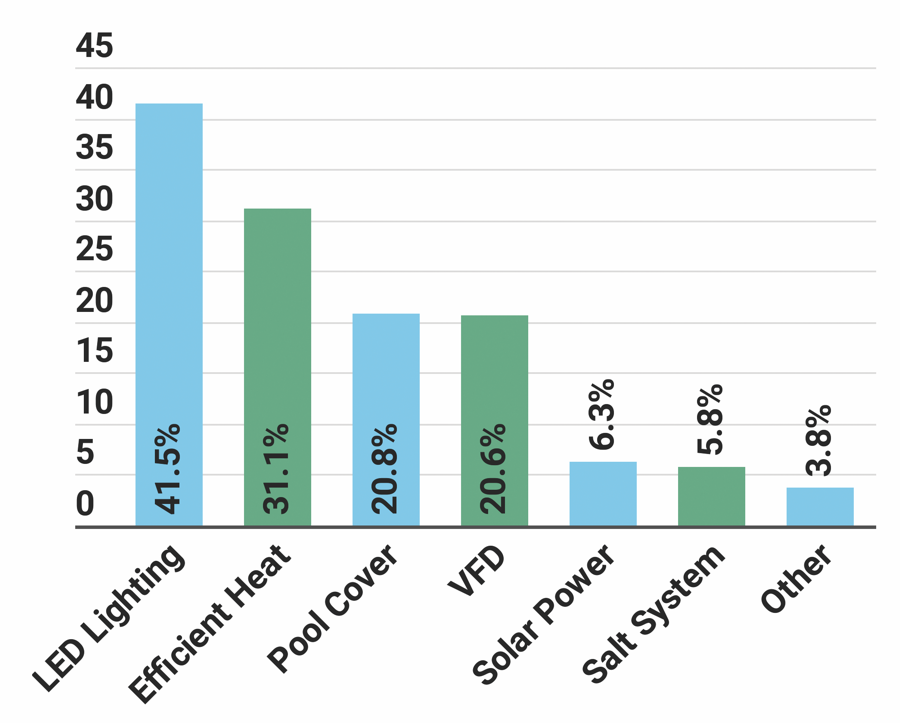
The most common tools used to conserve energy, chemicals and water at aquatic facilities included LED lighting (used by 41.5 percent of all respondents) and high-efficiency heaters (used by 31.1 percent). Another 20.8 percent rely on pool blankets or covers, and 20.6 percent use variable frequency drives, or VFDs. (See Figure 14.)
Outfitting the Aquatic Facility
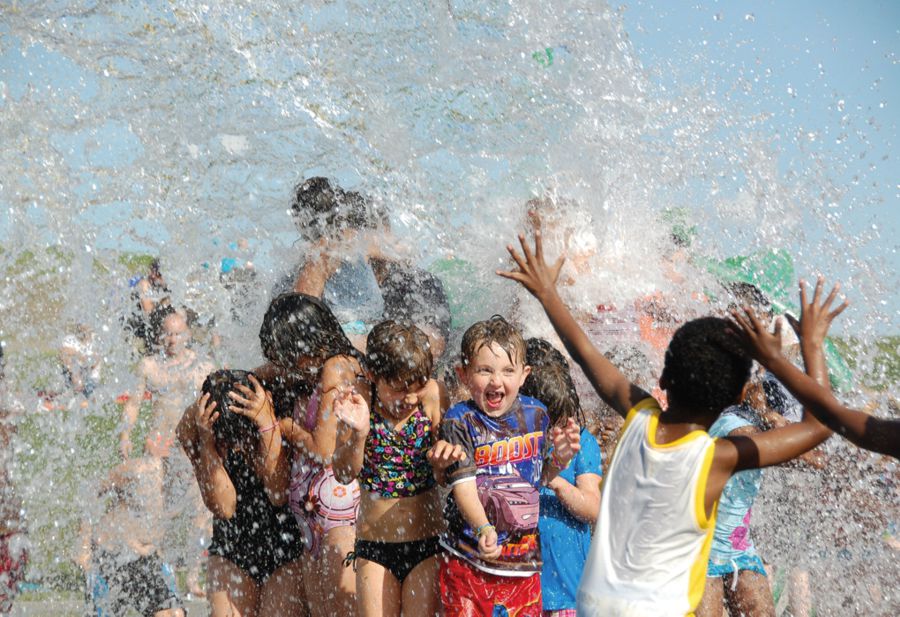
From slides and diving boards to surf machines and more, outfitting an aquatic facility provides more ways to attract patrons. There is a huge range of products you can rely on to make a simple swimming pool more stunning, and, of course, waterparks that aim to attract a regional audience have to stay on top of the latest trends and rides to keep them coming back for more. Other features help improve accessibility and wellness, or make it easier for pool staff to do their work, from lifeguarding to instructing classes.
Here are some of the most common types of features and their prevalence among respondents' facilities:
- Lane Lines: 76.3%
- Lifeguard Station: 69%
- Pool Lift or Other Accessibility Equipment: 64.4%
- Pool Exercise Equipment: 49.1%
- Diving Boards: 48.6%
- Starting Platforms: 43.3%
- Pool Slides: 42.4%
- Shade Structures: 40.6%
- Zero-Depth Entry: 38.3%
- Water Basketball Equipment: 29%
- Scoreboard: 23.1%
- Water Polo Equipment: 20.8%
- Pool Inflatables: 20.4%
- Water Volleyball Equipment: 18%
- Water Playground: 17.5%
- Teaching Platform: 15%
- Lazy River: 12.8%
- Diving Platforms: 12.2%
- Poolside Cabanas: 10.4%
- Poolside Climbing Wall: 8.1%
- Lily Pads/Water Walk: 7.6%
- Underwater Treadmill or Bike: 3.8%
- Wave Pool: 2.9%
- River Raft Ride: 2.3%
- Surf Machine: 1.2%
- Water Coaster: 0.7%
Certification in Pool Operations
The National Swimming Pool Foundation (NSPF) and the Association of Pool & Spa Professionals (APSP) offer training and certification for pool operators.
The NSPF's Certified Pool & Spa Operator (CPO) certification, for example, provides knowledge, techniques and skills necessary for pool and spa operations, while the APSP's Professional Pool and Spa Operator (PPSO) certification provides a course for commercial swimming pool operators, managers, engineers, service professionals, health officials and facility owners.
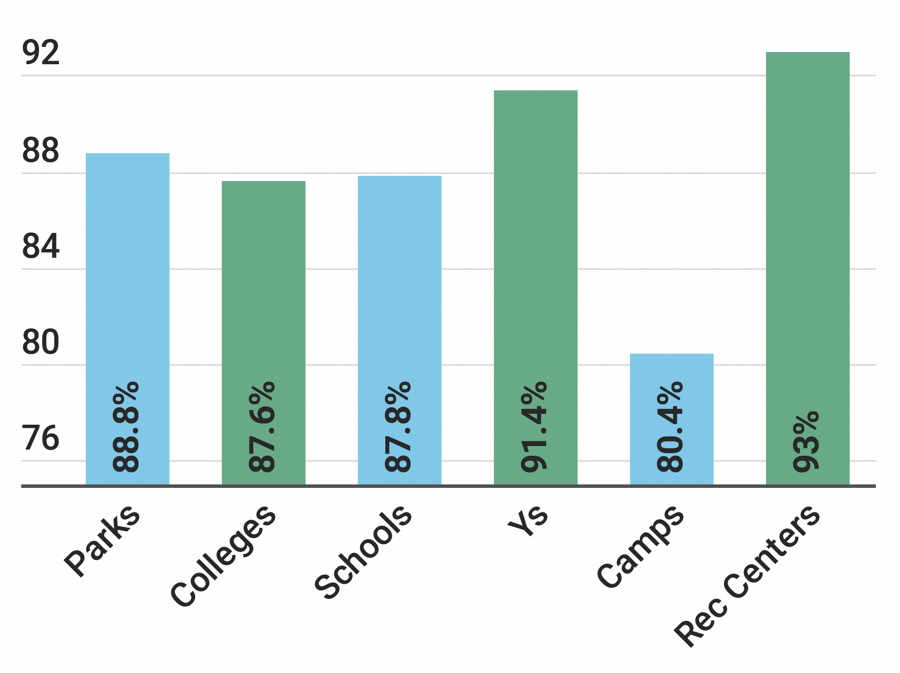
The majority (87.5 percent) of respondents said that either they or someone at their facility currently has this sort of certification. Respondents from rec centers were the most likely to be certified. Some 93 percent of rec center respondents said they or someone at their facility was certified in aquatic management or pool operations. They were followed by Ys (91.4 percent), parks (88.8 percent), schools (87.8 percent), colleges (87.6 percent), and camps (80.4 percent). (See Figure 15.)
Respondents from parks were the most likely to have many types of features. They were more likely than respondents from other types of facilities to include: pool slides, water coasters, river raft rides, poolside climbing walls, lily pads and water walks, wave pools, water playgrounds, zero-depth entry, lazy rivers, poolside cabanas, shade structures, surf machines and lifeguard stations.
Respondents from colleges were more likely than those from other types of facilities to include diving platforms, water polo equipment and water basketball equipment.
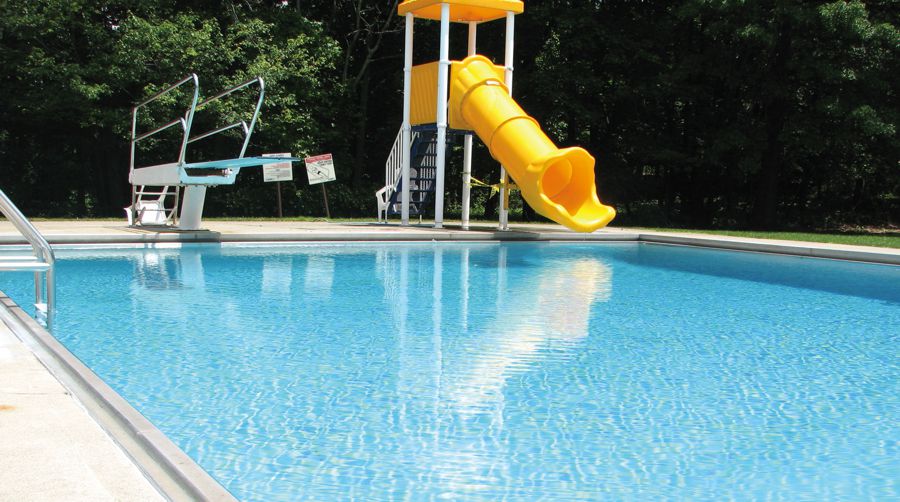
School respondents were more likely than those from other types of facilities to include diving boards, starting platforms and scoreboards.
Respondents from Ys were more likely than those from other types of facilities to include underwater treadmills and bikes, and pool lifts or other accessibility equipment.
Camp respondents were more likely than others to include pool inflatables and water volleyball equipment.
Finally, respondents from recreation centers were more likely than those from other types of facilities to include lane lines, pool exercise equipment and teaching platforms.
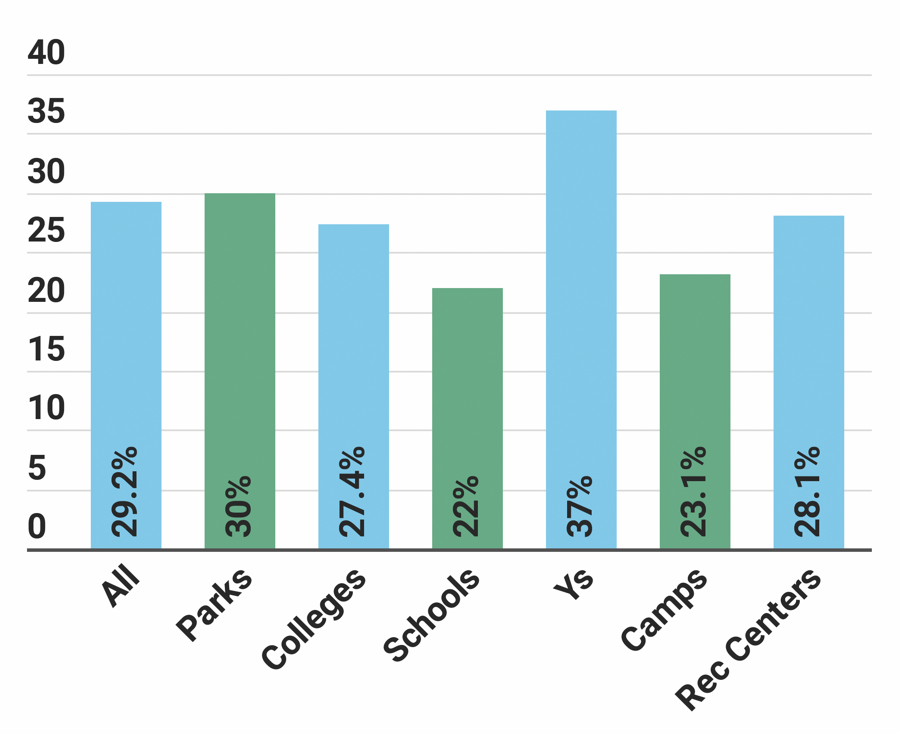
Nearly three out of 10 (29.2 percent) respondents said that they have plans to add features at their facilities within the next three years. Respondents from Ys were the most likely to have such plans. Some 37 percent of Y respondents said they would be adding features to their facilities. They were followed by parks (30 percent), recreation centers (28.1 percent) and colleges (27.4 percent). Respondents from camps and schools were the least likely to be planning additions at their facilities, though 23.1 percent and 22 percent, respectively, said they had such plans. (See Figure 16.)
The 10 most commonly planned additions at aquatic facilities in the next three years include:
- Shade structures (planned by 26.1 percent of those who will be making additions)
- Poolside climbing walls (23.9 percent)
- Pool exercise equipment (18.7 percent)
- Pool slides (17.9 percent)
- Pool inflatables (14.9 percent)
- Water playgrounds (14.9 percent)
- Poolside cabanas (13.8 percent)
- Underwater treadmills and bikes (13.1 percent)
- Zero-depth entry (12.3 percent)
- Water basketball equipment (11.1 percent)
Ys are the most likely to be planning to add many types of features. These respondents were more likely than those from other facility types to report that they have plans to add: pool slides, poolside climbing walls, diving platforms, diving boards, starting platforms, lane lines, pool exercise equipment, teaching platforms, water playgrounds, zero-depth entry, lazy rivers, lifeguard stations and scoreboards.
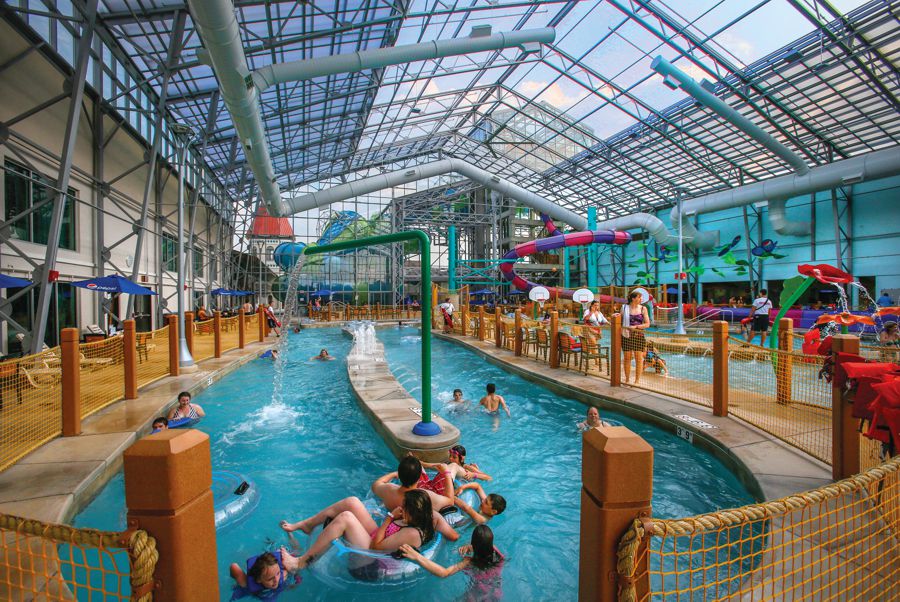
Interestingly, college respondents were more likely than those from other facilities to be planning to add water coasters, river raft rides, lily pads and water walks, wave pools and surf machines. This seems to indicate that some number of colleges are planning to expand their aquatics into the waterpark realm. These respondents were also more likely than those from other types of facilities to be planning to add water polo and water basketball equipment.
Park respondents were more likely than those from other types of facilities to be planning to add pool inflatables, shade structures and water volleyball equipment.
Camp respondents were the most likely to be planning to add pool lifts and other accessibility equipment, and rec center respondents were the most likely to be planning to add underwater treadmills and bikes.
Programming
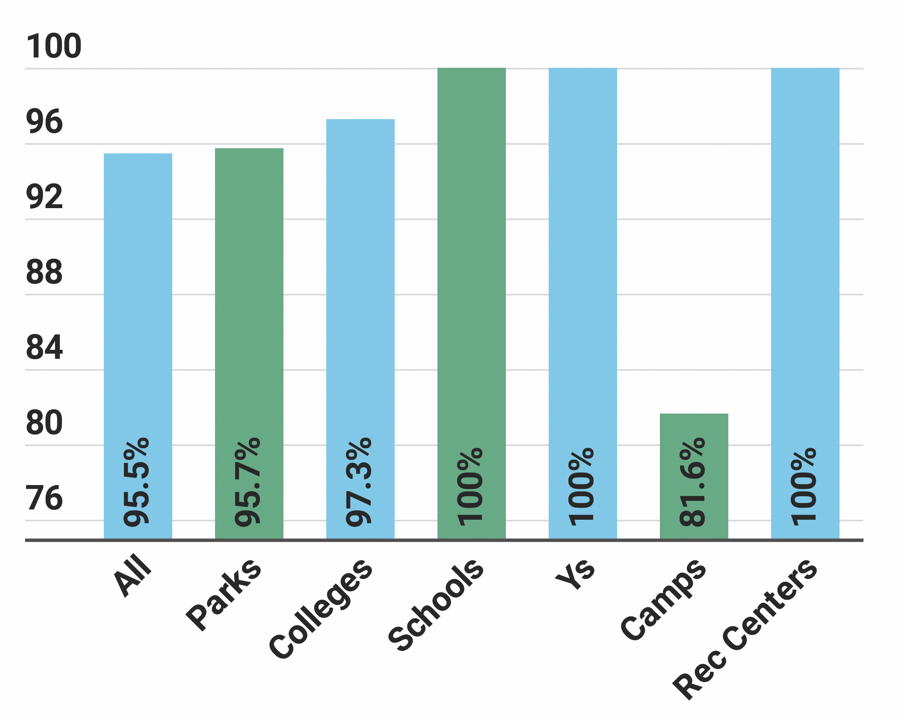
While you can build and outfit a pool and just allow patrons to come and swim and entertain themselves however they please (as long as it's safe), the vast majority (95.5 percent) of aquatic respondents said they provide some type of programming at their facilities. In fact, 100 percent of respondents from schools, Ys and recreation centers said they currently provide programming. Camp respondents were the least likely to provide programming, though a majority (81.6 percent) said they currently do. (See Figure 17.)
The following are the types of programs covered in the survey and their prevalence among respondents' offerings:
- Learn-to-Swim Programs (83.3%)
- Leisure Swim Time (75.3%)
- Lifeguard Training (74%)
- Lap Swim Time (73.2%)
- Aquatic Aerobics (66.4%)
- Birthday Parties (63.1%)
- Youth Swim Teams (57.4%)
- Water Safety Training (57.2%)
- Swim Meets & Other Competitions (48.5%)
- Aquatic Programs for Those With Physical Disabilities (36.7%)
- School Swim Teams (35.5%)
- Aquatic Programs for Those With Developmental Disabilities (30.9%)
- Dive-In Movies (28.5%)
- Water Walking (27.5%)
- Aqua-Yoga & Other Balance Programs (22.7%)
- Aquatic Therapy (20.7%)
- Adult Swim Teams (20.6%)
- Diving Programs & Teams (18.9%)
- Water Polo (16.5%)
- Doggie Dips (14.7%)
- Collegiate Swim Teams (9.3%)
Respondents from Ys were the most likely to offer most types of programming. They were more likely than those from other facility types to offer learn-to-swim programs, youth swim teams, programs for those with physical and developmental disabilities, aquatic aerobics, aqua-yoga and other balance programs, water walking, leisure swim time, lap swim time, aquatic therapy, water safety training, lifeguard training and birthday parties.
Respondents from schools were more likely than those from other facility types to provide adult swim teams, school swim teams, swim meets and competitions, and diving programs and teams.
Park respondents were more likely than those from other facility types to provide doggie dips and dive-in movies, and college respondents were the most likely to provide collegiate swim teams and water polo.
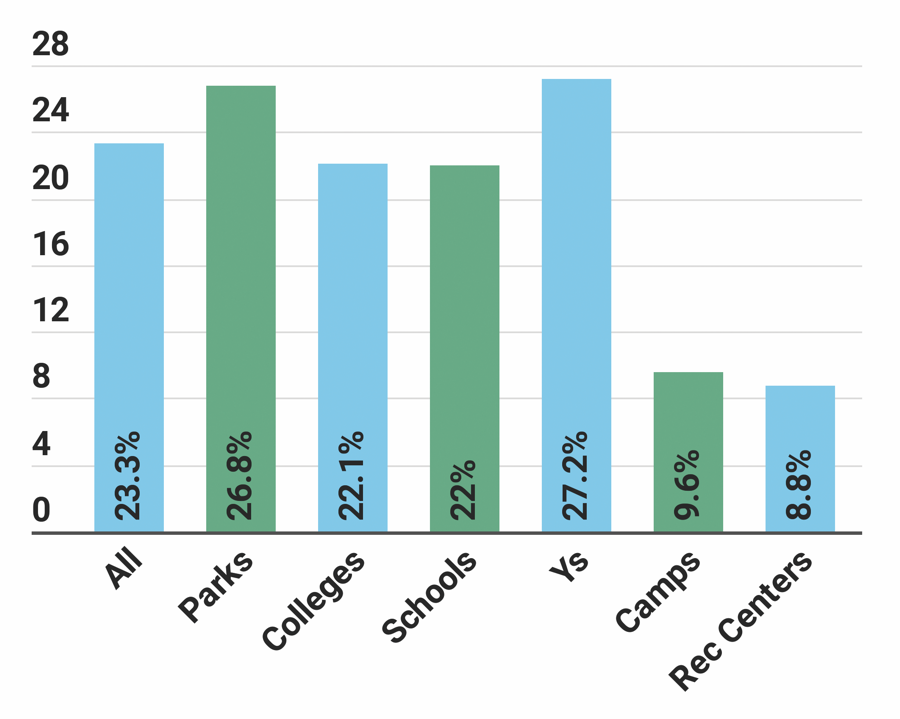
Nearly one-quarter (23.3 percent) of respondents said they had plans to add more programs at their facilities over the next three years. Respondents from Ys were the most likely to have such plans. Some 27.2 percent of Y respondents said they would be adding programs at their facilities in the next three years. They were followed by parks (26.8 percent), colleges (22.1 percent) and schools (22 percent). Only 9.6 percent of camp respondents and 8.8 percent of rec center respondents said they had such plans. (See Figure 18.)
The top 10 most commonly planned program additions include:
Aqua-Yoga & Other Balance Programs (planned by 33.6 percent of those who will be adding programs)
Dive-In Movies (33.2 percent)
Programs for Those With Developmental Disabilities (26.2 percent)
Programs for Those With Physical Disabilities (25.7 percent)
Aquatic Aerobics (19.6 percent)
Doggie Dips (19.2 percent)
Water Walking (13.6 percent)
Adult Swim Teams (12.6 percent)
Aquatic Therapy (12.6 percent)
Learn-to-Swim Programs (11.7 percent)
We asked the 83.3 percent of respondents who offer learn-to-swim programs some further questions about the audience they reach with their programs. As one might expect, learn-to-swim programs aimed at children are the most popular type of program, but there are plenty of other offerings, as well.
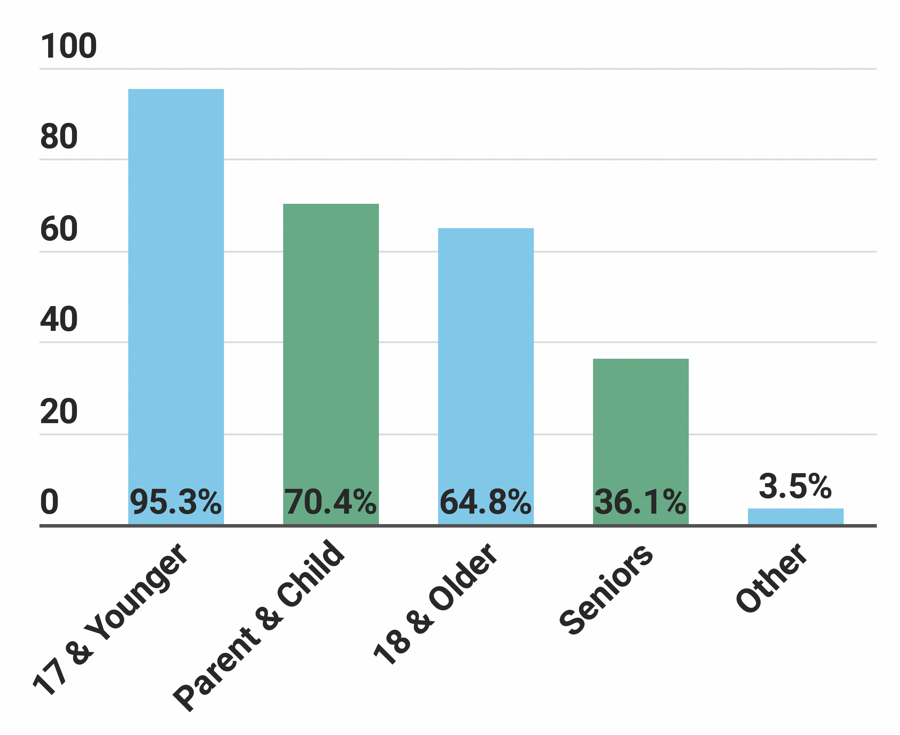
The vast majority (95.3 percent) of respondents who provide learn-to-swim programs are providing programs that reach children age 17 and younger. Another 70.4 percent offer programs for parents and babies or toddlers (such as mommy—or daddy—and me classes). Some 64.8 percent provide learn-to-swim programs for adults age 18 and older. More than one-third 36.1 percent are providing senior learn-to-swim programs. (See Figure 19.)
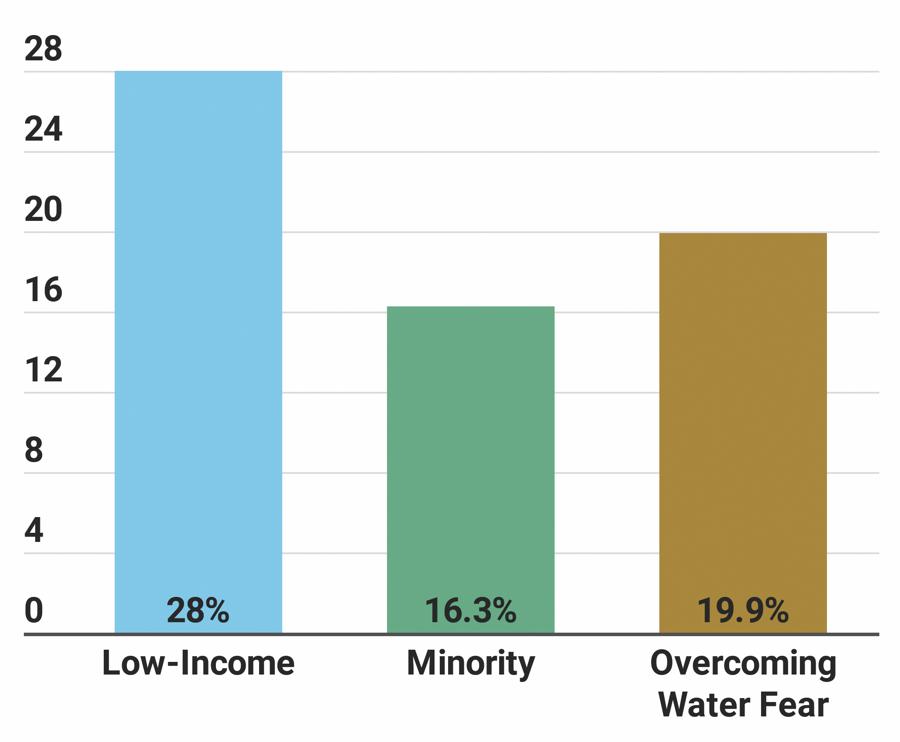
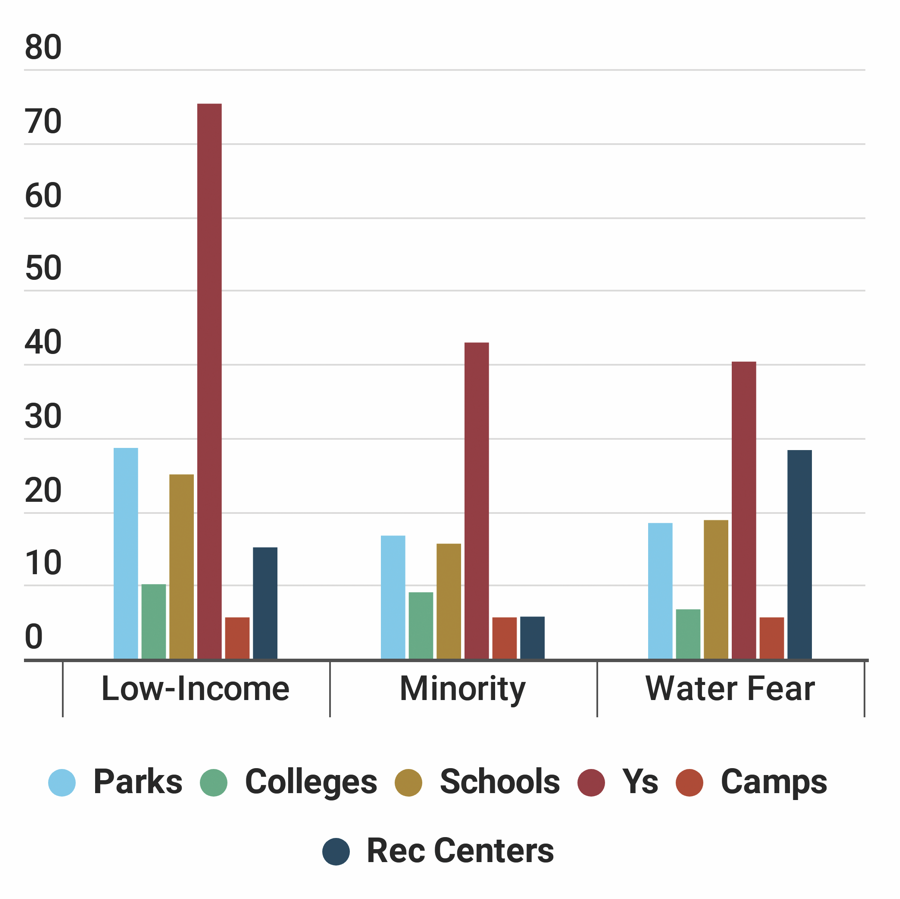
It is fairly commonly understood in the aquatic industry that lower-income populations, as well as minorities often have less access to learn-to-swim programs. Many facilities attempt to overcome these barriers—as well as reaching those with a fear of water—with outreach programs. Nearly three in 10 respondents (28 percent) said they currently have a low-income outreach program, while 16.3 percent have a minority outreach program. Nearly one-fifth (19.9 percent) said they offer learn-to-swim programs that aim to help patrons overcome a fear of water. (See Figure 20.)
Respondents from Ys were the most likely to reach out to low-income, minority and water-phobic audiences. In fact, more than three-quarters (75.3 percent) of Y respondents who had learn-to-swim programs said they had low-income outreach programs, while 42.9 percent engaged in minority outreach, and 40.3 percent had programs for those looking to overcome a fear of water. They were followed by respondents from parks with learn-to-swim programs, 28.6 percent of whom engaged in low-income outreach, with 16.7 percent engaging in minority outreach, and 18.4 percent engaging in programs to overcome water fears. (See Figure 21.)
Water Safety & Drowning Prevention
As mentioned in the previous section, well over half (57.2 percent) of respondents provide water safety training to their patrons. But there are other ways to address water safety, through lifeguarding programs, as well as specific tools aimed at preventing drowning.
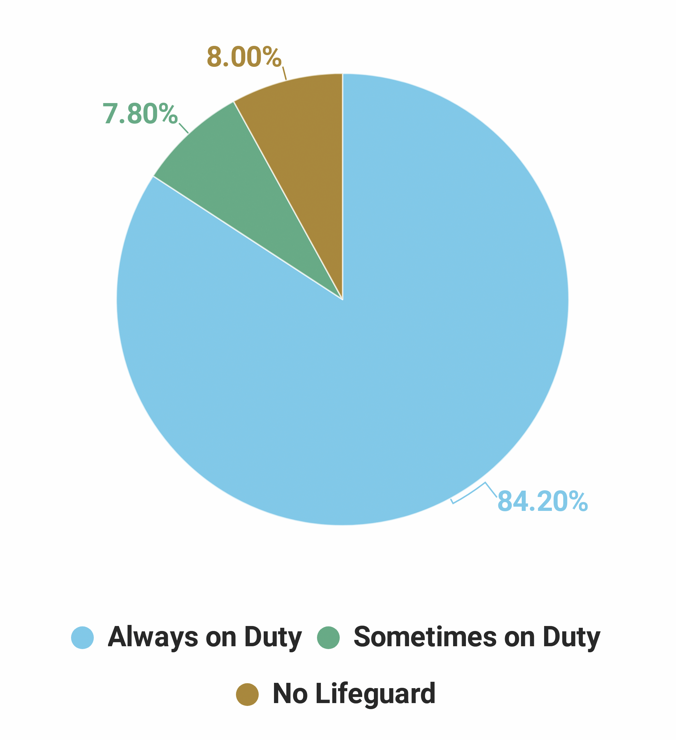
A majority of respondents (84.2 percent) reported that there is a lifeguard on duty at all times the aquatic facility is open. Another 7.8 percent said a lifeguard is on duty during some hours of operation. Only 8 percent said there is never a lifeguard on duty at their facilities. (See Figure 22.)
All 100 percent of the respondents from Ys said that a lifeguard is on duty during all hours that their aquatic facilities are open.
Respondents from colleges were the next most likely to have a lifeguard on duty at least some of the time. Some 92.8 percent said a lifeguard is always on duty, and 5.4 percent said a lifeguard is sometimes on duty.
They were followed by schools (82.9 percent always have a lifeguard, and 14.6 percent sometimes do); parks (92.6 percent always have a lifeguard on duty, and 2.8 percent sometimes do); rec centers (75.4 percent always have a lifeguard on duty, and 19.3 percent sometimes do); and camps (64.7 percent always have a lifeguard on duty, and 15.7 percent sometimes do).
Lifeguards are the first line of defense against drowning, but they are not the only method used to protect swimmers. When it comes to drowning prevention, here are the tools most commonly employed by respondents:
- Lifeguard on Duty: 92.1 percent
- Life Preservers Required for Less-SkilledSwimmers: 54.2 percent
- Safety Device That Sounds 4.9 percent
- Video or Other In-Pool Detection System for Detecting Swimmers in Trouble: 4.9 percent
- Other: 5.5 percent
Respondents from Ys were the most likely to use all of these tools for drowning prevention, while camps were the least likely to rely on these tools for drowning prevention.
ADA Awareness & Compliance
The U.S. Census Bureau reports that there were 56.7 million people in the United States with a disability in 2010. That represents 19 percent—nearly one-fifth—of the population. This includes both physical and mental impairments that have an impact on major life activities.
Also in 2010, the Americans With Disabilities Act (ADA) Standards were updated with new requirements for swimming pools. Broadly speaking, the requirements cover commercial swimming pools, including public pools run by municipalities and school districts, as well as private pools, such as those in hotels. The rules require that pools with more than 300 linear feet of wall need to include two means of access, one of which must be a fixed pool lift or sloped entry. Pools with less than 300 linear feet of wall only require a single means of access, but that must be a lift or sloped entry.
Nearly a decade after the new requirements were introduced, awareness and compliance are both relatively high.
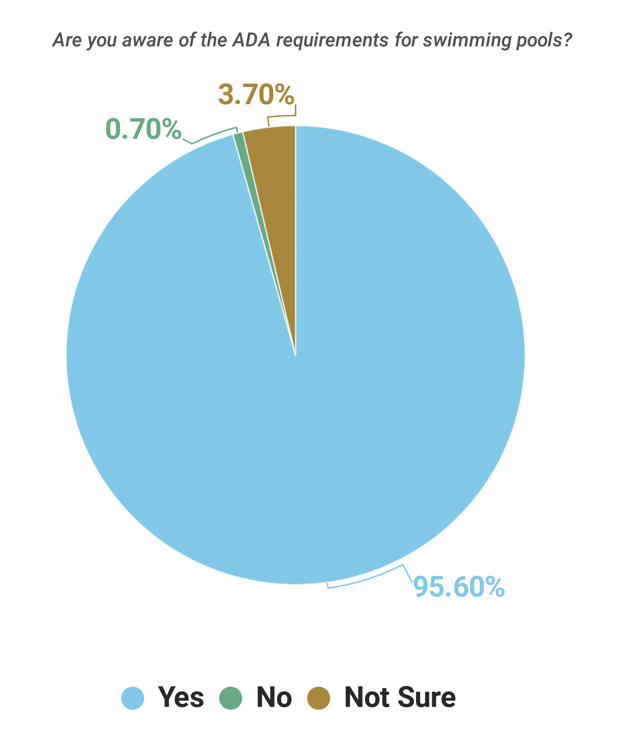
The vast majority of respondents (95.6 percent) said they are aware of the ADA requirements for swimming pools, up from 93.8 percent in 2017. Another 0.7 percent said they are not aware of the requirements, and 3.7 percent were not sure. (See Figure 23.)
Awareness and compliance are two different things, of course. Slightly fewer respondents—87.8 percent—reported that their facilities are currently in compliance with the ADA requirements for swimming pools. Another 5.7 percent said they are not in compliance, and 6.5 percent were unsure. (See Figure 24.)
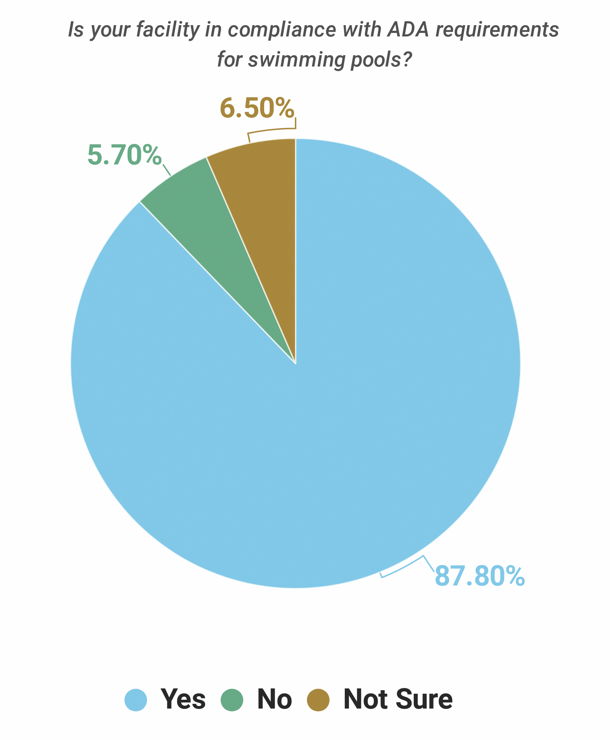
Respondents from Ys were the most likely to report that they were in compliance with ADA requirements, while those from camps were the least likely to be in compliance. Some 93.7 percent of Ys said their aquatic facilities are currently in compliance with ADA requirements. They were followed by those from colleges (89.3 percent), parks (89.2 percent), rec centers (84.2 percent), and schools (82.9 percent). By comparison, just 70 percent of camp respondents said their facilities are currently in compliance with ADA requirements.
MAHC Awareness & Participation
The Model Aquatic Health Code (MAHC) is a set of guidelines published by the U.S. Centers for Disease Control & Prevention (CDC), bringing together the latest science and best practices in order to help state and local government officials develop and update their pool codes. Codes have historically been developed at the local government level to cover such things as how and how often water is tested for safety, how aquatic facilities are built and operated, how chemicals should be used to maintain safe water and more. The MAHC provides local officials with the ability to create a more standardized set of rules and regulations for aquatic facilities based on well-recognized and -researched industry practices.
First released in the summer of 2014, the MAHC is not a static code, but rather is updated regularly as new information and input is made available. The most recent version of the code was released in the summer of 2016.
Created at the request of businesses, health departments, academics and others, the MAHC is meant to be a tool for government agencies to use as they develop their own pool codes. It is not a federal law, which means government agencies can choose whether to adopt it at all, whether to use all of the MAHC or just part of it, or whether to modify all or part of it to fit their needs.
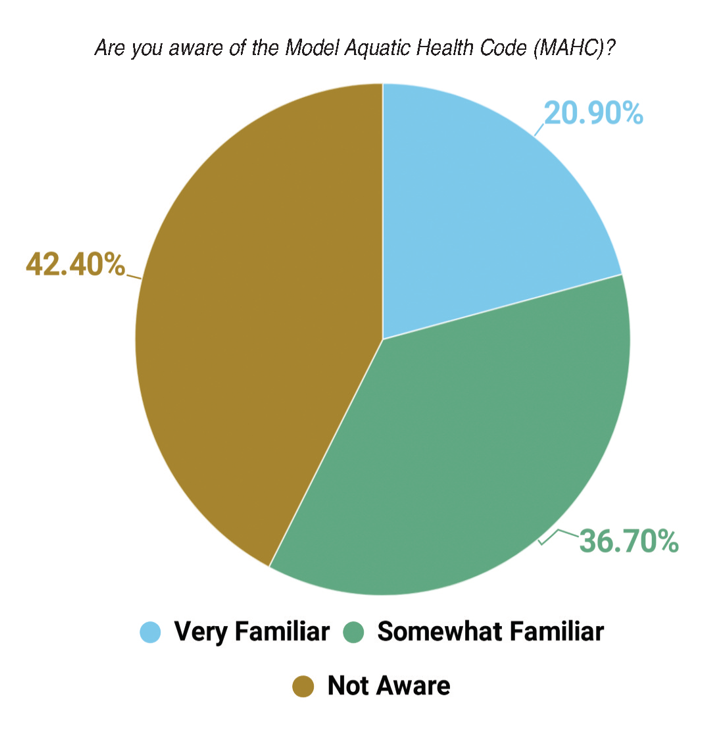
Nearly six in 10 (57.6 percent) of respondents said they are familiar with the MAHC, up from 53.2 percent in 2017. Some 20.9 percent are very familiar with the MAHC, while 36.7 percent said they are somewhat familiar with it. (See Figure 25.)
To ensure the MAHC is regularly updated, a nonprofit organization, the Council for the Model Aquatic Health Code (CMAHC) was created in 2013. The council serves as a clearinghouse for input and advice on improvements to the MAHC. Every three years, CMAHC members can take part in the process of updating the MAHC and have their input heard by the CDC as it revises and releases the next edition. The next CMAHC Conference will be held in October 2020.
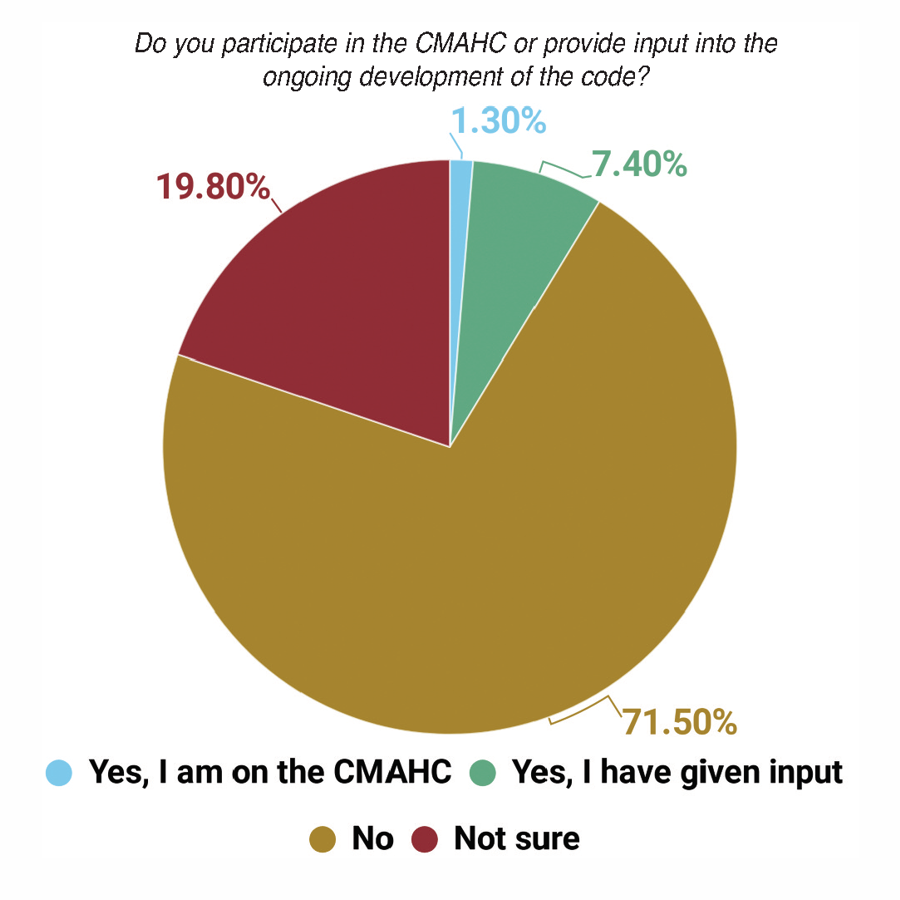
We asked survey respondents whether they participate in the CMAHC or have provided input into the ongoing development of the code. A majority of respondents (71.5 percent) have neither participated in MAHC development or served on the CMAHC. Another 19.8 percent are unsure. Just 1.3 percent of respondents said they are on the CMAHC, and 7.4 percent have provided input into development of the code. (See Figure 26.)
(To learn more about participating in the CMAHC, visit www.cmahc.org.)
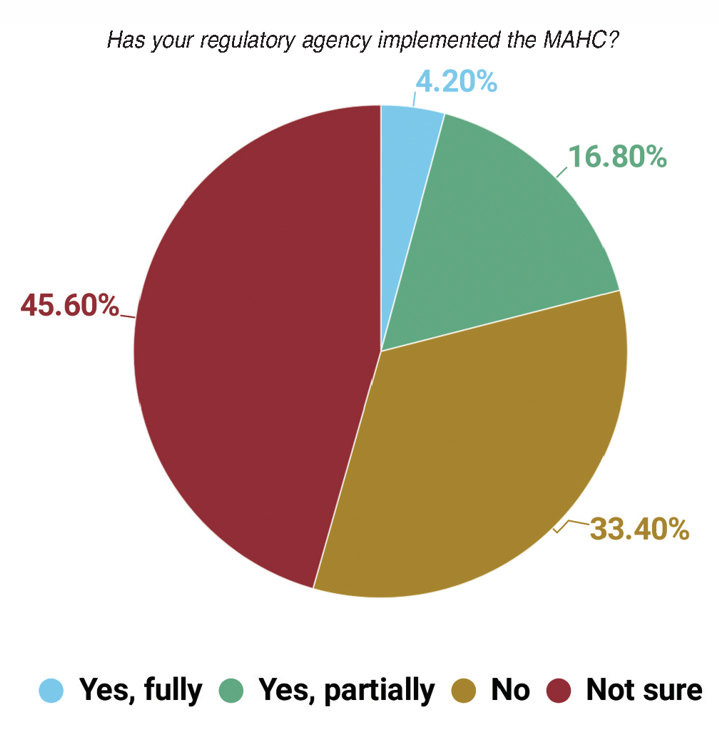
We also asked respondents whether the regulatory agency that governs their facilities has adopted the MAHC, either fully or partially. Slightly less than half (45.6 percent) were not sure. Around one-third (33.4 percent) said their regulatory agency had not adopted the MAHC. Some 4.2 percent said the MAHC had been fully implemented by their regulatory agency, and 16.8 percent said their regulatory agency has adopted portions of the MAHC. (See Figure 27.)
Challenges & Issues
Aquatic facilities are complex, involving everything from staff management and training to water safety and management of equipment and much more. The challenges and issues that arise are likewise complex. According to respondents to the aquatic survey, staffing, budgets, and equipment facility maintenance are the top issues facing aquatic facilities.
More than half of respondents said the top issues facing the aquatics industry include staffing (56.1 percent), budgetary issues (55.3 percent), and equipment and facility maintenance (53.8 percent). More than one-third (35.3 percent) said safety and risk management is a top issue, and more than one-fifth (20.6 percent) said conservation of energy, water and other resources is a top concern. (See Figure 28.)
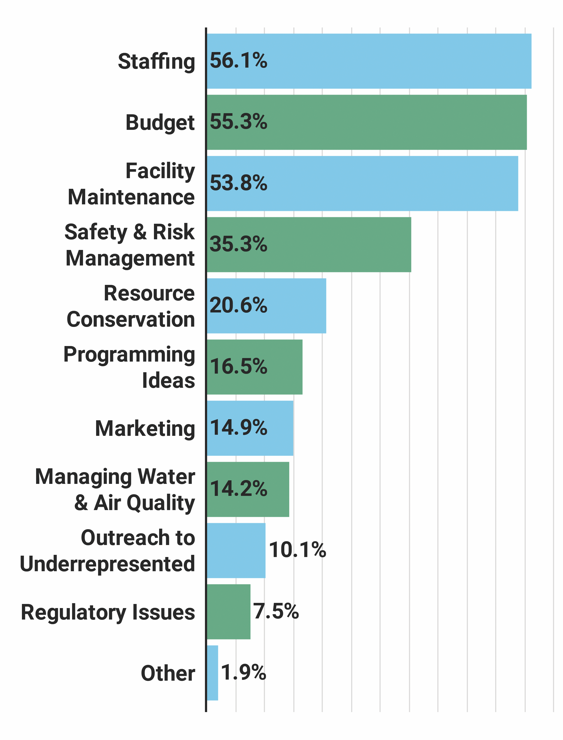
Smaller percentages listed other concerns among the top issues facing the aquatics industry, including: new programming ideas (16.5 percent); marketing and improving attendance (14.9 percent); managing water and air quality (14.2 percent); outreach to minorities and other underrepresented audiences (10.1 percent); and regulatory issues (7.5 percent).
Parks respondents were more likely than the average respondents to name staffing as the top issue facing the aquatics industry. Some 61.1 percent of parks respondents said this was the top issue. Other top issues for parks respondents included: budgets (59.5 percent); equipment and facility maintenance (55.1 percent); safety and risk management (29.5 percent); and conservation of energy, water and other resources (17.5 percent).
For college respondents, the top issues were: budget issues (61.9 percent); equipment and facility maintenance (57.1 percent); safety and risk management (44.8 percent); staffing (42.9 percent); and conservation of energy and other resources (23.8 percent).
For school respondents, the top issues were: budget concerns (70.7 percent); equipment and facility maintenance (53.7 percent); staffing (41.5 percent); conservation of resources (31.7 percent); and safety and risk management (26.8 percent), and managing air and water quality (26.8 percent).
Among Y respondents, the top issues were: staffing (66.7 percent); safety and risk management (46.2 percent); budgetary issues (43.6 percent); equipment and facility maintenance (37.2 percent); and managing air and water quality (19.2 percent).
Camp respondents named the following as their top issues: equipment and facility maintenance (68 percent); staffing (58 percent); safety and risk management (50 percent); budgets (30 percent); and conservation of resources (24 percent).
Among respondents from community sports and recreation centers, the top issues of concern were: staffing (57.1 percent); budgets (57.1 percent); equipment and facility maintenance (50 percent); conservation of resources (28.6 percent); and safety and risk management (26.8 percent).
Many respondents discussed the difficulties of finding lifeguards. As one summed up, "Need more lifeguards. Desperate for more lifeguards. So very, very short on lifeguards."
This seemed to be the prevailing sentiment in comments from respondents. And for those who had enough lifeguards, other staffing issues still came to the fore: "Making sure staff stays focused and attentive while serving as lifeguards. We only have them work 30-minute segments. Even then, several of them don't do the best job of staying focused."
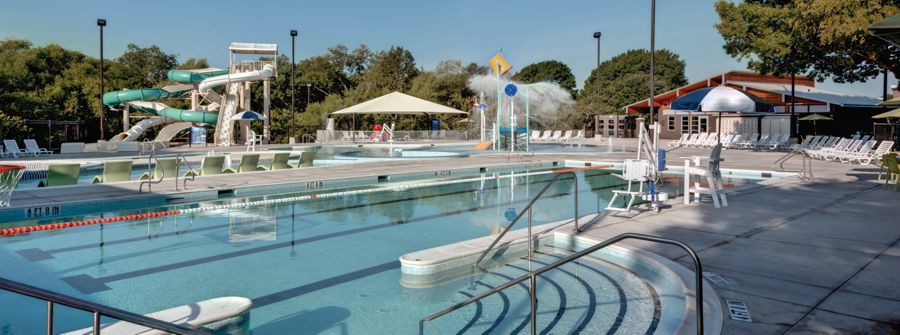
Another said, "The industry is undervalued, and we don't treat aquatics as a career, and that leads to constant turnover. Until the positions are taken seriously, we will never have long-term, reliable employees."
Others discussed the problem of budget constraints, and the effect that has on the rest of the aquatic operation. "Budget constrains affect everything else: marketing, automation/conservation/sustainability, and new attractions like slides," one respondent said.
Another said, "A lot of maintenance and capital projects were deferred during the recession and are still not being funded."
"Our waterparks are an enterprise," another said. "Therefore they need to operate in the black. With aging facilities, it has become challenging to keep pace with repairs and revenue generation to cover."
Another said, "We are a heavily used facility with more needs than we have space for. Our issues stem from being able to keep the facility operational enough for when major systems break down—air handling, pool pumps, etc. Many components are custom-made, and having the spare equipment on hand in the event of a failure can be cost-prohibitive."
© Copyright 2022 Recreation Management. All rights reserved.

