


A Look at Trends in Schools & School Districts
Similar to colleges and universities, local schools and school districts were heavily affected by state-level funding cuts in the wake of the Great Recession. And while states have begun to restore funding for K-12 education in recent years, the Center on Budget and Policy Priorities (CBPP) reports that progress has been slow and uneven.
Importantly, many states have "… shifted school funding responsibilities somewhat from the state to localities since the recession, exacerbating education inequities."
Elizabeth McNichol, senior fellow at the CBPP, reports that while the cuts have had an impact on school operating budgets for teacher salaries and classroom needs, capital spending has also fallen sharply. "And state and local spending on infrastructure in general is at a historic low as a share of the economy," she writes.
The Industry Report has reflected these challenges over the past decade, as school respondents have struggled with budgets and operating costs. Here, we'll take a look at trends reported by respondents to the Industry Report survey who represent schools and school districts—making up 9.8 percent of all respondents.
Respondents from school districts were most likely to be from the Midwest. Some 33.3 percent of school respondents said they were from the Midwest. They were followed by the Northeast (22.2 percent), the South Central region (16.3 percent) and the West (16.3 percent). Finally, 11.9 percent of school respondents were from the South Atlantic states.
School respondents were much more likely to be located in rural areas than suburban or urban areas. More than half (53.7 percent) of school respondents said they were located in rural areas. This compares with 31 percent of non-school respondents. Another 36.3 percent of school respondents were from suburban communities, and just 9.7 percent were from urban communities.
On average, school respondents said they serve a population of 36,160 people. More than three-quarters (75.5 percent) of school respondents said they reach a population of 20,000 or fewer people, compared with 54.5 percent of non-school respondents. Conversely, while 21.8 percent of non-school respondents reach a population of 100,000 or more, just 7.9 percent of school respondents reach a population of that size.
The vast majority of schools covered by the survey were public. Some 89.9 percent of school respondents said they were with public schools. Another 8.6 percent were with private nonprofits, while the remainder are with private for-profit or "other" types of organizations.
On average, school respondents said they manage 8.7 facilities. Some 40.9 percent said they manage between one and three facilities, while another 19.7 percent manage 10 or more facilities. That leaves 39.4 percent in the middle, managing between four and nine facilities.
School respondents were slightly less likely than non-school respondents to report that they have partnered with outside organizations. Some 85.9 percent of school respondents said they had formed such partnerships (down from 86.2 percent in 2018), compared with 88.1 percent of non-school respondents. The most common partners for schools were: local schools (60.7 percent of school respondents said they had partnered with them); local government (51.1 percent); state government (45.2 percent); federal government (25.9 percent); and nonprofit organizations (20 percent).
School respondents were much more likely than non-school respondents to report that the primary audience served by their facilities was made up of teenagers. Some 57.2 percent of school respondents said teens are their primary audience, compared with just 3.4 percent of non-school respondents. Another 21.7 percent of school respondents said they primarily serve all ages, while 12.3 percent said they reach children ages 4 to 12. Another 7.2 percent said adults are their main audience, and the remainder reach infants and toddlers.
Revenues & Expenditures
Schools continue to be among the least likely to report that revenues have increased year-over-year. What's more, the percentage of school respondents who saw their revenue increase fell from 16.3 percent in 2017 to 13 percent in 2018. At the same time, the percentage who said revenues had fallen remained fairly steady, at 11.5 percent. For the most part, school respondents' revenues are relatively stable, with more than three-quarters (75.6 percent) indicating that revenues in 2018 were unchanged from 2017. (See Figure 48.)
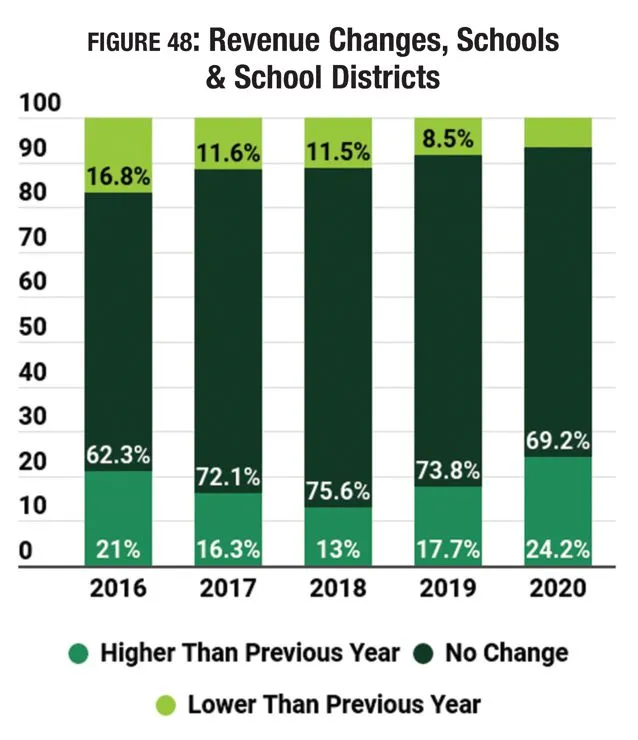
Looking forward, the number of school respondents who expect to see revenues increase grows slightly, to 17.7 percent in 2019 and 24.2 percent in 2020, while the percentage who expect revenues to fall declines to 8.5 percent in 2019 and 6.7 percent in 2020.
From 2017 to 2018, school respondents reported a 22.5 percent decrease in their operating expenditures, from an average of $1,690,000 in 2017 to $1,310,000 in 2018.
Looking forward, they expect their operating expenses to grow 2.3 percent to $1,340,000 in 2019 and then remain unchanged in 2020.
School respondents report that they recover an average of 31.4 percent of their operating costs via revenue, the lowest of all types of respondents. This is down from 2018, when school respondents recovered 34.1 percent of their operating costs, on average. Some 47.8 percent of school respondents said they recover 30 percent or less of their operating costs via revenues. Another 9 percent recover between 31 percent and 50 percent of their costs, and 6 percent recover between 51 percent and 70 percent of their operating costs. Finally, 13.4 percent of school respondents said they recover at least 71 percent of their operating costs via revenues.
School respondents were much less likely than non-school respondents to report that they had taken action to reduce their operating costs, though around two-thirds had done so. Some 66.7 percent of school respondents said they had taken action to reduce their costs, compared with 81.8 percent of non-school respondents. The most common measures employed by schools to reduce their costs were: improving energy efficiency (43.9 percent); putting construction and renovation plans on hold (18.9 percent); reducing staff (17.4 percent); increasing fees (15.9 percent); and cutting programs or services (10.6 percent).
School Facilities
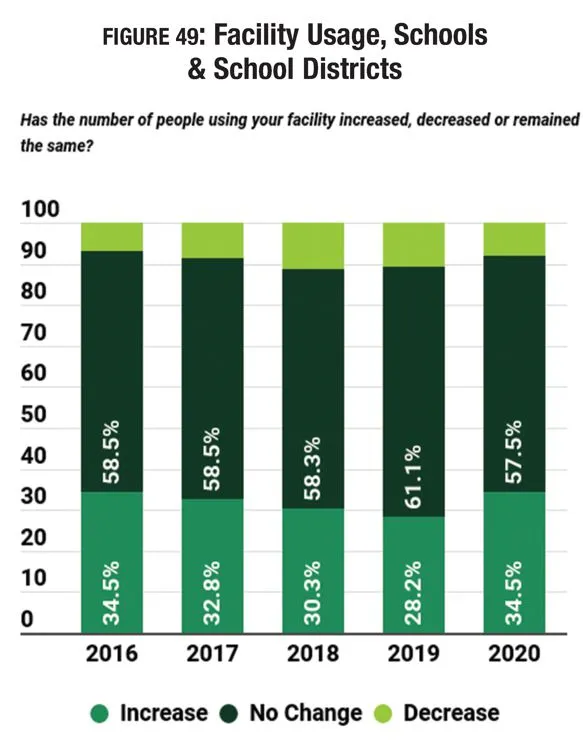
As usual, school respondents were among those most likely to report stable numbers of people using their facilities over time. From 2017 to 2018, 58.3 percent said the number of people using their facilities had stayed the same, while 30.3 percent reported an increase, and 11.4 percent reported a decrease. (See Figure 49.) Looking forward, this trend holds, with 61.1 percent projecting no change in 2019 and 57.5 percent expecting no change in 2020.
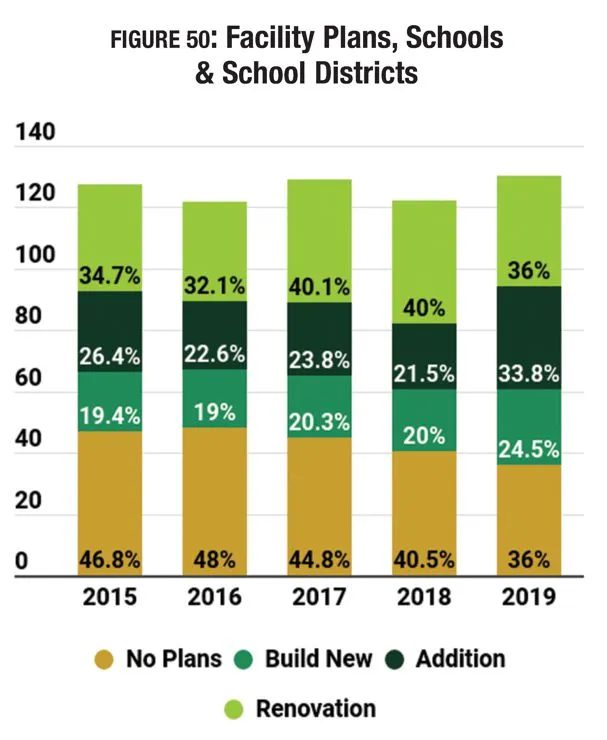
While school respondents were not among those most likely to have plans for construction, the percentage who are planning construction has increased from 55.2 percent in 2017 to 64 percent in 2019. This compared with 71.4 percent of non-school respondents in 2019 who are planning for construction. There was an increase in the number of schools planning new construction (from 20 percent in 2018 to 24.5 percent in 2019), as well as those planning additions (from 21.5 percent to 33.8 percent). Another 36 percent of school respondents are planning renovations at their existing facilities. (See Figure 50.)
School respondents' average construction budget fell 9.7 percent from 2018 to 2019, decreasing from $6,360,000 to $5,740,000. That said, this is still 13 percent higher than the average amount budgeted for construction among all respondents.
The features most commonly included at school respondents' facilities remained consistent from 2018 to 2019. The 10 most common features include: locker rooms; indoor courts for sports like basketball and volleyball; bleachers and seating; natural turf sports fields; concessions; classrooms and meeting rooms; fitness centers; outdoor tracks; outdoor sports courts for sports like tennis and basketball; and playgrounds.
Schools were once again far less likely than non-schools to report that they have plans to add features at their facilities over the next three years. Some 24.5 percent of school respondents said they would be adding features at their facilities, compared with 45 percent of non-school respondents.
The 10 most commonly planned features include:
- Bleachers and seating (35.3 percent of schools with plans to add features)
- Synthetic turf sports fields (23.5 percent)
- Locker rooms (17.6 percent)
- Fitness trails and outdoor fitness equipment (14.7 percent)
- Playgrounds (11.8 percent)
- Fitness centers (11.8 percent)
- Natural turf sports fields (11.8 percent)
- Classrooms and meeting rooms (11.8 percent)
- Park restroom structures (8.8 percent)
- Climbing walls (8.8 percent)
More school respondents in 2019 than in 2018 are planning to add bleachers and seating (up from 32 percent); and locker rooms (up from 18 percent). Fitness trails and outdoor fitness equipment, natural turf sports fields, and park restroom structures did not appear among the top 10 planned features in 2018. They replace concessions, indoor sports courts and exercise studios.
Programming
The vast majority of school respondents (97 percent) said they offer programs of some kind at their facilities. This compares with 96.9 percent of non-school respondents. The most common program offered by school respondents was youth sports teams, found among 80.7 percent of school respondents' facilities. This compares with just 56 percent of non-school facilities and is down slightly from 2018, when 81.6 percent of schools provided youth sports teams.
Other programs commonly found among school respondents' facilities include: educational programs (63.7 percent); fitness programs (57.8 percent); sports tournaments and races (44.4 percent); swimming programs (40 percent); performing arts programs (37 percent); individual sports activities such as running clubs (36.3 percent); holidays and other special events (34.8 percent); group exercise programs (34.8 percent); and special needs programs (33.3 percent).
Programs that saw growth from 2018 to 2019 include: fitness programs (up from 48.5 percent); swimming programs (up from 30.1 percent); performing arts programs (up from 34.7 percent); and holidays and other special events (up from 31.1 percent). Group exercise programs and special needs programs were not among the top offered programs in 2018. They replace sport-specific training and arts and crafts programs.
School respondents were far less likely than others to indicate that they had plans to add more programming at their facilities over the next three years. Only 12.2 percent of school respondents said they had such plans (down from 13.5 percent in 2018), compared with 33.5 percent of non-school respondents.
The top planned programs among school respondents include:
- Fitness programs (no change from 2018)
- Individual sports activities such as running clubs (up from No. 8)
- Youth sports teams (up from No. 4)
- Group exercise programs (did not appear in 2018)
- Educational programs (down from No. 2)
- Day camps and summer camps (did not appear in 2018)
- Sports tournaments and races (down from No. 3)
- Sport training (did not appear in 2018)
- Performing arts programs (up from No. 10)
- Teen programming (down from No. 7)
Programs that dropped off the list of top planned programs from 2018 include: adult sports teams; mind-body balance programs; and special needs programs.
What's Under Foot?
Synthetic turf sports fields have long held a place among the top 10 planned additions for both school respondents and college respondents in the survey results. At the same time, the percentage of these respondents who indicate that their facilities currently include synthetic turf fields has grown.
Among school respondents, the number whose facilities currently include synthetic turf has grown from 25.4 percent in 2015 to 35.8 percent in 2019. At the same time, the number who indicate that they are planning to add synthetic turf has fallen, from 28.3 percent of those with plans to make additions at their facilities in 2015 to 23.5 percent in 2019.
The percentage of college respondents whose facilities currently include synthetic turf has grown from 42.3 percent in 2015 to 50.7 percent in 2019. And, like schools, the number who say they are planning to add synthetic turf at their facilities has decreased, from 33.6 percent of those with plans to make additions in 2015 to 26 percent in 2019.