


A Look at Trends in Aquatic Facilities
Swimming pools and other aquatic facilities feature a dazzling array of amenities and possibilities, from simple, rectangular community pools to splash play areas, from natatoriums designed for competition to wide-ranging aquatic parks with slides, surf machines, wave pools and more. There's been a lot of innovation over the years that adds up to pools that run more effectively, more efficiently, with cleaner, clearer water that offers a tremendous range of possible activities for visitors. And that innovation keeps on coming, which means today's pools can use fewer resources to provide cleaner water for a wider range of fun and fitness.
In this section, we'll take a look at the answers provided by those survey respondents whose facilities include aquatic elements. For our purposes here, that means these facilities include at least one of the following: indoor swimming pools, outdoor swimming pools, splash play areas, waterparks or hot tubs.
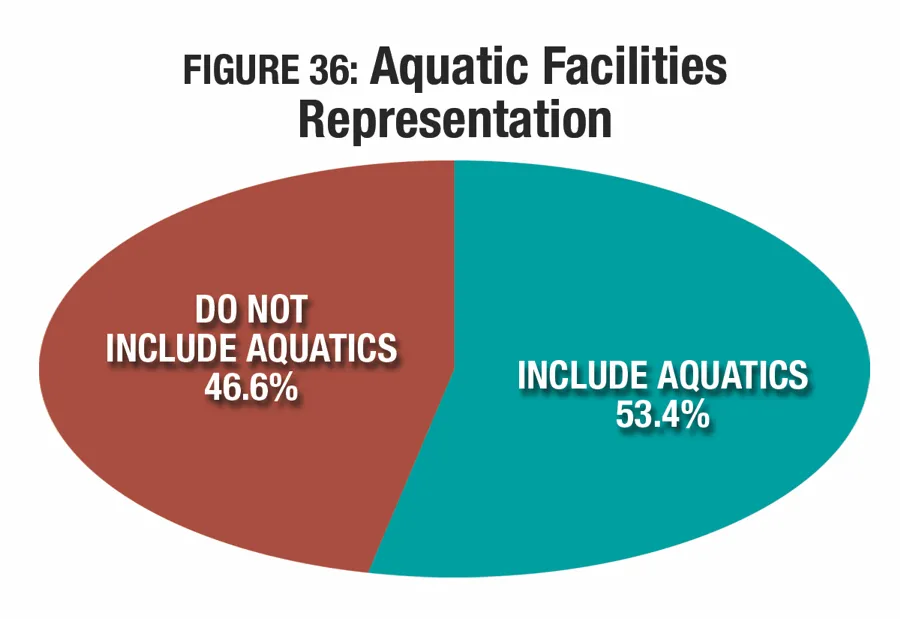
In 2017, more than half (53.4 percent) of respondents to the Industry Report survey said their facilities included aquatic elements. (See Figure 36.)
Aquatic Facilities
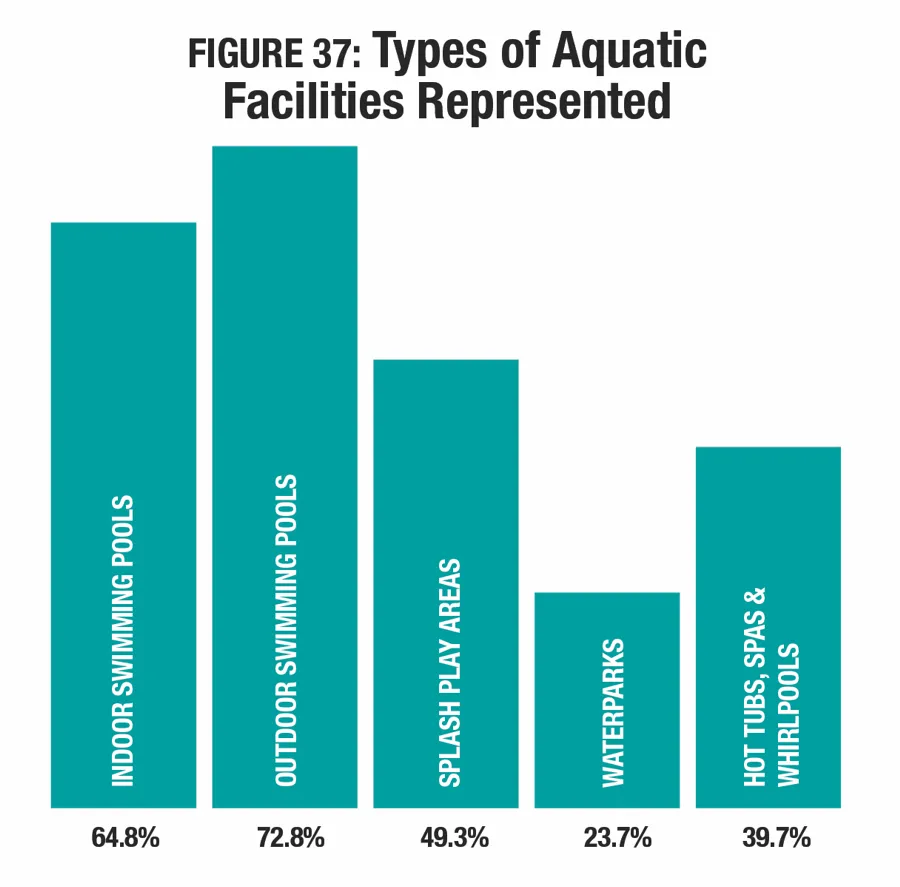
There was little change in the types of aquatic facilities represented in the survey between 2016 and 2017. The most common type of aquatic facility found among respondents' facilities was outdoor swimming pools. More than seven out of 10 (72.8 percent) aquatic respondents said they had at least one outdoor swimming pool. They were followed by indoor swimming pools, found among 64.8 percent of aquatic respondents. Nearly half (49.3 percent) said they had splash play areas. Another 39.7 percent had hot tubs, spas or whirlpools. And slightly less than one-quarter (23.7 percent) of aquatic respondents said they had waterparks.
Outdoor swimming pools were most commonly found among aquatic respondents from the South Atlantic and South Central regions. Some 84.7 percent of South Atlantic respondents and 78.2 percent of South Central respondents said they had outdoor swimming pools. They were followed by those in the West, where 73.2 percent had outdoor pools. Respondents from the Midwest were the least likely to include outdoor pools, with 64.3 percent indicating they included this type of feature at their facilities. When considered by community type, respondents from the suburbs were most likely to include outdoor pools, with 76.3 percent of suburban respondents including them in their facilities.
Indoor swimming pools were most commonly found among aquatic respondents located in the Northeast region, where 68.3 percent of aquatic respondents said they had indoor pools. They were followed by respondents from the South Central region, where 67.9 percent had indoor pools. South Atlantic respondents were the least likely to report that they had indoor pools, with 56.9 percent indicating they did. When it comes to community type, indoor pools were most common among urban respondents, with 73.7 percent indicating their facilities included at least one indoor pool.
Splash play areas were most commonly found among aquatic respondents from the West, where 55.5 percent said they counted at least one splash play area among their facilities. They were followed by the South Atlantic and South Central regions, where 52.8 and 52.7 percent of respondents, respectively, said they include splash play areas. Nearly half (48 percent) of Midwestern aquatic respondents also included splash play. Splash play areas were least common in the Northeast, where 34.6 percent of aquatic respondents said they include them. Community-wise, splash play areas were most common in urban areas, with 57.2 percent of urban aquatic respondents reporting that they have at least one splash play area.
Waterparks were most commonly found among aquatic respondents from the South Central states and the Midwest. Some 32 percent of South Central respondents and 28 percent of Midwestern respondents said they had at least one waterpark among their facilities. Waterparks were least common in the Northeast, where only 10.9 percent of respondents included them. Considered by community type, waterparks were most commonly found in the suburbs, with 27.9 percent of suburban aquatic respondents reporting that their facilities include at least one waterpark.
Hot tubs, spas and whirlpools were most commonly found among aquatic respondents located in the West, where 53.3 percent said they feature hot tubs. They were followed by the Midwest, where 38.5 percent of respondents had hot tubs. Hot tubs were least common in the Northeast, where only 30 percent of respondents said they include them. In terms of community type, urban respondents were the most likely to include hot tubs, with 43.8 percent of aquatic respondents from urban areas reporting that they include at least one hot tub, spa or whirlpool as part of their facilities.
Different types of aquatic amenities might be more expected at specific types of facilities than others. For example, indoor pools might be more expected at a Y or a college than at a park district or a camp, while hot tubs might more commonly be expected at health clubs.
Among aquatic respondents, those from camps were the most likely to include at least one outdoor pool among their amenities. Some 93 percent of camp respondents with aquatics said they have outdoor pools. They were followed by park respondents (74.5 percent), and community centers (56.9 percent).
For indoor swimming pools, aquatic respondents from college and universities predominate, with 92.4 percent indicating they include indoor pools at their facilities. They were followed by health clubs (91.5 percent) and Ys (86 percent).
Aquatic respondents from parks were more likely than other facility types to include splash play areas. Some 57 percent of park respondents with aquatics said they had at least one splash play area. They were followed by community centers (40 percent) and Ys (22 percent).
Waterparks also were most commonly found among park respondents. Some 24.1 percent of park respondents with aquatics said they include a waterpark. They were followed by community recreation centers, where 10.8 percent include waterparks, and camps (10.5 percent).
Hot tubs, spas and whirlpools were most commonly found in the facilities of aquatic respondents from health clubs. More than three-quarters (78.7 percent) of aquatic respondents from health clubs said their facilities included hot tubs. They were followed by Ys (45 percent), and community sports and recreation centers (41.5 percent).
As in past years, a majority of pools covered in the report are used for either leisure and recreation, or a combination of recreation and competition. Only 1.5 percent of respondents with aquatics said their pools are used only for competition. More than half (51.7 percent) said their pools are home to both recreational and competitive swimming. And 46.9 percent of respondents said their pools are used for recreation and leisure. (See Figure 38.)

Pools that were used for leisure and recreation only were most commonly found among respondents from camps. Some 85.5 percent of camp respondents said their aquatic facilities were for leisure and recreation. They were followed by health clubs (67.4 percent) and community sports and recreation centers (54.8 percent). Respondents from schools were the least likely to have pools that were just for recreation, with 12.9 percent of school respondents indicating their pools were for recreation only.
Competition pools were most prevalent among school respondents. Some 22.6 percent of school respondents with aquatics said their pools were for competition only. They were followed by colleges, where 4.3 percent said their pools are just for competition, and Ys where just 1 percent said they had competitive pools. No other respondents had pools that were strictly used for competition.
Pools used for a combination of recreation and competition were most commonly found among aquatic respondents from Ys. Some 65 percent of Y respondents said their pools were used for a combination of recreation and competition. They were followed by schools (64.5 percent) and parks (60.3 percent).
Pools & Budgets
From 2015 to 2016, and over the next two years as well, respondents with aquatics are seeing smaller increases in their overall operating expenditures, when compared with respondents with no aquatic elements. From 2015 to 2016, aquatic respondents saw their average operating expenses grow by 16.7 percent, from $2,229,000 to $2,601,000. This compares with a 19.5 percent increase for respondents with no aquatics, from $1,171,000 in 2015 to $1,399,000 in 2016.
Looking forward, aquatic respondents expect their average overall operating expenses to grow by 2.7 percent, to $2,671,000 by 2018. Respondents without aquatics are expecting their operating expenses to grow by 6.4 percent, to an average of $1,489,000 in 2018.
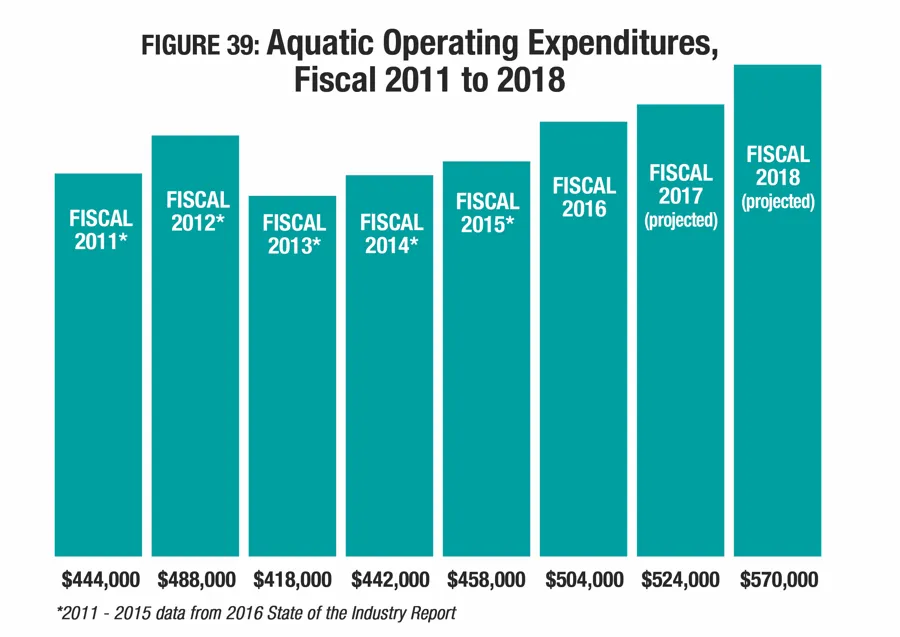
The average operating expense for aquatics only also saw an increase from 2015 to 2016, though this increase was smaller than for overall operating budgets. Aquatic operating expenses grew 10 percent in this time period, from $458,000 to $504,000. Over the next two years, aquatic respondents expect their aquatic operating expenses to grow by 13.1 percent, to an average of $570,000 in 2018. (See Figure 39.)
Respondents from parks reported the highest overall average aquatic operating expenditure for 2016, with an average of $675,000. They were followed by respondents from Ys ($557,000), community sports and recreation centers ($404,000) and health clubs ($301,000). Respondents from camps had the lowest average aquatic operating expenditure in 2016, at $101,000. They were followed by schools ($205,000) and colleges and universities ($250,000).
From 2016 to 2018, respondents from Ys projected the greatest growth rate for their aquatic operating expenditures. Y respondents with aquatics projected their aquatic operating expenses would grow by 34.3 percent, to a total of $748,000 in 2018. Also expecting increases of greater than 10 percent were community sports and recreation centers (up 20.3 percent to an average of $486,000), and colleges and universities (up 18.4 percent to an average of $296,000). Smaller increases to average aquatic operating expenses were expected among respondents from parks, who expect their aquatic costs to rise 9.2 percent to $737,000 on average in 2018, as well as camps (up 6.9 percent to $108,000) and health clubs (up 4 percent to $313,000). School respondents projected no change to their average aquatic costs from 2016 to 2018.
Just under a third (32 percent) of aquatic respondents said their aquatic revenues had increased from 2015 to 2016, up from 30.8 percent who said they had seen an increase from 2014 to 2015. At the same time, the number of aquatic respondents whose aquatic revenues had decreased fell to 10.2 percent reporting a decrease from 2015 to 2016 (11.6 percent reported a decrease from 2014 to 2015).
Looking forward, a growing number of aquatic respondents expect their aquatic revenues to rise, while the percentage projecting a decrease falls slightly. From 2016 to 2017, 33.6 percent of aquatic respondents are expecting aquatic revenues to increase, and 6.2 percent projected a decrease. From 2017 to 2018, 34.8 percent expect aquatic revenues to rise, while 4.7 percent expect them to fall.
From 2015 to 2016, aquatic respondents from health clubs were the most likely to report an increase in aquatic revenues. Some 40.9 percent of health club respondents said their aquatic revenues had increased from 2015 to 2016. They were followed by those from parks, 37.5 percent of whom reported an increase, and community sports and recreation centers, 31.3 percent of whom saw an increase. Schools were the most likely to report that aquatic revenues had fallen from 2015 to 2016, with 16.1 percent of school respondents indicating they'd seen a decrease.
Looking forward, parks, Ys, and community sports and recreation centers were the most likely to be expecting increases to their aquatic revenues. From 2016 to 2017, 40.4 percent of parks, 39.2 percent of Ys, and 32.8 percent of community centers said they expect aquatic revenues to increase. From 2017 to 2018, 47.8 percent of Ys, 42.4 percent of community centers and 39.1 percent of parks are expecting an increase.
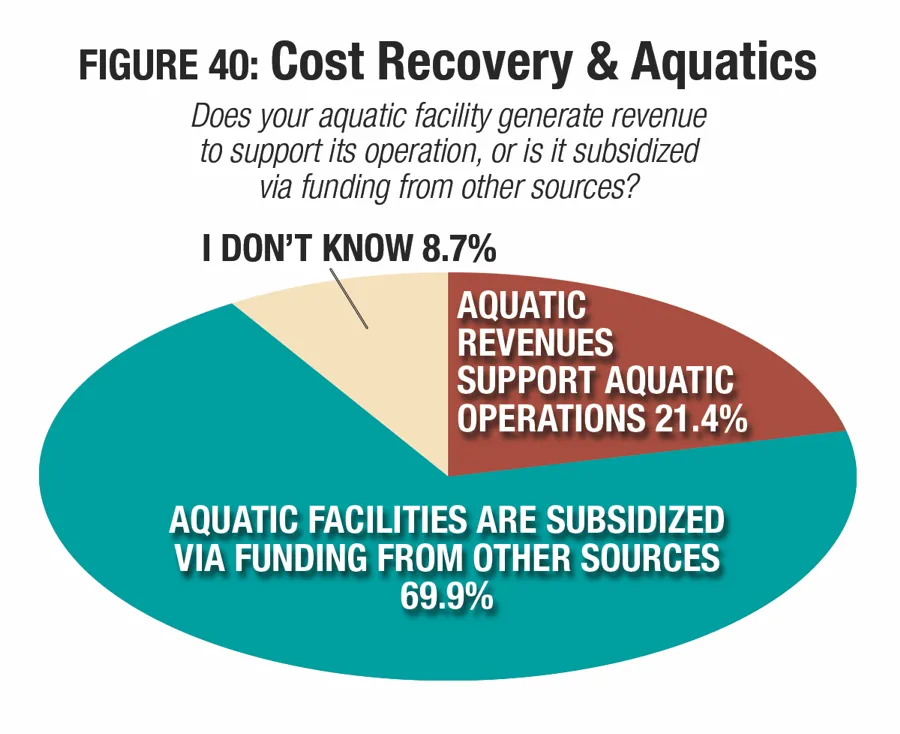
After holding steady for several years, the percentage of aquatic respondents who assert that their aquatic revenues support their aquatic operations grew slightly in 2017. More than one-fifth (21.4 percent) of aquatic respondents said their facility generates the revenue to support its operations, up from 19.7 percent in 2016. Another 69.9 percent said their aquatic facilities are subsidized via funding from other sources (See Figure 40.)
Respondents from private, for-profit organizations were the most likely to report that they were able to support their aquatic operations with revenues from their aquatic facilities. Some 29.1 percent of for-profit respondents said their aquatic facilities were supported via revenues, while 59.5 percent said their aquatic operations were subsidized with funding from other sources.
Public and private nonprofit organizations were much more likely to rely on other funding to subsidize their aquatic operations. Among public organizations, 21.4 percent said their aquatic facilities were supported via revenues, while 70.1 percent said they were subsidized with revenue from other sources. And for private, nonprofit organizations, 19.3 percent said aquatic operations are paid for via revenues, while 72.3 percent said their aquatic operations were subsidized with funding from other sources.
Respondents from health clubs were the most likely to report that they earned their aquatic operating costs back via aquatic revenues. Some 37 percent of health club respondents said they cover the cost of their aquatic operations with revenues, while 56.5 percent said those costs were subsidized. They were followed by respondents from Ys, 25 percent of whom said aquatic operations were covered by revenues, while 68 percent said those costs were subsidized, and park respondents 22.7 percent of whom said costs were covered via revenues, while 68.9 percent said those costs were subsidized.
Respondents from camps, colleges and community sports and recreation centers were the most likely to subsidize their aquatic operations with funding from other sources. Some 84.9 percent of camp respondents, 76.3 percent of college respondents and 75 percent of community center respondents said their aquatic operating expenditures were subsidized with funding from other sources.
Programming
The majority of aquatic respondents reported that they offer aquatic programming at their facilities, from swimming lessons and water safety to aquatic exercise, lifeguard training and more. Some 95.2 percent of aquatic respondents said they provide aquatic programming. This includes 100 percent of aquatic respondents from YMCAs, health clubs and schools. Among college respondents with aquatics, 99.1 percent provide aquatic programs. Respondents from community sports and recreation centers, parks and camps were the least likely to provide aquatic programming, though 93.8 percent, 93.3 percent and 90.7 percent, respectively, said they do provide such programs.
The top 10 aquatic programs currently offered at aquatic facilities is virtually the same as last year, with just one position change, and some slight variation in the percentage offering each type of program. The top 10 programs offered include:
- Leisure swim (included at 87.1 percent of aquatic facilities)
- Learn-to-swim for children (80.5 percent)
- Lap swim (74.9 percent)
- Lifeguard training (71.3 percent)
- Aquatic exercise programs (67.1 percent)
- Water safety programs (60.6 percent)
- Learn-to-swim for adults (60 percent)
- Youth swim teams (55.5 percent)
- Swim meets and competitions (48 percent)
- Special needs aquatic programs (38.6 percent)
Programs that saw an increase of at least 2 percentage points in the number of respondents providing them include special needs aquatic programs (up 3.6 from 35 percent) and water safety programs (up 2.7 from 57.9 percent).
Aquatic respondents from Ys were more likely than others to provide leisure swim, learn-to-swim for children, lifeguard training, water safety programs, learn-to-swim for adults and special needs aquatic programs.
Aquatic respondents from schools were more likely than others to report that they provide youth swim teams, swim meets and competitions, school and collegiate swim teams, adult swim teams, and diving or diving teams.
Respondents from health clubs with aquatics were more likely than others to provide lap swim, aquatic exercise programs and aqua-therapy programs.
Finally, aquatic respondents from colleges and universities were more likely than those from other types of facilities to provide water polo programs.
The percentage of aquatic respondents who plan to add new programs at their facilities over the next few years remained virtually unchanged from 2016 to 2017. In 2016, 18.2 percent were planning to add programs, and in 2017, 18.3 percent have such plans.
Aquatic respondents from health clubs were the most likely to be planning to add aquatic programs at their facilities. Some 25.5 percent of health club respondents with aquatics had such plans. More than one-fifth of respondents from community sports and recreation centers (24.6 percent), Ys (23 percent) and schools (21.9 percent) also had plans to add aquatic programs at their facilities. Camps were the least likely to report that they were planning to add aquatic programs, with 12.3 percent of these respondents indicating they would do so. They were followed by colleges (14.3 percent) and parks (17.5 percent).
The top 10 planned program additions include:
- Special needs aquatic programs (planned by 24.7 percent of those who will be adding programs)
- Learn-to-swim for adults (23.5 percent)
- Aquatic exercise programs (23.5 percent)
- Youth swim teams (15.9 percent)
- Adult swim teams (15.9 percent)
- Aqua-therapy programs (15.3 percent)
- Water safety programs (13.5 percent)
- Lifeguard training (13.5 percent)
- Water polo (12.4 percent)
- Learn-to-swim for children (11.2 percent)
Aquatic respondents from schools and school districts were the most likely to be planning to add: youth swim teams, water polo, learn-to-swim for children, school and collegiate swim teams, diving and diving teams, and lap swim.
Aquatic respondents from Ys were the most likely to be planning to add aqua-therapy programs, swim meets and competitions, and leisure swim.
Aquatic respondents from health clubs were most likely to be planning to add water safety programs and lifeguard training.
Aquatic respondents from camps were the most likely to be planning to add learn-to-swim for adults and aquatic exercise programs.
Aquatic respondents from parks were the most likely to be planning to add special needs aquatic programs.
Aquatic respondents from community sports and recreation centers were the most likely to be planning to add adult swim teams.
Facility Enhancements
The percentage of aquatic respondents with plans to build new facilities or make additions or renovations to their existing facilities grew in 2017. While 68.5 percent of aquatic respondents had plans for construction in 2016, for 2017, that number has grown to 71.6 percent. Aquatic respondents were more likely than those without aquatics to be planning construction. Less than two-thirds (64.5 percent) of non-aquatic respondents said they had plans for construction.
Aquatic respondents were more likely than those without aquatics to be planning changes at their existing facilities, while those without aquatics were more likely to be planning new construction. More than half (52.3 percent) of aquatic respondents said they are planning renovations, compared with 45.8 percent of non-aquatic respondents. And 31 percent of aquatic respondents are planning additions, compared with 30 percent of non-aquatic respondents. On the other hand, 29.1 percent of non-aquatic respondents are planning new construction, compared with 28.2 percent of aquatic respondents.
Aquatic respondents' average budget for construction grew 20.2 percent from 2016 to 2017. In 2016, aquatic respondents were planning to spend an average of $3,975,000, while 2017 respondents are planning to spend $4,776,000. This is 29.4 percent higher than the average construction budget for non-aquatic respondents, at $3,691,000. However, non-aquatic construction budgets increased more sharply between 2016 and 2017, with a 25.3 percent increase, from $2,945,000 in 2016.
The top 10 aquatic features covered by the survey that are most commonly found among aquatic respondents' facilities include:
- Pool lift and accessibility equipment (found among 69.6 percent of aquatic respondents' facilities)
- Automatic chemical feeders (67.7 percent)
- Diving boards (42.1 percent)
- Zero-depth entry (37.8 percent)
- Waterslides (36.8 percent)
- Water play structures (33.4 percent)
- Splash pads (23.5 percent)
- UV disinfection systems (22.1 percent)
- Lazy rivers (14.5 percent)
- Saline chlorination systems (11.5 percent)
That's Up-LIFT-ing
After design guidelines for the Americans With Disabilities Act (ADA) established new standards for pools in terms of accessibility, requiring pools to provide a means of entry, the number of respondents who reported that they included pool lifts and accessibility equipment at their facilities increased rapidly, growing from just 52.8 percent in 2011 to a high of 75.5 percent in 2014, before falling off slightly. In 2017, 69.6 percent of respondents said their facilities currently include pool lifts and accessibility equipment.
Understandably, as more have added this equipment to their facilities over time, the percentage of respondents who plan to add lifts and accessibility equipment has fallen. While more than one-third (34.6 percent) had such plans in 2013, that number has gradually fallen, with 21.3 percent planning to add lifts in 2015, and just 16.3 percent indicating they have such plans as of 2017.
Aquatics respondents from park facilities were more likely than others to include: zero-depth entry, waterslides, water play structures, splash pads, UV disinfection systems, lazy rivers, poolside cabanas, solar pool heating, wave pools, and surf simulators.
Respondents from schools with aquatics were more likely than others to include pool lifts and accessibility equipment, and diving boards.
Aquatic respondents from health clubs were more likely than others to include saline chlorination systems and ozone systems.
Aquatic respondents from Ys were more likely than others to include automatic chemical feeders.
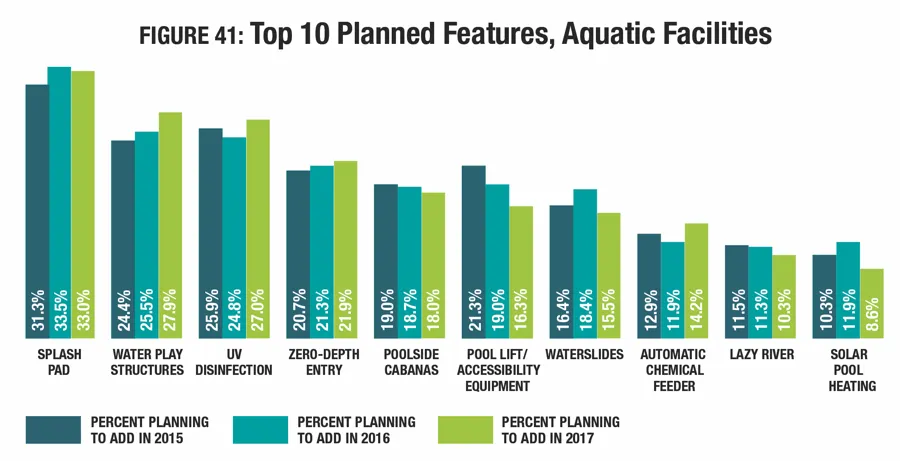
One-quarter (25 percent) of aquatics respondents said they had plans to add more features at their facilities over the next few years, down slightly from 2016, when 27.1 percent had such plans. Aquatic respondents from community sports and recreation centers were the most likely to be planning additions. Some 35.4 percent of community center respondents with aquatic said they would be adding features. They were followed by aquatic respondents from parks (26.7 percent), camps (24.6 percent), Ys (24 percent), health clubs (21.3 percent) and schools (18.8 percent). Aquatic respondents from colleges were the least likely to be planning to add features, with just 10.1 percent reporting that they had such plans.
The most commonly planned additions in 2016 included splash pads (33 percent of aquatic respondents with plans to add features will add them); water play structures (27.9 percent); and UV disinfection (27 percent). More respondents in 2017 than in 2016 are planning to add: water play structures (27.9 percent vs. 25.5 percent); UV disinfection (27 percent vs. 24.8 percent); zero-depth entry (21.9 percent vs. 21.3 percent); and automatic chemical feeders (14.2 percent vs. 11.9 percent). (See Figure 41.)
Aquatic respondents from parks were more likely than those from other types of facilities to be planning to add: splash pads, poolside cabanas, ozone systems, diving boards, surf simulators and wave pools.
Aquatic respondents from Ys were more likely than others to be planning to add zero-depth entry, waterslides and lazy rivers.
Aquatic respondents from camps were more likely than others to be planning to add pool lifts and accessibility equipment, solar pool heating, and saline chlorination systems.
Aquatic respondents from schools were more likely than others to be planning to add UV disinfection systems and automatic chemical feeders.
Aquatic respondents from community centers were more likely than others to be planning to add water play structures.