


A Look at Trends in Aquatic Facilities
From the biggest waterparks with all the rides and slides down to the smallest hotel pool, aquatic facilities present a tremendous range of possibilities. Innovations in manufacturing and operations and research into health and safety have led to many advances over time, and while aquatic facilities still present unique management challenges (and headaches), it's easier than ever to maintain a more efficient, healthier pool or aquatic feature, while providing the fun and fitness will keep people coming back time and again for more.
In this section, we take a look at the answers provided by survey respondents whose facilities include aquatic elements: indoor swimming pools, outdoor swimming pools, splash play areas, waterparks and hot tubs. For much more information on aquatics, be sure to tune in to all of our tabloid-size issues (every month but June, August and December), where we feature a regular roundup of aquatics-specific research conducted as a supplement to this Industry Report.
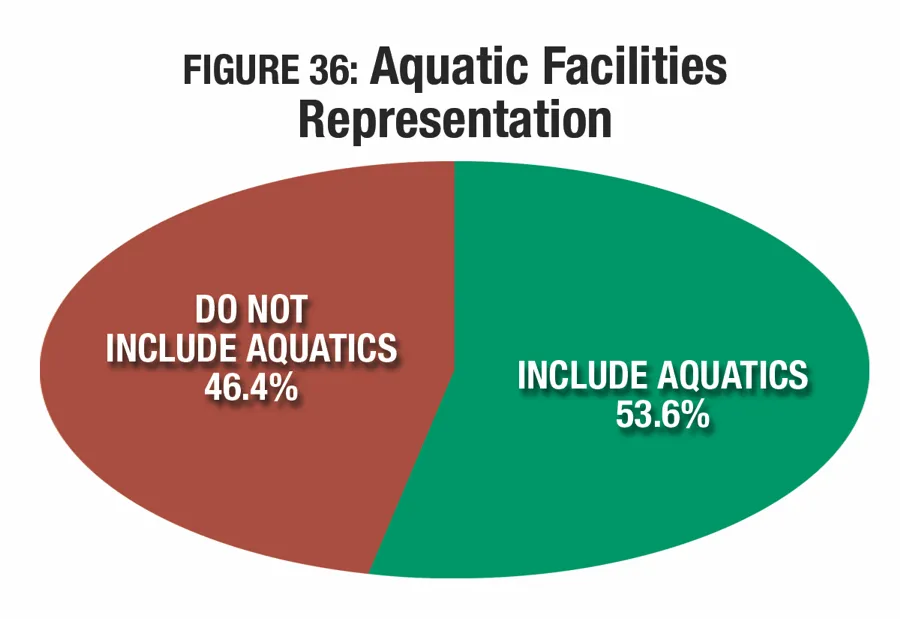
In 2018, more than half (53.6 percent) of respondents to the Industry Report survey said their facilities include aquatic elements. (See Figure 36.)
Aquatic Facilities
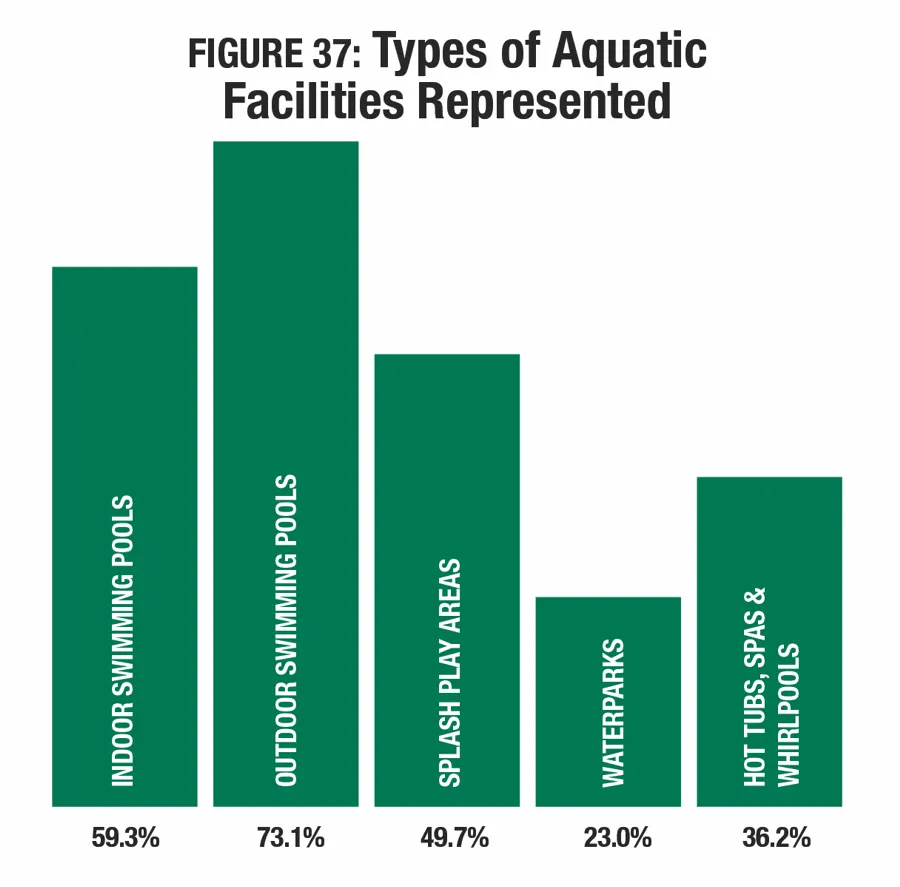
Slightly fewer indoor facilities are represented in the 2018 survey, compared with 2017. The most common type of aquatic facility found among respondents' facilities is outdoor swimming pools. Nearly three-quarters (73.1 percent) of aquatic respondents said they have at least one outdoor swimming pool. They were followed by indoor swimming pools, found among 59.3 percent of aquatic respondents, down from 64.8 percent in 2017. Nearly half (49.7 percent) said they have splash play areas. Another 36.2 percent have hot tubs, spas or whirlpools. And nearly a quarter (23 percent) of aquatic respondents said their facilities include waterparks. (See Figure 37.)
Outdoor swimming pools are most commonly found among aquatic respondents in the South Central and South Atlantic regions. Some 86.8 percent of South Central respondents and 80.8 percent of South Atlantic respondents said they have outdoor swimming pools. Aquatic respondents from the Midwest are the least likely to include outdoor swimming pools, though nearly two-thirds (65.3 percent) said they do have at least one outdoor pool. When considered by community type, respondents from the suburbs are the most likely to include outdoor pools, with 74.8 percent indicating that they include them in their facilities.
Indoor swimming pools are most commonly found in the Midwest and Northeast, with 65 percent of Midwestern respondents and 62.1 percent of Northeastern respondents reporting that they include indoor pools. Aquatic respondents in the West are the least likely to include indoor pools, though more than half (55.6 percent) said they have them. Indoor pools are more prominent in urban communities than the suburbs and rural areas, with 62.7 percent of aquatic respondents from urban communities reporting that they have indoor pools.
Splash play areas are most common in the West and the South Atlantic states. Some 58.5 percent of aquatic respondents in the West and 52.7 percent in the South Atlantic region said they currently include splash play. This amenity was least common in the Northeast, where 36.1 percent of aquatic respondents said they include splash play. Community-wise, splash play areas are more common in urban areas, with 57.3 percent of urban aquatic respondents indicating that they include at least one splash play area among their amenities.
Waterparks are most commonly found in the Midwest and the South Central states. Some 31.4 percent of aquatic respondents from the Midwest and 25.9 percent from the South Central states said they currently include waterparks. They are far less common in the Northeast, where only 7.1 percent of aquatic respondents said they have a waterpark. Community-wise, the suburbs are more likely to be home to a waterpark, with 26.2 percent of aquatic respondents from the suburbs indicating they include a waterpark.
Hot tubs, spas and whirlpools are most commonly found in the West, where 41.3 percent of aquatic respondents said they feature hot tubs. They were followed by the South Atlantic region, where 38.9 percent of aquatic respondents have hot tubs. The Northeast was least likely to be home to hot tubs, with 23.9 percent of aquatic respondents there reporting they have at least one. In terms of community type, suburban respondents are the most likely to include hot tubs, with 41.9 percent of aquatic respondents from the suburbs reporting that they include at least one hot tub, spa or whirlpool as part of their facilities.
Different types of aquatic amenities are typically more common among specific types of facilities. For example, indoor swimming pools are more commonly expected in college recreation facilities and YMCAs than they are at parks, whereas splash play areas are more commonly found in parks.
Outdoor swimming pools are most commonly found among camp respondents' facilities. Some 95.3 percent of aquatic respondents from camps said they have at least one outdoor pool. They were followed by parks (81.5 percent) and community recreation centers (75.6 percent).
Indoor swimming pools are most commonly found among colleges and universities, where 96.5 percent of aquatic respondents said they currently have at least one indoor pool. They were followed by health clubs (91.2 percent) and Ys (89.6 percent).
Aquatic respondents from parks were the most likely to report that they currently have at least one splash play area. Some 65.7 percent of aquatic respondents from parks said they have a splash play area (up from 57 percent in 2017). They were followed by community centers (55 percent).
Waterparks are rare among most facility types. Only parks respondents commonly include them. Nearly one-third (31.3 percent) of aquatic respondents from parks said they have at least one waterpark.
Hot tubs, spas and whirlpools are most commonly found in the facilities of aquatic respondents from health clubs. Some 79.4 percent of aquatic respondents from health clubs said their facilities include hot tubs. They were followed by Ys (55.9 percent) and community centers (54.5 percent).
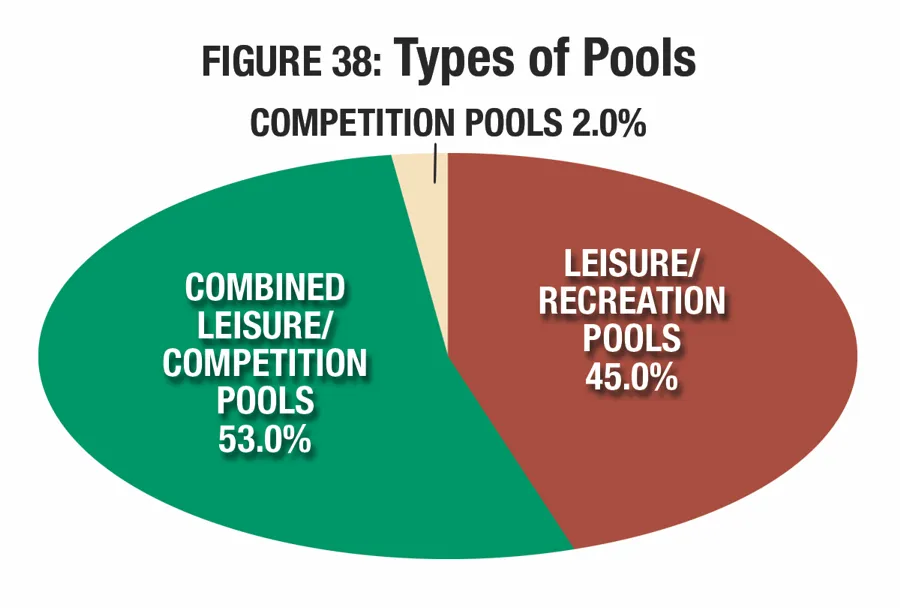
As usual, the majority of aquatic facilities covered by the report are used either for leisure and recreation, or for a combination of recreation and competition. Only 2 percent of respondents with aquatics said their pools are used for competition alone. More than half (53 percent) said their aquatic facilities are home to both recreational activities and competitive swimming. And 45 percent said their pools are used only for recreation and leisure. (See Figure 38.)
Pools used only for leisure and recreation are most commonly found among respondents from camps. Some 93.2 percent of camp respondents with aquatics said their pools are used only for leisure and recreation. They were followed by health clubs (64.7 percent) and parks (40.3 percent). Aquatic respondents from schools are the least likely to have recreation-only pools, with just 12.5 percent of school respondents indicating their pools are used for this purpose.
Conversely, competition-only pools are most prevalent among school respondents. While few aquatic respondents overall said their pools are used for competition only, among schools, more than a quarter (25.8 percent) of aquatic respondents use their pools only for competition. They were followed by community centers, though only 6.6 percent of these respondents said their pools are used for competition only. No health club, Y or camp respondents have competition-only pools.
Combination pools, used for both recreation and competition, are most commonly found among aquatic respondents from colleges and universities. Some 68.9 percent of these respondents said they had combined leisure and competition pools. They were followed by Ys (61.3 percent) and schools (61.3 percent).
Pools & Budgets
From 2015 to 2017, and from 2017 to 2019, respondents whose facilities include aquatics report smaller increases in overall operating expenses, when compared with respondents who have no aquatic elements. From 2015 to 2017, aquatic respondents' overall operating expenses grew by 3.6 percent, from $2,229,000 to $2,310,000. This compares with a 5.9 percent increase for respondents without aquatics, whose expenses grew from $1,171,000 to $1,240,000.
Looking forward, aquatic respondents expect their overall operating costs to grow by 6.9 percent from 2017 to 2019, to an average of $2,470,000. This compares with a 7.3 percent increase for respondents without aquatics, whose expenses will grow to an average of $1,330,000.
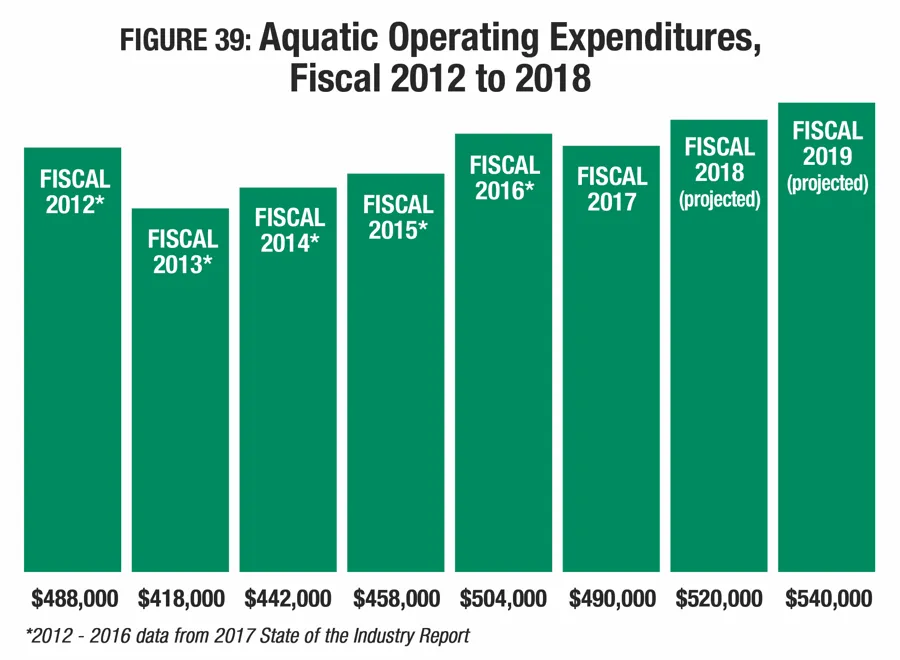
The average operating expense for aquatics only increased at a faster rate from 2015 to 2017 than the overall operating budget, and from 2017 to 2019, it is expected to increase at a faster rate as well. Aquatic operating expenses grew 7 percent from 2015 to 2017, from an average of $458,000 to $490,000. From 2017 to 2019, aquatic operating expenses are expected to grow a further 10.2 percent, to an average of $540,000. (See Figure 39.)
Respondents from community centers reported the highest average aquatic operating expense for 2017, at $650,000. They were followed by aquatic respondents from parks ($600,000), schools ($450,000), health clubs ($450,000) and colleges and universities ($320,000). Respondents from camps have the lowest average aquatic operating expense in 2017, at $170,000, followed by Ys ($280,000).
From 2017 to 2019, respondents from health clubs reported the highest growth rate for aquatic operating expenses. Health club respondents with aquatics project that their aquatic operating expenses will grow by 53.3 percent to a total of $690,000 in 2019. Also expecting higher growth rates are respondents from Ys (up 14.3 percent, to $320,000) and parks (up 10 percent, to $660,000). More modest increases were expected among other facility types, with camps expecting a 5.9 percent increase (to $180,000), community centers and colleges expecting a 3.1 percent increase (to $670,000 and $330,000, respectively), and schools expecting a 2.2 percent increase (to $460,000) from 2017 to 2019.
More than a quarter (27.1 percent) of aquatic respondents said their revenues for aquatics only increased from 2016 to 2017, down from 32 percent who reported an increase from 2015 to 2016. At the same time, the number of aquatic respondents whose aquatic revenues decreased rose from 10.2 percent reporting a decrease from 2015 to 2016, to 12.1 percent reporting a decrease from 2016 to 2017.
Looking forward, the percentage of aquatic respondents who expect their revenues to grow year-over-year increases slightly, while the percentage projecting a decrease falls slightly. From 2017 to 2018, 33.3 percent of aquatic respondents expect revenues to increase, and 7.1 percent expect a decrease. From 2018 to 2019, 33.5 percent expect aquatic revenues to rise, while 5.3 percent expect them to fall.
From 2016 to 2017, aquatic respondents from health clubs were the most likely to report that their aquatic revenues increased. Some 37.5 percent of health club respondents said aquatic revenues increased from 2016 to 2017. They were followed by parks, 32.9 percent of whom saw an increase, and community recreation centers, 27.1 percent of whom reported an increase. Schools were the least likely to report an increase to aquatic revenues from 2016 to 2017. Only 6.5 percent of schools said revenues increased in that time frame.
Looking forward, respondents from health clubs, community recreation centers and parks are the most likely to be expecting further increases to their aquatic revenues. Among aquatic respondents, from 2017 to 2018, 42.4 percent of health clubs, 41.4 percent of community centers and 38.5 percent of parks expect aquatic revenues to increase. And from 2018 to 2019, 41.9 percent of health clubs, 40.4 percent of community centers and 37.6 percent of parks expect an increase.
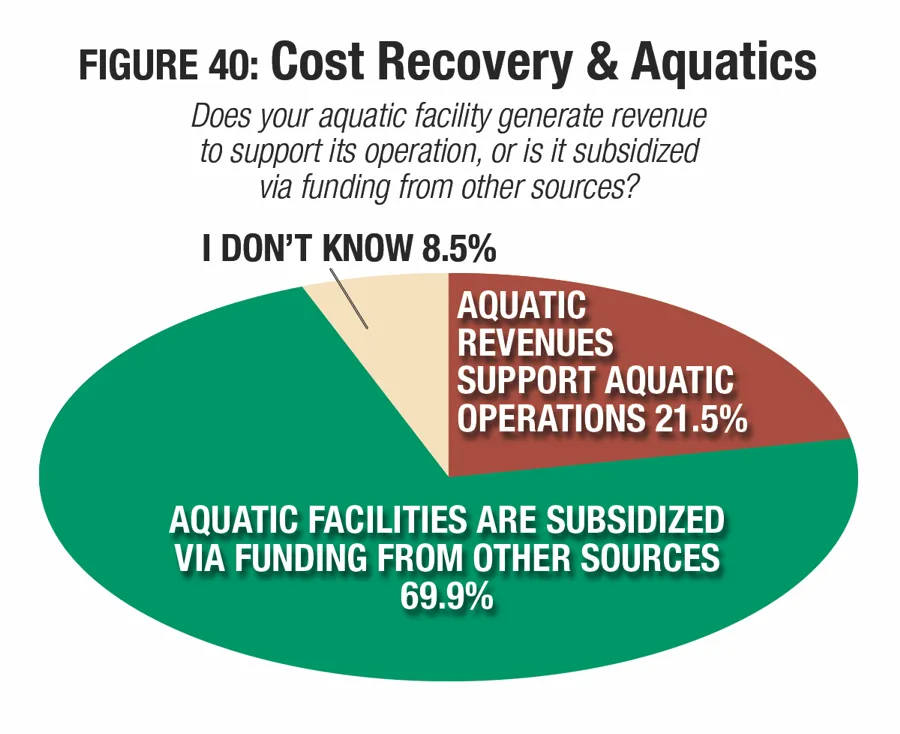
The percentage of aquatic respondents who report that their aquatic revenues support aquatic operations remained virtually unchanged from 2017 to 2018. More than one-fifth (21.5 percent) of aquatic respondents said their aquatic facilities generate the revenue to support operations, and 69.9 percent said aquatic facilities are subsidized via funding from other sources. (See Figure 40.)
Respondents from private, for-profit organizations were the most likely to report that they are able to support their aquatic operations with revenues from their aquatic facilities. Some 29 percent of for-profit respondents with aquatics said their aquatic facilities are supported via revenues, while 55.1 percent said aquatic operations are subsidized with funding from other sources.
Public and private nonprofit organizations are much more likely to rely on other funding to subsidize aquatic operations. Some 21 percent of nonprofits and 20.1 percent of public organizations said their aquatic operations are supported via revenues, while 70.8 percent of nonprofits and 72.4 percent of public organizations said aquatic operations are subsidized via funding from other sources.
Respondents from Ys were the most likely to report that they earn their aquatic operating costs back via aquatic revenues. Some 29.4 percent of Y respondents with aquatics said they cover their aquatic operating costs with revenues. They were followed by health clubs (25.7 percent of whom cover their aquatic operating costs with revenues) and community recreation centers (22.6 percent).
Respondents from camps, colleges and parks are the most likely to subsidize their aquatic operations with funding from other sources. Some 81.8 percent of camp respondents, 76.7 percent of college respondents and 70.5 percent of park respondents with aquatics said they cover some of the cost of their aquatic operating expenses with funding from other sources.
Programming
The majority of aquatic respondents reported that they currently provide programming at their aquatic facilities, from swim lessons and lap swimming to lifeguard training and more. Some 95.9 percent of aquatic respondents said they provide aquatic programming. This includes 100 percent of aquatic respondents from Ys and from colleges and universities. Community recreation centers are the second most likely to include aquatic programs, with 98.4 percent of these respondents indicating that they include them at their aquatic facilities. They were followed by health clubs (97.1 percent include aquatic programs), schools (96.9 percent) and parks (95.2 percent). Camp respondents are the least likely to provide aquatic programming, though a majority—86.7 percent—said they do include such programs.
The top 10 aquatic programs currently found at aquatic facilities changed very little from 2017. They include:
- Leisure swim (currently found at 88.3 percent of aquatic facilities)
- Learn-to-swim for children (82.6 percent)
- Lap swim (76.8 percent)
- Lifeguard training (74.7 percent)
- Aquatic exercise programs (67.6 percent)
- Learn-to-swim for adults (60.5 percent)
- Water safety programs (60.5 percent)
- Youth swim teams (56.3 percent)
- Swim meets and competitions (49.8 percent)
- Special needs aquatics programs (36.1 percent)
Programs that saw an increase of at least 2 percentage points in the number of respondents providing them include: lifeguard training (up 3.4, from 71.3 percent); and learn-to-swim for children (up 2.1, from 80.5 percent).
Aquatic respondents from Ys are more likely than others to provide learn-to-swim programs for children, learn-to-swim programs for adults, special needs aquatics programs, leisure swim, water safety programs and lifeguard training.
Aquatic respondents from schools and school districts are more likely than others to provide youth swim teams, school or collegiate swim teams, swim meets and competitions, and diving or diving teams.
Aquatic respondents from health clubs are more likely than others to offer aquatic exercise programs, lap swimming, and aqua-therapy programs.
Finally, aquatic respondents from colleges and universities are more likely than those from other types of facilities to provide adult swim teams and water polo programs.
The percentage of aquatic respondents who plan to add new programs at their facilities over the next few years grew from 18.3 percent in 2017 to 19.6 percent in 2018.
Aquatic respondents from community recreation centers are the most likely to be planning to add aquatic programs at their facilities. Some 25.8 percent of community centers with aquatics have such plans. They were followed by health clubs (22.9 percent), Ys (20.6 percent), parks (20.5 percent), schools (18.2 percent), and colleges and universities (17.8 percent). Respondents from camps were the least likely to report that they have plans to add aquatic programs, with 13.3 percent indicating they would do so.
The top 10 planned program additions include:
- Special needs aquatic programs (planned by 33.1 percent of those who will be adding programs)
- Aquatic exercise programs (25.8 percent)
- Learn-to-swim for adults (23.9 percent)
- Aqua-therapy programs (20.2 percent)
- Water safety programs (17.8 percent)
- Adult swim teams (17.2 percent)
- Learn-to-swim for children (16 percent)
- Lifeguard training (15.3 percent)
- Youth swim teams (12.9 percent)
- Water polo (11.7 percent)
Aquatic respondents from schools are more likely than other facilities to be planning to add learn-to-swim programs for children, learn-to-swim programs for adults, adult swim teams, school and collegiate swim teams, aquatic exercise programs, and leisure swim.
Aquatic respondents from community recreation centers are more likely than other facilities to be planning to add special needs aquatic programs, lap swim, diving and diving teams, and water polo.
Aquatic respondents from health clubs are more likely than those from other types of facilities to be planning to add aqua-therapy, water safety programs and lifeguard training.
Finally, aquatic respondents from Ys are more likely than others to be planning to add youth swim teams and swim meets and competitions.
Facility Enhancements
The percentage of aquatic respondents with plans to build new facilities or make additions or renovations to existing facilities changed little from 2017 to 2018. While 71.6 percent of aquatic respondents in 2017 had plans for construction, in 2018, that number grew slightly to 71.8 percent. Aquatic respondents are more likely than those without aquatics to be planning constriction. Just over two-thirds (67 percent) of non-aquatic respondents said they have plans for construction.
Aquatic respondents are more likely than those without aquatics to be planning changes at existing facilities, while those without aquatics are more likely to be planning new construction. More than half (54.3 percent) of aquatic respondents are planning renovations and 31.4 percent are planning additions, compared with 47.4 percent and 26.9 percent of non-aquatic respondents, respectively. And while 28.4 percent of non-aquatic respondents are planning to build new, 27.8 percent of aquatic respondents are planning new construction.
Aquatic respondents' average budget for construction decreased by 3.1 percent from 2017 to 2018. In 2017, aquatic respondents were planning to spend an average of $4,776,000, while 2018 respondents are planning to spend $4,630,000. This is still 19.3 percent higher than the average construction budget for non-aquatic respondents in 2018, at $3,880,000.
The top 10 aquatic features covered by the survey that are most commonly found among aquatic respondents' facilities include:
- Automatic chemical feeders (found among 73 percent of aquatic respondents' facilities)
- Pool lifts and accessibility equipment (69.2 percent)
- Diving boards (47 percent)
- Zero-depth entry (41.2 percent)
- Waterslides (39.4 percent)
- Water play structures (36 percent)
- Splash pads (24.7 percent)
- UV disinfection systems (22.7 percent)
- Lazy rivers (13 percent)
- Poolside cabanas (12.8 percent)
Aquatic respondents from park facilities are more likely than others to include: zero-depth entry, waterslides, water play structures, splash pads, surf simulators and wave pools.
Aquatic respondents from community centers are more likely than others to include lazy rivers, UV disinfection, automatic chemical feeders, and pool lifts.
Aquatic respondents from schools are more likely than others to have diving boards and solar pool heating, while those from health clubs are more likely to have saline chlorination systems and poolside cabanas. Those from colleges are the most likely to use ozone systems.
More than a quarter (26.5 percent) of aquatic respondents said they have plans to add more features at their facilities over the next few years, up from 25 percent in 2017. Aquatic respondents from camps are the most likely to be planning such additions. Some 37.8 percent of aquatic respondents from camps said they will be adding features. They were followed by aquatic respondents from health clubs (28.6 percent), parks (28 percent), schools (27.3 percent), community centers (25.8 percent) and Ys (16.2 percent). Aquatic respondents from colleges are the least likely to be planning to add features, though the percentage with plans grew from 10.1 percent in 2017 to 15.6 percent in 2018.
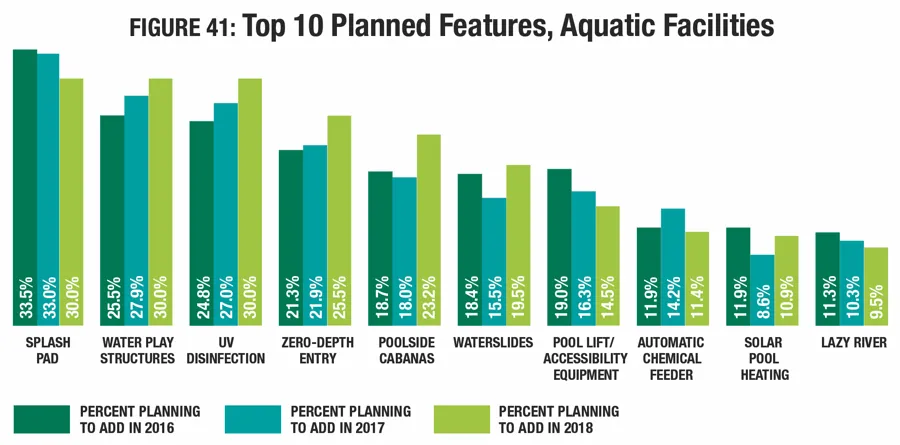
The most commonly planned additions in 2018 include splash pads (30 percent of aquatic respondents with plans to add features will add splash pads); water play structures (30 percent); and UV disinfection (30 percent). More respondents in 2018 than in 2017 are planning to add: water play structures (30 percent vs. 27.9 percent); UV disinfection (30 percent vs. 27 percent); zero-depth entry (25.5 percent vs. 21.9 percent); poolside cabanas (23.2 percent vs. 18 percent); waterslides (19.5 percent vs. 15.5 percent); and solar pool heating (10.9 percent vs. 8.6 percent). (See Figure 41.)
Aquatic respondents from camps are more likely than those from other types of facilities to be planning to add zero-depth entry, waterslides, solar pool heating, poolside cabanas, splash pads, surf machines and wave pools.
Aquatic respondents from health clubs are more likely than others to be planning to add lazy rivers, diving boards and saline chlorination systems.
Aquatic respondents from schools are more likely than others to be planning to add UV disinfection systems and pool lifts and accessibility equipment.
Aquatic respondents from community centers are more likely than others to be planning to add water play structures and automatic chemical feeders.
Finally, aquatic respondents from Ys are more likely than others to be planning to add ozone systems.
Lighten Up
UV disinfection has been growing in popularity as aplanned addition at aquatic facilities over the past severalyears, largely driven by its ability not only to act as asecondary disinfection system, preventing chlorine-resistantpathogens from infecting the pool’s water, but alsobecause it helps prevent chloramines, making the air inindoor aquatic facilities healthier to breathe.
In 2016, 24.8 percent of respondents said they wereplanning to add UV disinfection systems at their facilities.This year, that number grew to 30 percent.