


Our 11th Annual Salary Survey

The U.S. unemployment rate has continued to drop over the past year, reaching a new low of 3.9 percent in April 2018, its lowest point since the year 2000. Meanwhile, median household income reached an all-time high of $59,039 in 2016, according to a report from the U.S. Census Bureau. The overall employment outlook is good, and respondents to our Salary Survey continue to be overwhelmingly positive about their careers and continue to report salary increases, overall.
This year, nearly 1,600 professionals working in the recreation, sports and fitness industry responded to the annual Industry Report survey, and the findings are once again positive in terms of salary. Average salaries among survey respondents rose 1.5 percent from 2017 to 2018, and job satisfaction continues to be positive among respondents.
Welcome to the 11th annual Recreation Management Salary Survey. Over the following pages, we'll provide an up-close view of what respondents to the survey reported about their salaries, careers and more.
Who Are You?
Careers in recreation, sports and fitness facility management are wide-ranging, with a diverse cast of characters serving in a myriad of job roles. That said, the "average" respondent to the annual survey is a nearly-50-year-old white male with a bachelor's degree, working as a director of a parks and recreation organization in the Midwestern suburbs, earning $69,420 a year.
Some 31.9 percent of respondents are from the Midwest, the largest region represented in the survey. They were followed by the West (21.4 percent), the Northeast (18 percent), the South Atlantic states (16.5 percent) and the South Central region (12.1 percent). Another 0.1 percent of respondents reported from outside the United States.
Some 43.4 percent of respondents said they are located in suburban communities. More than one-third (35.7 percent) are located in rural areas, and 20.9 percent are found in urban communities.
Nearly two-thirds (65.7 percent) of respondents work for public organizations. Another 19.9 percent said they are with private nonprofit organizations, and 9.3 percent work with private, for-profit facilities. Some 5.1 percent of respondents work for "other" types of organizations.
When it comes to the type of facility respondents work for, the largest number—40.6 percent—said they are with park and recreation districts and departments. Other more common facility types represented by survey respondents include: schools and school districts (12.7 percent); colleges and universities (10.8 percent); community or private recreation and sports centers (6.7 percent); campgrounds, RV parks, and private or youth camps (5.4 percent); YMCAs, YWCAs, JCCs and Boys & Girls Clubs (5.1 percent); and sports, health or fitness clubs and medical fitness facilities (4.2 percent). Other facility types that are home to smaller numbers of respondents include: golf and country clubs (2.3 percent); resorts and resort hotels (1.6 percent); waterparks, theme parks and amusement parks (1.4 percent); racquet or tennis clubs (0.8 percent); homeowners associations (0.6 percent); ice rinks (0.6 percent); military installations (0.5 percent); churches (0.4 percent); corporate recreation or sports centers (0.3 percent); and stadiums, arenas and tracks (0.1 percent). Another 6 percent of respondents said they work for other types of facilities.
The largest age group represented by survey respondents falls between 50 and 59 years. More than one-third (34.6 percent) of respondents said they are between 50 and 59 years old. They were followed by respondents between the ages of 40 and 49 (24.4 percent), 30 and 39 (16.4 percent) and 60 and 64 (15.3 percent). Just 5 percent of respondents said they are 65 or older, and 4.3 percent are 30 or younger.
Some 63.2 percent of respondents are male, and 36.8 percent are female. The survey audience is also predominantly white, with 90.1 percent of respondents identifying as such. Another 4.2 percent are black/non-Hispanic, while 3.3 percent are Hispanic, 1 percent as Asian/Pacific Islanders, 1 percent are Native American or Alaskan Natives, and the rest are of "other" or "unknown" ethnicity.
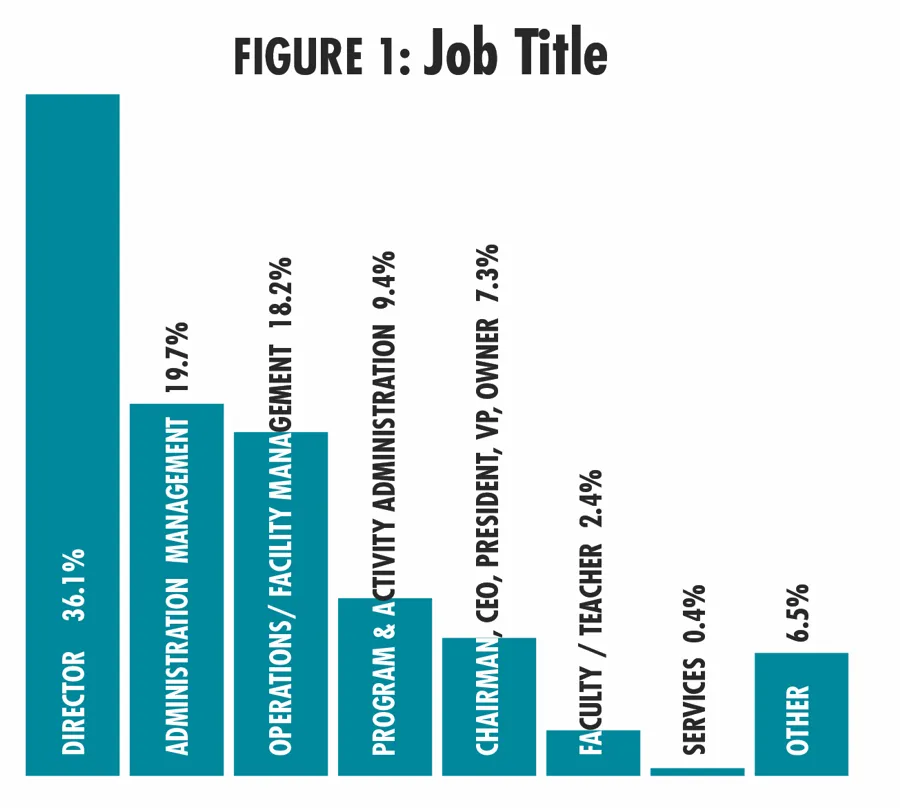
When it comes to the job titles held by survey respondents, a majority hold leadership positions, as is the case with the readership of Recreation Management. Well over a third (36.1 percent) hold the title of "director." Another 19.7 percent are in administration management, which includes job titles such as administrator, manager or superintendent. Some 18.2 percent of respondents are in operations and facility management, including such titles as operations managers, facility managers, building managers and supervisors. Nearly one in 10 (9.4 percent) are in program and activity administration, including activity or program directors, managers, coordinators, specialists, coaches and instructors. Another 7.3 percent of respondents are the chairman, CEO, vice president or owner of their organizations. Some 2.4 percent are faculty or teachers, and 0.4 percent are in services, which includes planners, designers, architects and consultants. Finally, 6.5 percent said they were in "other," unspecified job roles. (See Figure 1.)
Education & Experience
Respondents to the survey tend to have attained much higher levels of educational achievement than the average American citizen. The U.S. Census Bureau reported in 2017 that 33.4 percent of Americans 25 or older had earned at least a bachelor's degree. Among survey respondents, 78.6 percent have earned a bachelor's degree or higher. Some 44.3 percent said they have earned a bachelor's degree, while 32.3 percent have earned a master's degree. Some 2 percent have earned an advanced degree or Ph.D. Another 12.7 percent of respondents said they have attended college without earning a degree, and 5.1 percent have earned a two-year, or associate's degree. Another 3.6 percent have a high school diploma.
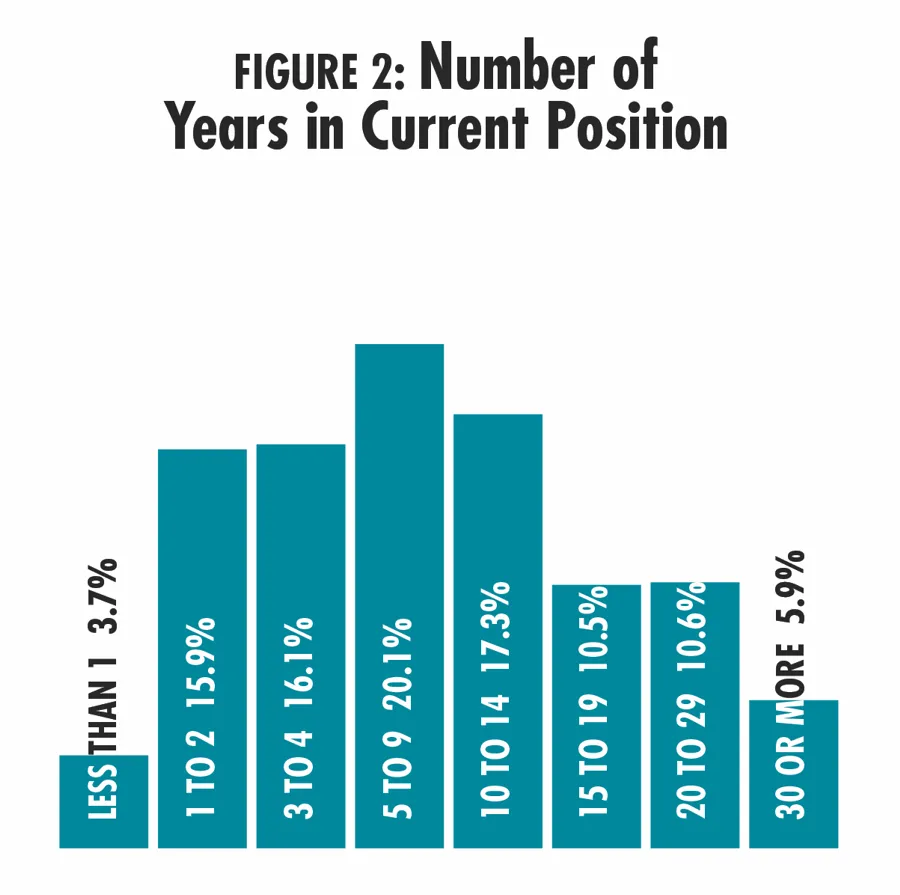
On average, respondents have been working in their current position for 11.2 years. Some 44.3 percent of respondents said they have been in their current position for at least 10 years, with 16.5 percent indicating they've been in their current jobs for at least 20 years. Just over a fifth (20.1 percent) said they have been in their current position for five to nine years, and 35.7 percent have been in their current jobs for less than five years. (See Figure 2.)
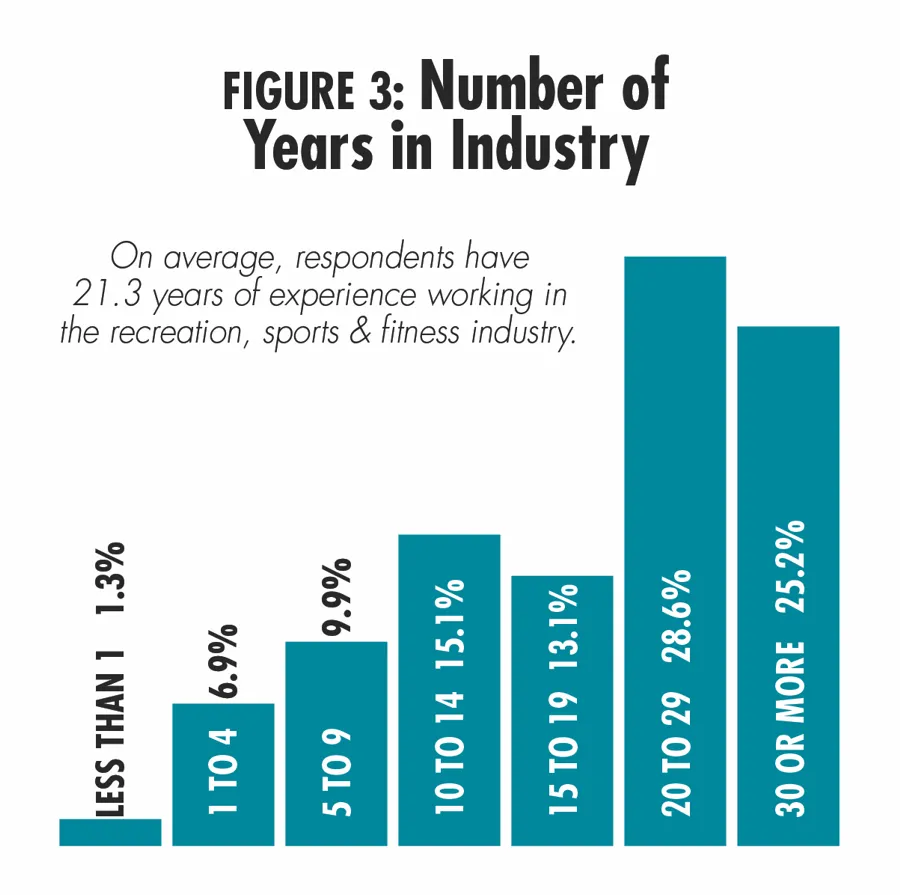
On average, respondents have been working in the recreation, sports and fitness industry for 21.3 years. More than half (53.8 percent) said they have been working in the industry for at least 20 years, and 25.2 percent have been in the industry for 30 years or more. Those with less than 10 years of industry experience make up 18.1 percent of the survey population. (See Figure 3.)
Show Me the Money
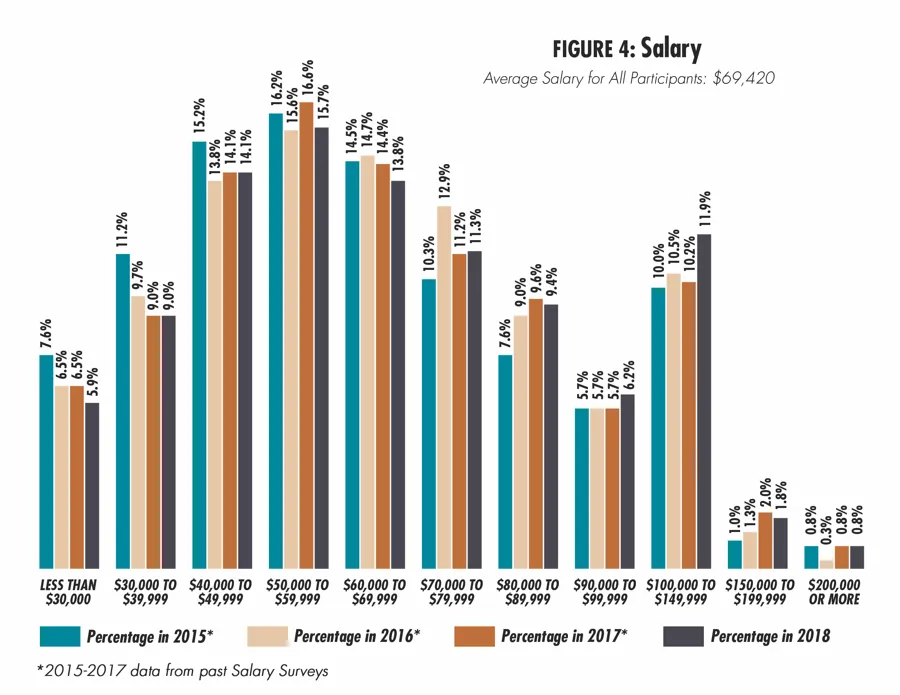
Last year's salary survey showed a 1.6 percent increase in the average salary over 2016. In 2018, the average salary is up 1.5 percent from 2017, to $69,420.
The percentage of respondents who said they earn more than $100,000 increased from 13 percent in 2017 to 14.5 percent in 2018. The percentage of respondents who said they earn a salary between $50,000 and $100,000 fell slightly, from 57.5 percent in 2017 to 56.4 percent in 2018. The percentage of respondents who earn less than $50,000 also fell slightly, from 29.6 percent in 2017 to 29 percent in 2018. (See Figure 4.)
While overall, respondents reported a 1.5 percent increase in average salary from 2017 to 2018, some industry segments saw higher increases, and others reported dropping salaries. The sharpest increase was reported by respondents from colleges and universities, who reported that their average salary rose 11.7 percent from 2017 to 2018. They were followed by golf and country clubs, with a 9.4 percent increase. Also reporting higher-than-average increases to salary were respondents from community centers (up 5.7 percent), health clubs (up 3.9 percent) and camps (up 3 percent). Parks respondents reported a much more modest, 0.7 percent increase. (See Figure 5.)
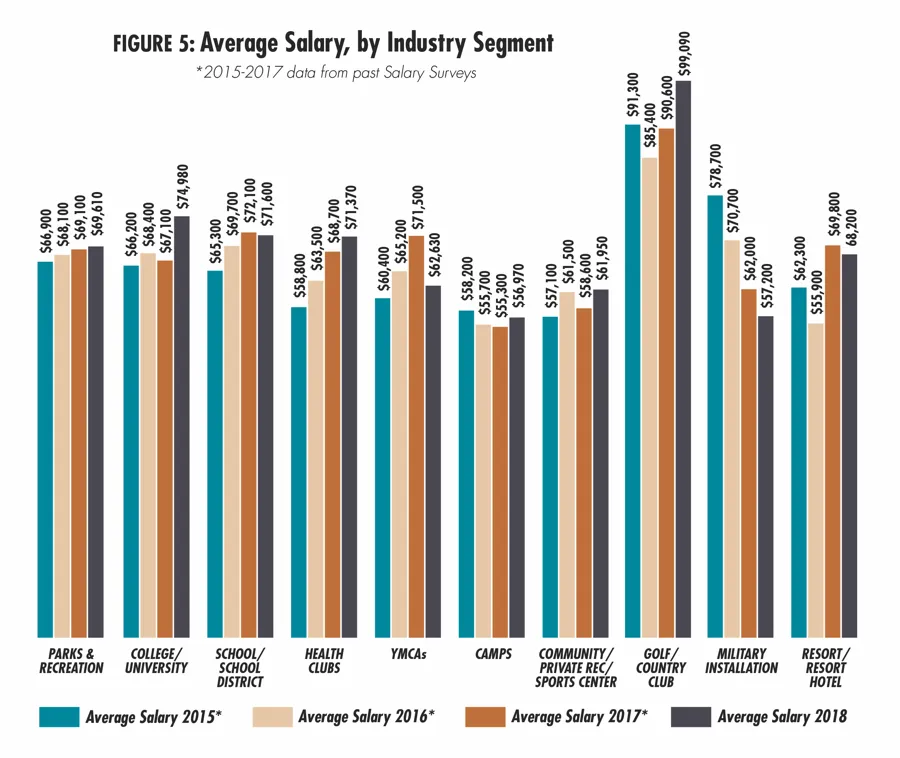
Some industry segments reported a decrease to average salaries from 2017 to 2018. The sharpest decrease was seen among respondents from Ys, whose average salaries fell 12.4 percent. Other industry segments reporting decreases include: military installations (down 7.7 percent), resorts and resorts hotels (down 2.3 percent) and schools and school districts (down 0.7 percent).
Respondents in the Northeast continue to be the highest earners, with an average salary in 2018 of $75,520, 8.8 percent higher than the average for all respondents. They are followed by those in the West, with an average salary of $74,200, the South at $67,690, and the Midwest at $64,410. (See Figure 6.)
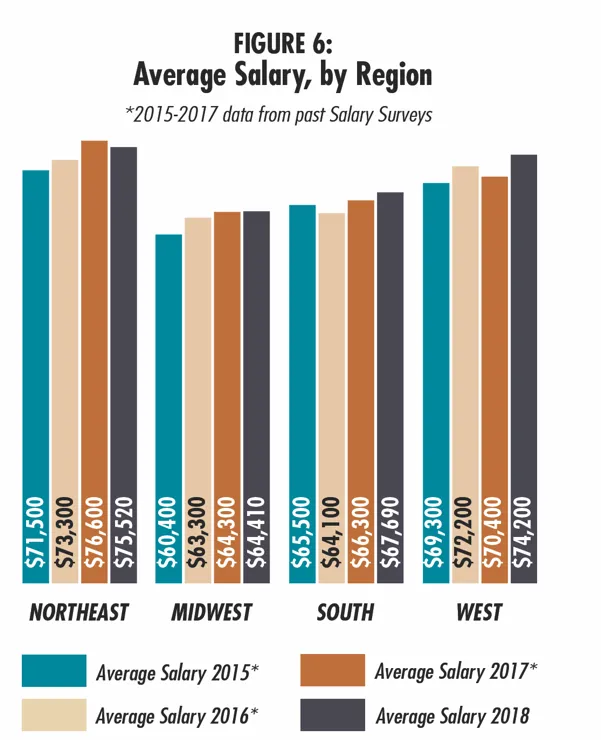
Respondents from the West reported the greatest increase to their salaries from 2017 to 2018, with a 5.4 percent increase. They were followed by respondents in the South, who saw a 2.1 percent increase to their average salary. Respondents in the Midwest reported virtually no change to average salary from 2017 to 2018, with a modest 0.2 percent increase. And respondents in the Northeast reported a 1.4 percent decrease to their average salary in this time frame.
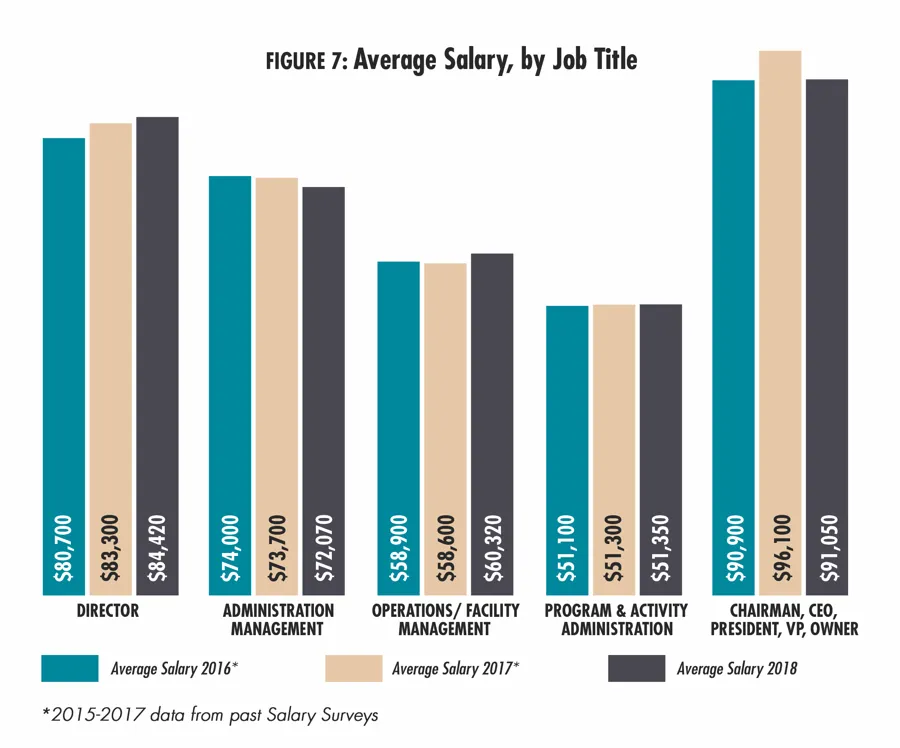
As usual, respondents who are the chairman, CEO, president, vice president or owner of their organization reported the highest average salary, earning 31.2 percent more than the average for all respondents. That said, these respondents reported the greatest decrease to their average salary from 2017 to 2018, with a 5.3 percent drop to $91,050. Respondents in administration management also reported a decrease, with average salary falling 2.2 percent to $72,070 in 2018. The greatest increase was seen by respondents in operations and facility management, who saw their salaries rise 2.9 percent to an average of $60,320. They were followed by directors, with a 1.3 percent increase to an average of $84,420. Respondents in program and activity administration reported virtually no change to their average salary, with a mere 0.1 percent increase from 2017 to an average of $51,350 in 2018. (See Figure 7.)
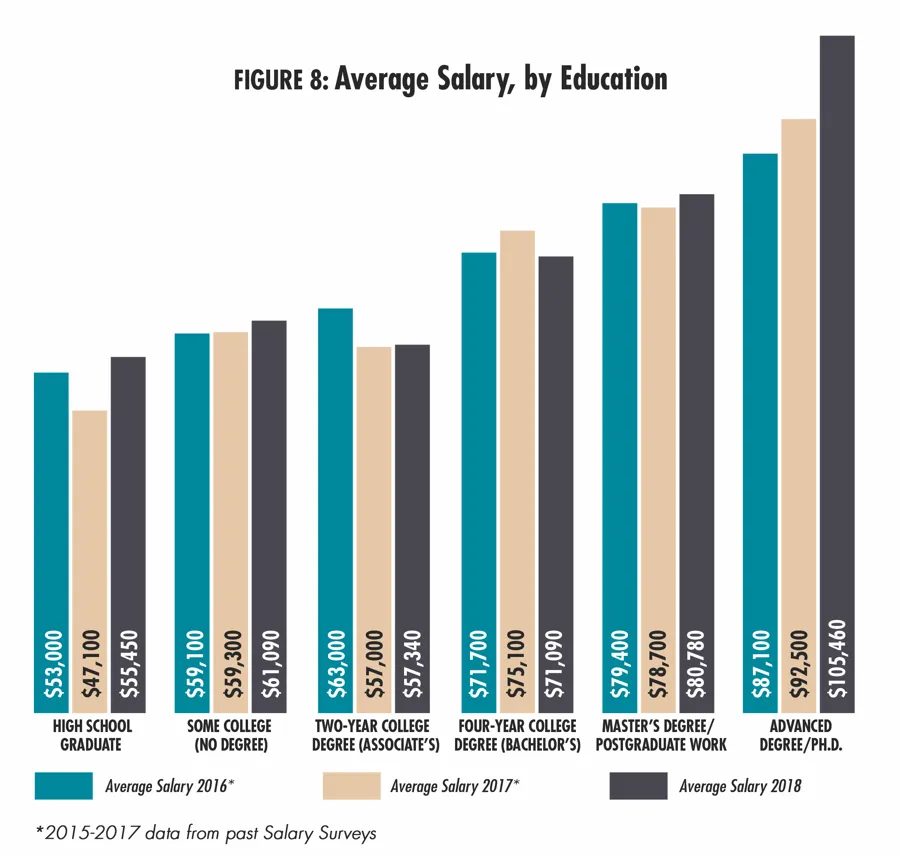
Typically, respondents with higher levels of education tend to report higher average salaries, and 2018 is no exception. Respondents with advanced degrees reported an average salary that is 51.9 percent higher than the average for all respondents. That said, the greatest increase to average salary was reported by high school graduates, who saw a 17.7 percent increase from 2017 to 2018. They were followed by those with advanced degrees (up 14 percent). Smaller increases were seen among those with some college but no degree (up 3 percent), those with a master's degree or other postgraduate work (up 2.6 percent), and those with an associate's degree (up 0.6 percent). Respondents with bachelor's degrees reported a 5.3 percent decrease to their average salary from 2017 to 2018. (See Figure 8.)
Over the past few years, the number of respondents who have reported increases to their salaries has been on the rise. While 57.4 percent of respondents said their salaries increased from 2015 to 2016, 59.8 percent reported an increase from 2016 to 2017. Another 33.6 percent said their salaries did not change from 2016 to 2017, and 6.6 percent reported a decrease. (See Figure 9.)
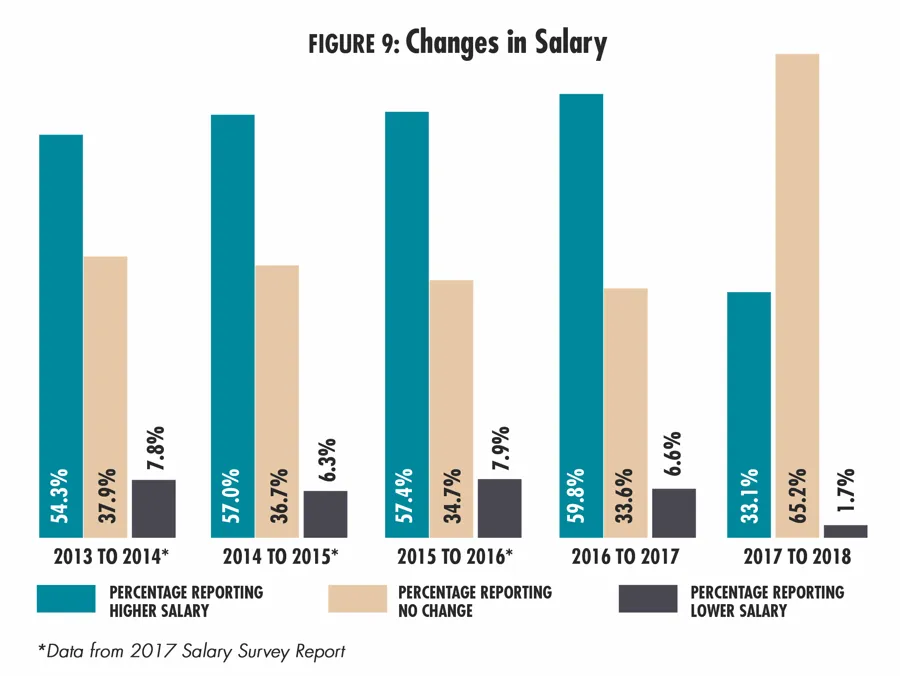
Typically, the percentage of respondents who expect their salaries to increase in the year the survey is taken tend to be much lower than the percentage who end up seeing an increase. (No one wants to put the cart before the horse.) For example, only 31 percent of respondents to the 2017 survey said they expected to see an increase in 2017. This year, 33.1 percent of respondents said they expect their salaries will increase from 2017 to 2018, a number that will be substantially higher when we take responses again in 2019, if the trend holds.
Respondents from community centers were the most likely to report that their salaries had increased from 2016 to 2017, with 67.3 percent indicating they'd seen an increase in that time period. They were followed by parks respondents, with a 65.8 percent increase, and schools, with a 59.5 percent increase. Respondents from health clubs were the least likely to see salaries go up in that time frame, though nearly half (48.5 percent) said their salaries had risen. (See Figure 10.)
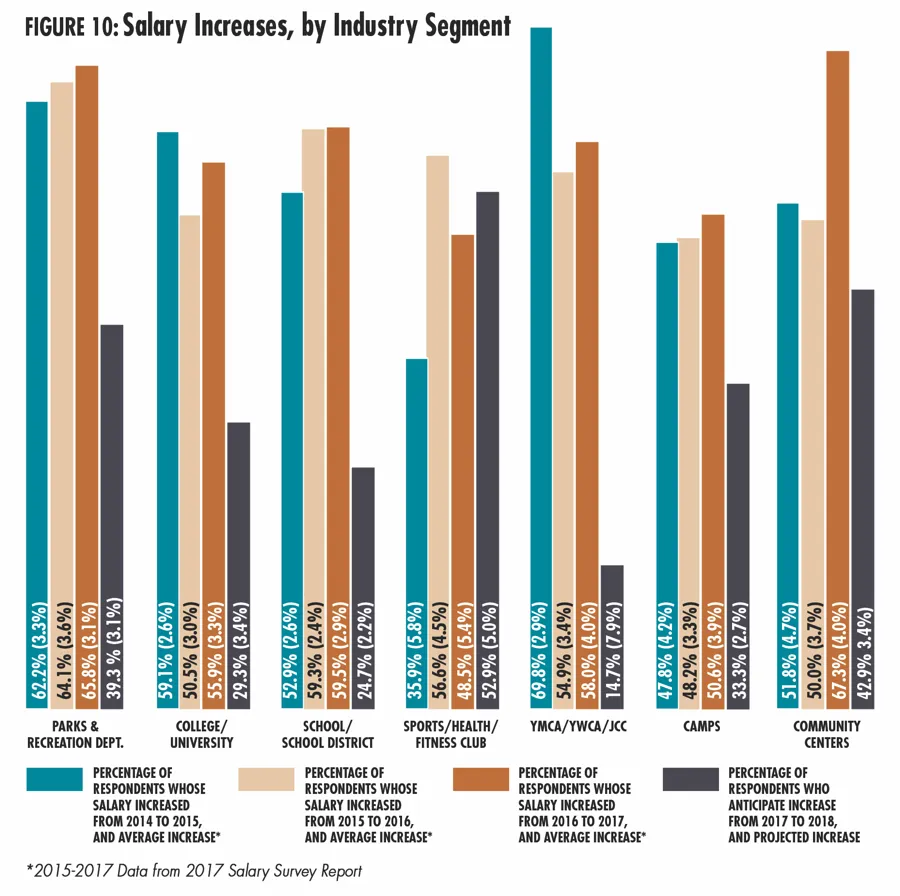
Looking ahead, respondents from health clubs are the most likely to be expecting a salary increase in 2018, with 52.9 percent reporting they expect an increase. They were followed by community centers, where 42.9 percent of respondents expect an increase. Respondents from Ys were the least likely to be expecting an increase in 2018.
Working Hard and Loving It
Well over half (60.6 percent) of respondents said that they work a fairly typical number of hours in a week, between 40 and 49. But almost a quarter (23.5 percent) said they work 50 to 59 hours a week, and 8.5 percent are working 60 hours or more.
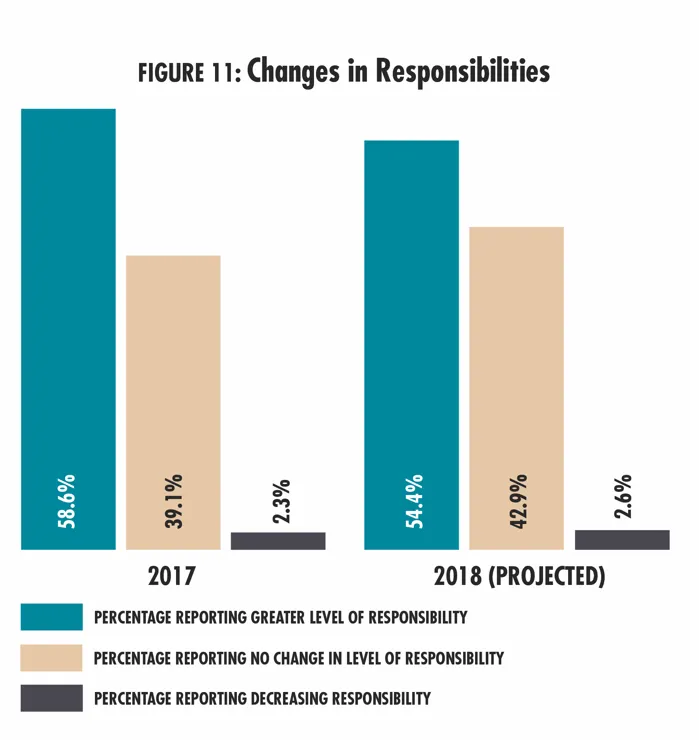
The percentage of respondents who said their level of responsibility is increasing year-over-year fell slightly in 2017. While 61.5 percent of respondents last year said their responsibilities had increased in 2016, this year, 58.6 percent reported their level of responsibility increased in 2017. Looking forward, slightly fewer (54.4 percent) said they expect their level of responsibility will grow in 2018. (See Figure 11.)
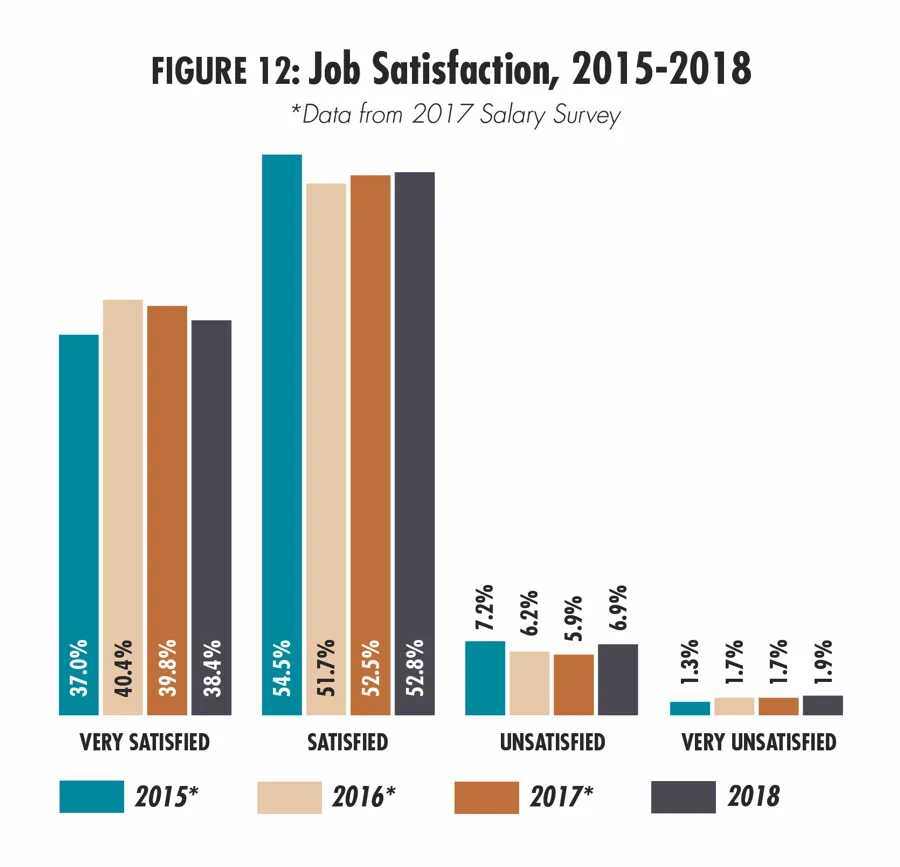
Finally, most respondents continue to be satisfied with their work. As has been the case in every year since we've been asking respondents about their salaries and careers, the vast majority of respondents report that they are either satisfied (52.8 percent) or very satisfied (38.4 percent) with their work. (See Figure 12.)
Survey Methodology
This report is based on a survey conducted for Recreation Management by Signet Research Inc., an independent research company. An e-mail was broadcast and respondents were invited to participate. From the launch of the survey on Jan. 30, 2018, to the closing of the survey on Feb. 26, 2018, 1,581 returns were received. The findings of this survey may be accepted as accurate, at a 95 percent confidence level, within a sampling tolerance of approximately +/- 2.5 percent
