


Our 13th Annual Salary Survey

Over the past decade, our Salary Survey has shown a fairly steady upward trend, with salaries increasing 15.4% between 2010 and 2020. That said, we know that COVID-19, with its dramatic effect on employment numbers across the country, is likely to have an impact on the careers of professionals in recreation, sports and fitness, too. It simply might be too early to tell how much of an impact.
For our 2020 Salary Survey, more than 1,300 professionals working in the recreation, sports and fitness industry responded to the annual questionnaire, sent in late January 2020. We followed up that survey with a COVID-19 Update Survey in early May. This briefer survey aimed to measure the immediate impact of measures taken in light of the pandemic. Given the extreme level of uncertainty at that time, we kept the questions minimal. Next January, when we follow up with our next Industry Report Survey, we will get a much clearer picture of the impact of the pandemic on careers in recreation, sports and fitness.
In the meantime, welcome to Recreation Management's 13th Annual Salary Survey. In these pages, we'll focus on what respondents to the Industry Report Survey had to say about their salaries, experience, careers and expectations.
Survey Methodology
| | | | | | | | | | | | | | | | | | | | | | | | | | | | | | | | | | | | | | | | | | | | | | | | | | | | | | | | | | | | | | | | | | | | | | | | | | | | | | | | | | | | | | | | | | | | | | | | | | | | | | | | | | | | | | | | | | | | | | | | | | | | | | | | | | | | | | | | | | | | | | | | | | |
This report is based on a survey conducted for Recreation Management by Signet Research Inc., an independent research company. An email was broadcast and respondents were invited to participate. From the launch of the survey on Jan. 17, 2020, to the closing of the survey on Feb. 3, 2020, 1,307 returns were received. The findings of this survey may be accepted as accurate, at a 95% confidence level, within a sampling tolerance of approximately +/- 2.7%.
A follow-up survey was conducted independently to gather clarifying information in light of the COVID-19 epidemic. From the launch of the survey on May 1, 2020, to the closing of the survey on May 11, 2020, 576 returns were received.
About the Respondents
There's a wide range of career paths for those involved in recreation, sports and fitness, from park district directors and aquatic center managers to athletic directors, sports club owners and so much more. All of the ways that people recreate, get fit and engage in sports and other community activities take a vast cast of characters with a broad range of ideas and experiences to get the job done effectively. Let's take a look at some of the characteristics of the Salary Survey respondents.
Three out of 10 (30%) respondents were from the Midwest, the largest region represented in the survey, by number of respondents. They were followed by the West (22.3%), the South Atlantic (19.6%), the Northeast (15.3%) and the South Central region (12.6%). Another 0.2% of respondents were from outside the United States.
Respondents were more likely to be from suburban communities than other community types. Some 41.2% of respondents said they were located in suburban communities, while 35.4% were in rural areas, and 23.4% were in urban communities.
A majority, 71.7%, of respondents said they work with public organizations like park departments and school districts. Another 19% said they were with private nonprofit organizations, like Ys. Some 9.1% of respondents were with private for-profit facilities like health clubs. And 0.3% said they work for "other" types of organizations.
When it comes to the type of facility respondents represent, nearly half (47.1%) said they work with parks and recreation departments and districts. Other more common facility types represented include: schools and school districts (10.5%); colleges and universities (9.5%); Ys, JCCs and Boys & Girls Clubs (6.6%); community or private recreation/sports centers (6.5%); campgrounds, RV parks, and private or youth camps (5.7%); sports, health and fitness clubs and medical fitness facilities (2.8%); and golf or country clubs (2.5%). Other facility types that were home to smaller numbers of respondents include: resorts and resort hotels (1.8%); waterparks, theme parks and amusement parks (1.1%); homeowners associations (0.9%); ice rinks (0.5%); racquet or tennis clubs (0.5%); stadiums, arenas and tracks (0.5%); military installations (0.2%); and corporate recreation and sports centers (0.2%). Another 3.1% said they work for other types of facilities.
Respondents were likely to be older professionals, with more than half saying they were at least 50 years old. Some 32.5% were 50 to 59 years old, and 21.7% were 60 or older. Another 26.3% were between 40 and 49 years old, and 15.8% were between 30 and 39 years old. Just 3.8% were less than 30 years old. This likely reflects the fact that respondents tend to be serving in higher-level management or director-level positions.
Nearly two-thirds (64.6%) of respondents were male, while 35.4% were female, representing almost no change over the past few years. The survey audience is also predominantly white—87.9% of respondents. Another 5.5% were black, while 4.6% were Hispanic, 1.6% were Native American or Alaskan Natives, 1.4% were Asian/Pacific Islanders, and the rest were of "other" or "unknown" ethnicity.
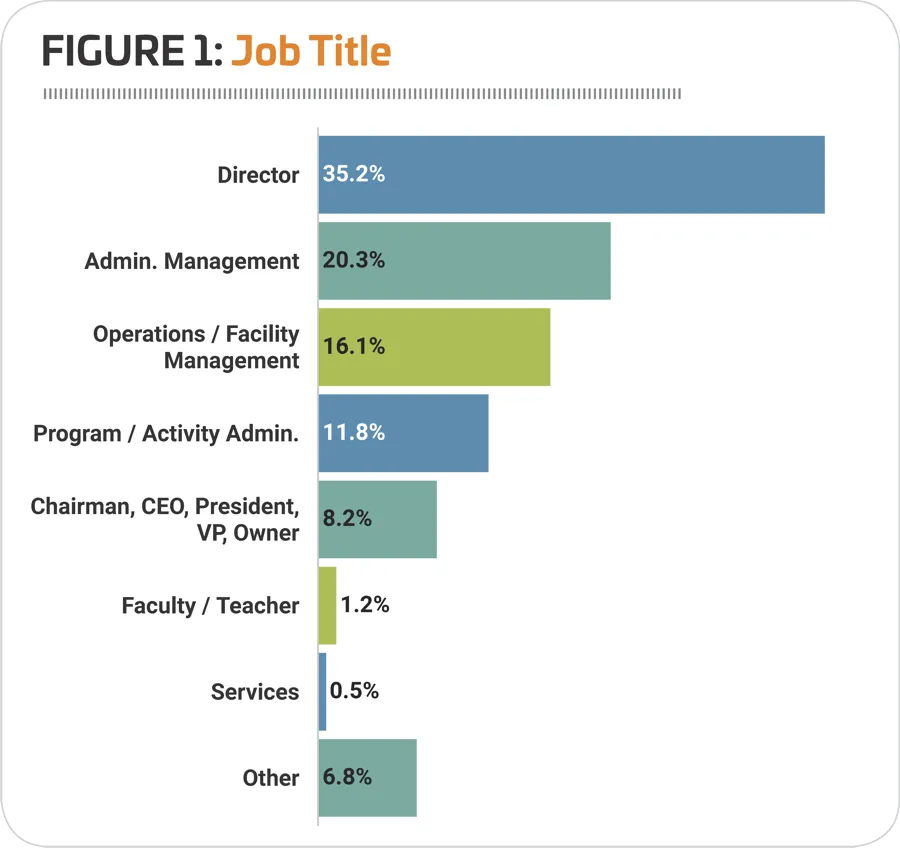
When it comes to the positions held by survey respondents, a majority are in leadership positions. Well over a third (35.2%) are directors. Another 20.3% are in administration management, which includes job titles such as administrator, manager or superintendent. Some 16.1% of respondents are in operations and facility management, including such titles as operations managers, facility managers, building managers and supervisors. Another 11.8% are in program and activity administration, including activity or program directors, managers, coordinators, specialists, coaches and instructors. Another 8.2% of respondents are the chairman, CEO, vice president or owner of their organizations. Some 1.2% are faculty or teachers, while 0.5% are in services, which includes planners, designers, architects and consultants. Finally, 6.8% said they were in "other," unspecified job roles. (See Figure 1.)
Are You Experienced?
As an audience, respondents to the Industry Report Survey tend to be better educated than the American public at large. According to the U.S. Census Bureau, around a third of American adults 25 and older have earned a college degree. By comparison, 80% of Industry Report Survey respondents have earned at least a bachelor's degree. Nearly half, 46.7%, of respondents said they have a bachelor's degree, while 31% have a master's, and 2.3% have an advanced degree. Another 6.5% said they have earned a two-year, or associate's degree, and 11% said they attended college without earning a degree. Finally, 2.5% of respondents said they have a high school diploma.
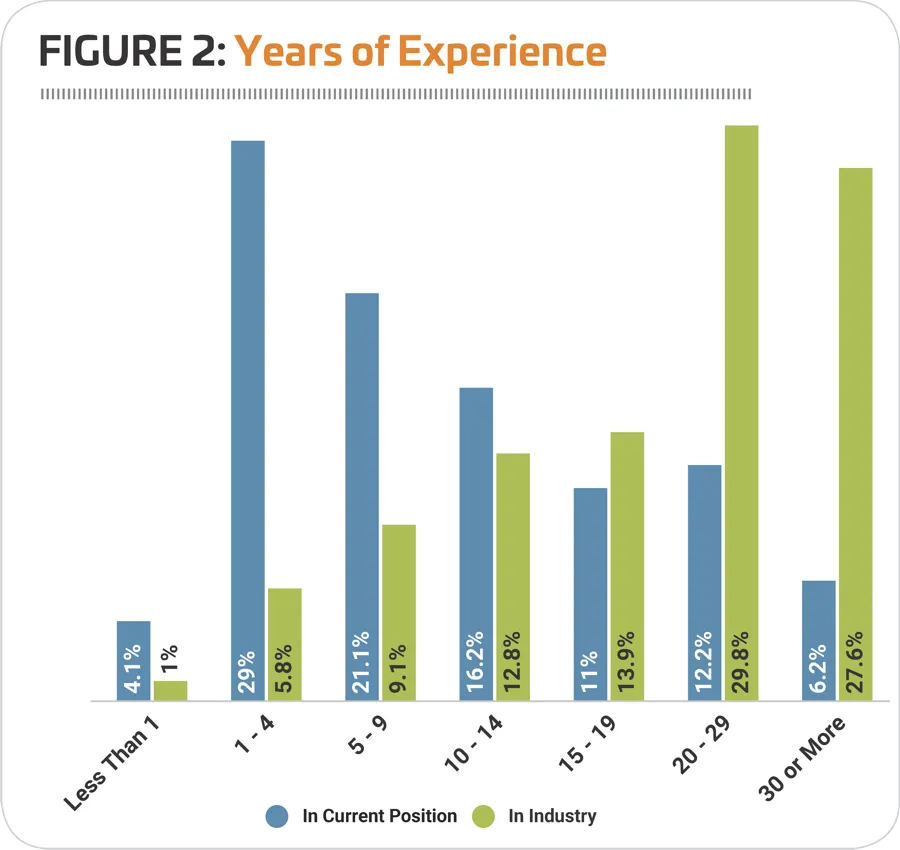
On average, respondents have been working in their current position for 11.7 years, up from 10.7 years in the 2019 survey. Nearly half (45.6%) of respondents said they have been in their current position for at least 10 years, with 18.4% indicating they've been in their current position for at least 20 years. Some 21.1% of respondents said they've been in their current job for five to nine years, while about a third (33.1%) have been in their current job for less than five years.
Respondents to the survey have racked up a lot of experience, with an average of 22.3 years in the recreation, sports and fitness industry. Well over half (57.4%) said they have been working in the industry for at least 20 years, and 27.6% have been involved in the industry for 30 years or more. More than a quarter (26.7%) of respondents said they have between 10 and 19 years in the industry, while 9.1% have five to nine years. Just 6.8% of respondents have been in the industry for four years or fewer. (See Figure 2.)
Let's Talk Dollars & Sense
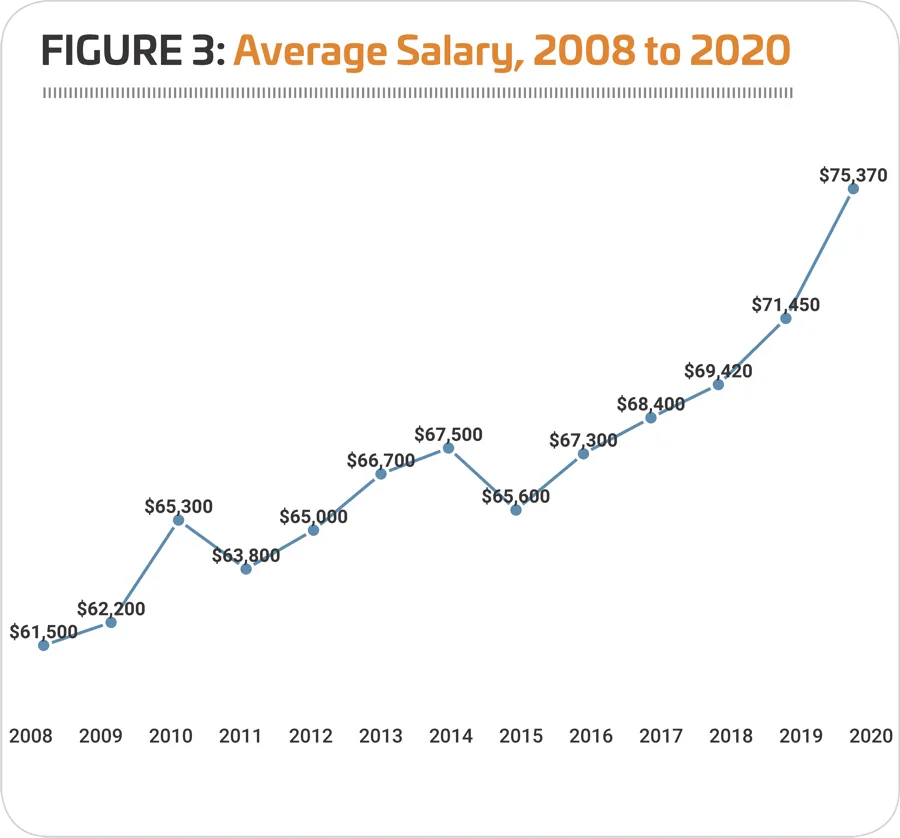
Salaries have been on the rise for the past five years, increasing 1.5% year-over-year in 2018 and 2.9% in 2019. In 2020, respondents reported an average salary of $75,370. This represents a 5.5% increase from 2019. It is 15.4% higher than the average salary reported in 2010, $65,300. (See Figure 3.)
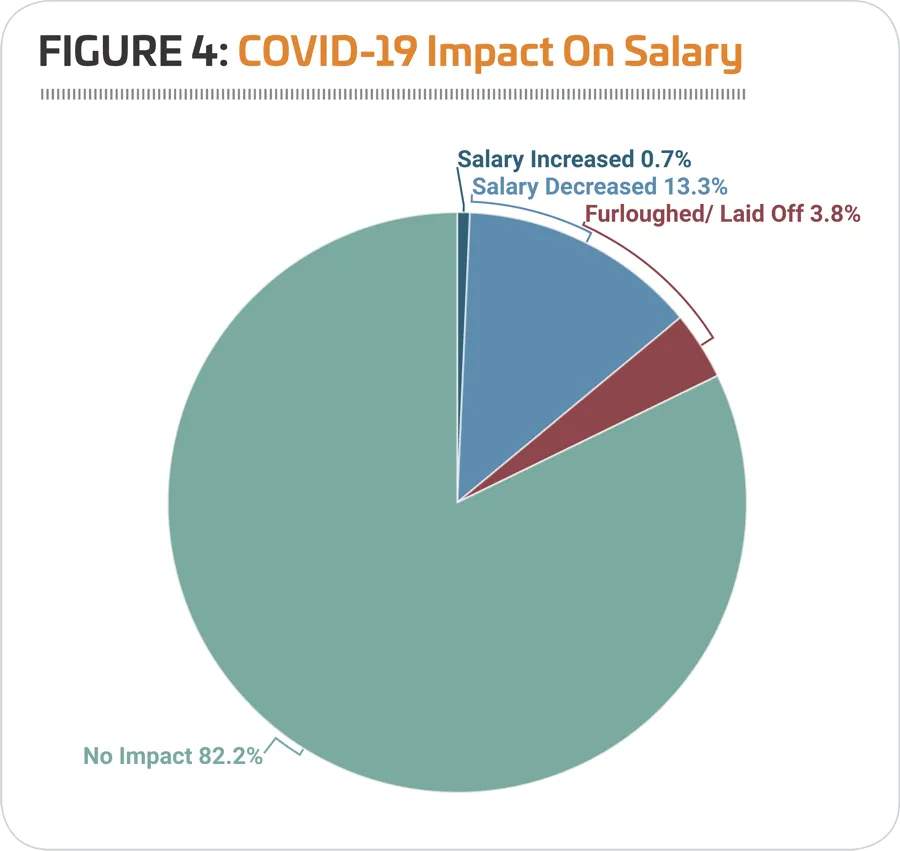
Of course, there is no doubt that COVID-19 has had a dramatic impact on the way we all work. We followed up the Industry Report Survey with a second, shorter survey in early May 2020. Here, we asked what impact the pandemic and social distancing measures had taken on respondents' salaries. The vast majority, 82.2%, said they had seen no impact on their salary at all. Another 13.3% said their salary had decreased, and 3.8% said they had been furloughed or laid off. Some 0.7% of Update Survey respondents said their salary had actually increased as a result of the pandemic. (See Figure 4.)
The full impact of COVID-19 on salaries will become clearer over time. In the meantime, let's take a look at how salaries break down across facility types, regions and more.
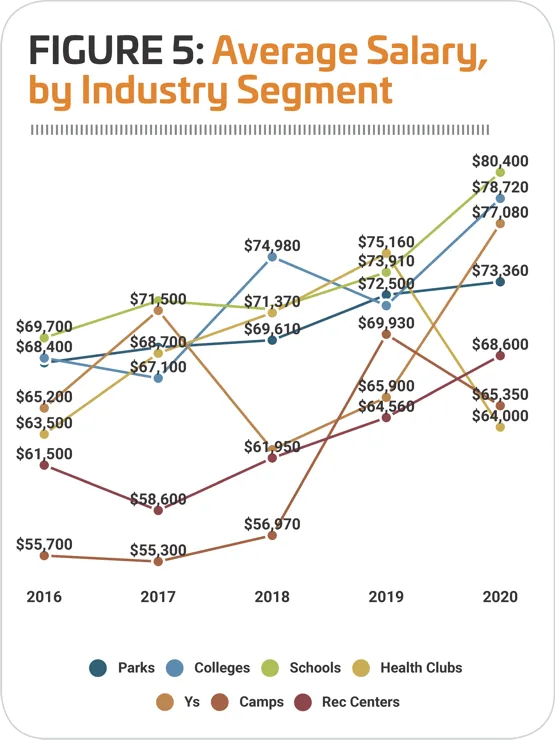
While overall, respondents reported a 5.5% increase in average salary from 2019 to 2020, some industry segments saw higher increases, and others reported dropping salaries. The greatest year-over-year increase in average salaries was reported by respondents from Ys, who saw their average salary jump 17%, from $65,900 in 2019 to $77,080 in 2020. They were followed by respondents from colleges, with a 9.6% increase from $71,800 to $78,720; and schools, with an 8.8% increase, from $73,910 to $80,400. Respondents from rec centers and parks also reported increases to average salaries, with rec center respondents reporting a 6.3% increase in 2020, to $68,600, and park respondents reporting a 1.2% increase, to $73,360. Respondents from camps and health clubs both reported a decrease to their average salary, with camps falling 6.5% to $65,350, and health clubs dropping 14.8%, to $64,000. (See Figure 5.)
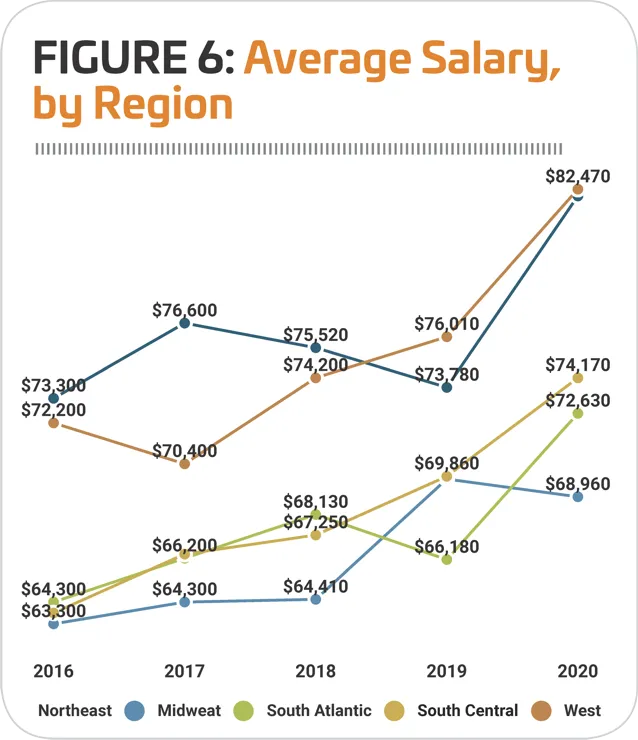
While respondents in the Northeast reported the greatest year-over-year increase to their average salary in 2020, respondents in the Western region had the highest average salary overall. Respondents in the West said their average salary in 2020 was $82,740, up 8.9% from 2019. Respondents in the Northeast earned an average salary of $82,170 in 2020, up 11.4%. Respondents in the South Atlantic reported a 9.7% increase to salaries, with an average of $72,630 in 2020. South Central respondents saw a 6.2% increase from 2019, to an average of $74,170 in 2020. Only respondents in the Midwest reported a decrease in their average salary from 2019 to 2020, with a 1% drop to an average of $68,960. (See Figure 6.)
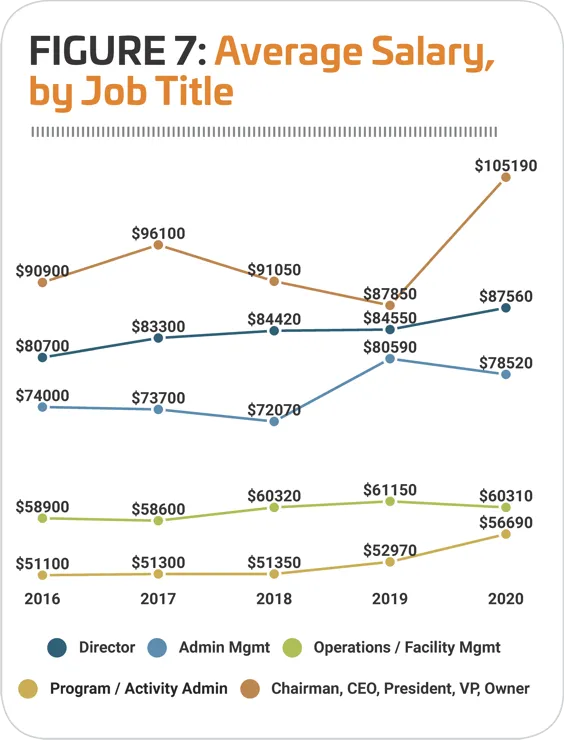
As usual, respondents who are the chairman, CEO, president, vice president or owner of their organization reported the highest average salary, when considered by job title. They also reported the greatest increase year-over-year to their average salaries from 2019 to 2020. Respondents who were the chairman, CEO, president, vice president or owner of their organization reported a 19.7% increase to their average salary, reaching $105,190 in 2020. Respondents in program and activity administration reported a 7% increase, to an average of $56,690 in 2020, and directors saw their average salary increase 3.6%, to $87,560 in 2020. Respondents in operations and facility management saw their average salary decrease by 1.4% in 2020, to an average of $60,310, and those in administration management reported a 2.6% decline, to an average of $78,520. (See Figure 7.)
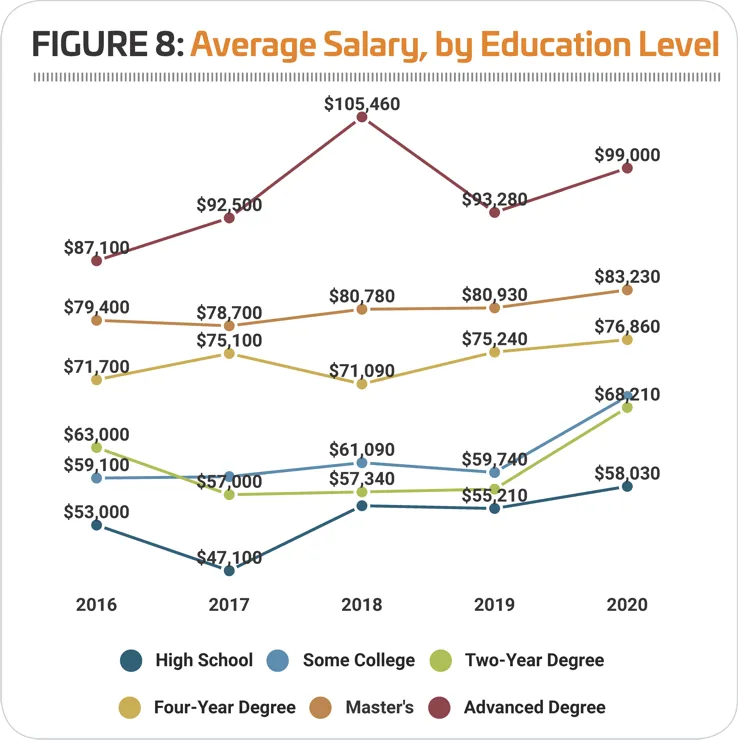
Respondents with higher levels of education typically tend to report higher average salaries, and 2020 is no exception, with those who have earned master's and advanced degrees earning more than those with bachelor's, who likewise earn more than their counterparts with two-year degrees or no college degree at all. The greatest increase to average salary was reported by respondents with a two-year degree, and those with some college but no degree, with increases of 18.3% and 16.5% respectively. Respondents with a Ph.D. or other advanced degree saw their average salary increase 6.1% to $99,000 in 2020. Those with a master's degree reported a 2.8% increase, to $83,230. And those with a four-year degree reported a 2.2% increase, to an average of $76,860. (See Figure 8.)
Over the past few years, the number of respondents who have reported increases to their salaries has been increasing gradually. Since 2016, when 57.4% of respondents said their salary was higher than in 2015, the number reporting higher salaries has risen steadily, reaching 64.9% who saw their salaries increase in 2019 over 2018. Another 29.4% said their salary was unchanged from 2018 to 2019, and 5.7% reported a decrease. (See Figure 9.)
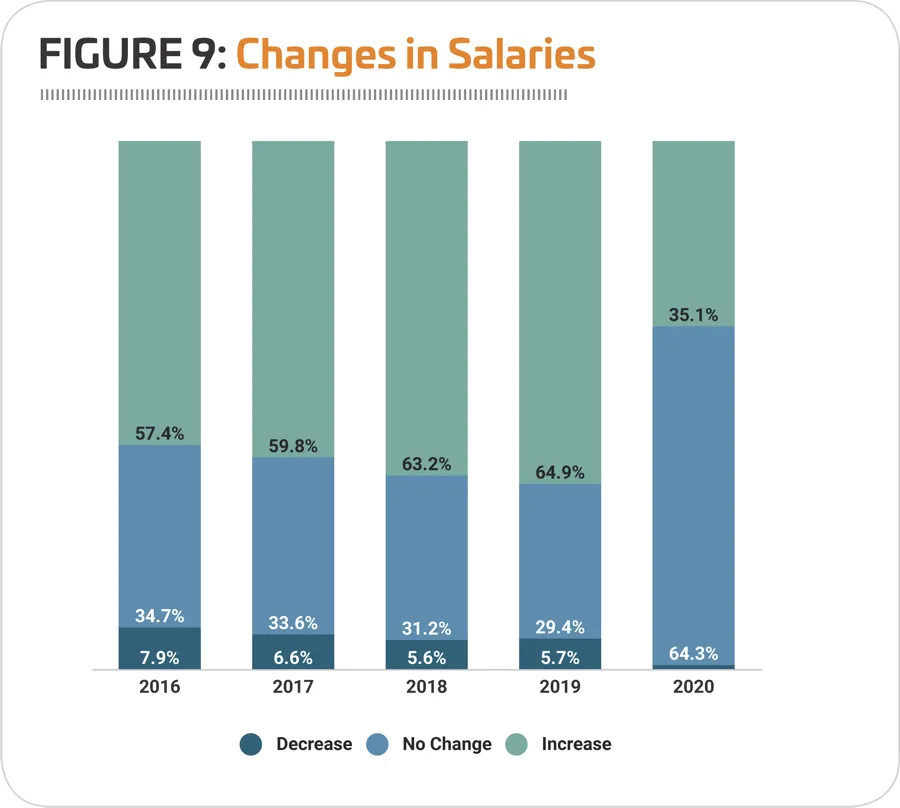
Respondents tend not to expect salaries to increase at the rate at which they actually do, and so looking forward, more than one-third (35.1%) said they were expecting their salary to increase in 2020, while 64.3% were expecting no change at all. Of course, that information is based on the January Industry Report Survey. With hiring plans and programs on hold and some facilities closed temporarily, many respondents likely either took a salary cut or no longer expect to see increases. We'll get a clearer picture when we ask readers to respond to our 2021 Industry Report Survey.
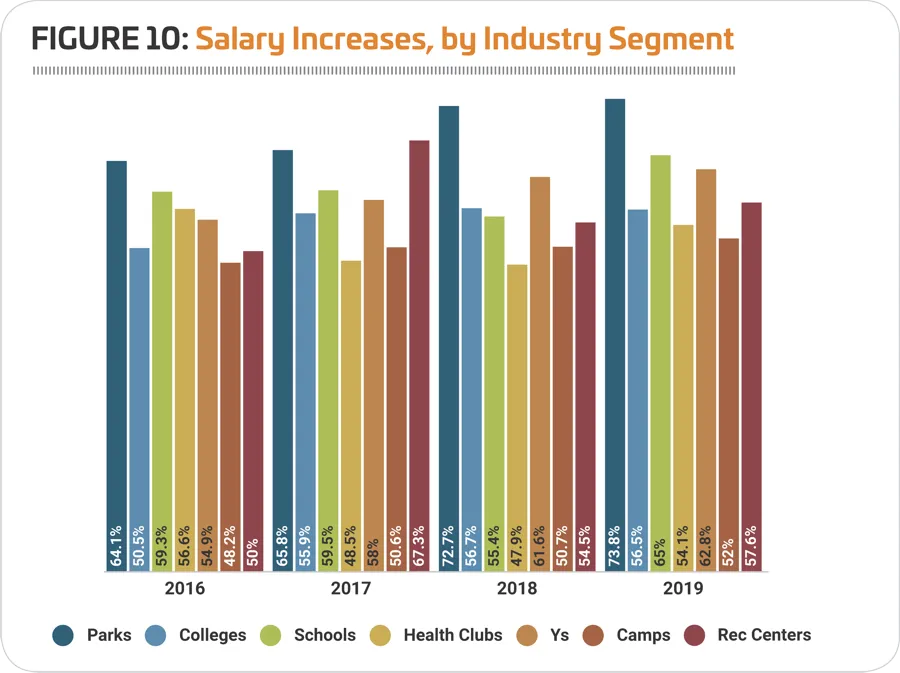
Respondents from parks were again the most likely to report a year-over-year increase in salaries, with nearly three-quarters (73.8%) indicating that their salary in 2019 was higher than in 2018. They were followed by those from schools (65% of whom reported an increase), and Ys (62.8% reporting an increase). Respondents from camps were the least likely to report that their salaries in 2019 were higher than in 2018, though more than half (52%) saw an increase in that time frame. (See Figure 10.)
The average salary increase for 2019 for all respondents was 3.5%, up from a 3.4% increase in 2018. The highest salary increases were reported by those from camps and health clubs, where respondents reported a 4.8% and a 4% increase, respectively, for 2019. More modest increases were reported by those from parks (3.5%), rec centers (3.4%), colleges (3.1%) and Ys (3%). Schools reported the smallest increase, at 2.8%.
Getting Things Done, Happily
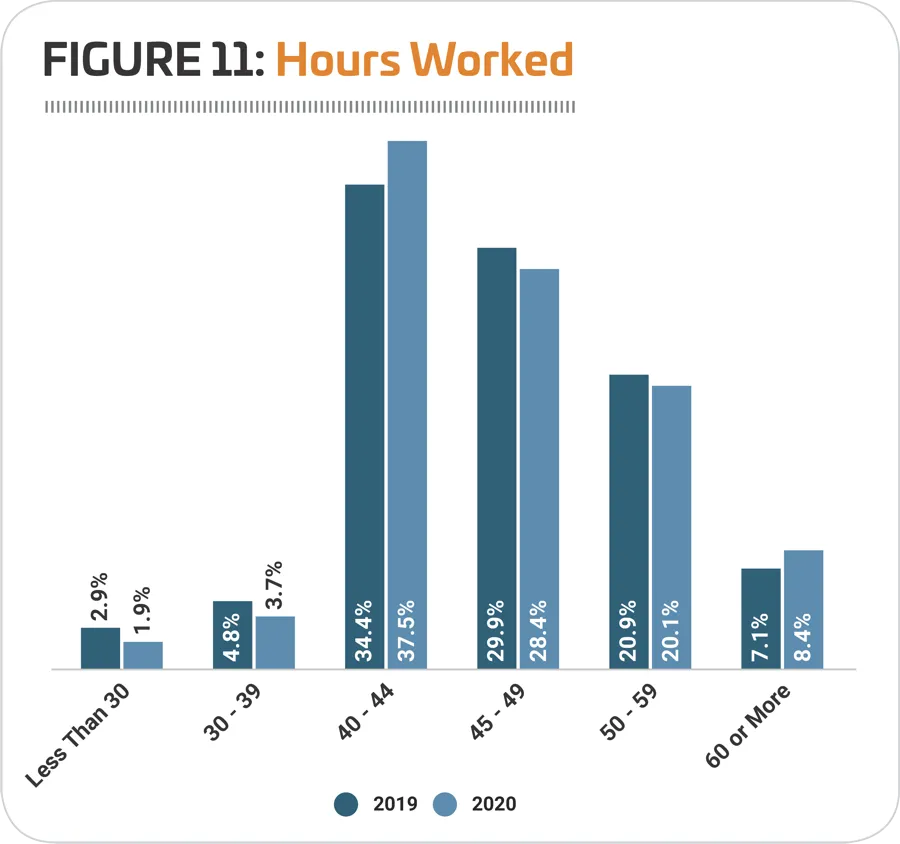
Most respondents said that they work a pretty typical work week of between 40 and 50 hours. Some 37.5% said they put in 40 to 44 hours a week, while 28.4% work 45 to 49 hours per week. Meanwhile, the number of respondents who said they work at least 50 hours a week remained relatively unchanged, growing from 28% in 2019 to 28.5% in 2020. Very few respondents are working part-time hours of less than 40 hours a week. (See Figure 11.)
On average, respondents said they work 47.5 hours per week, up very slightly from 47.2 hours in 2019. Respondents from schools reported the highest average number of hours worked, at 53.2 hours a week. They were followed by those from camps, who work an average of 49.7 hours per week, and colleges, at 48.7 hours per week. Respondents from rec centers and parks logged the fewest average hours, with rec center respondents averaging 44.2 hours and park respondents averaging 45.4.
On average, respondents said they have 21.9 employees reporting directly to them, representing no change from 2019. Some 4.6% of respondents said they have no direct reports. Another 24.5% have one to five employees reporting to them. Some 23.1% have between six and 10 direct reports. Some 18.2% have 11 to 20 employees reporting to them, while 18.5% have between 21 and 50. Another 9.1% of respondents said between 51 and 100 employees report directly to them, and just 1.9% have 100 or more.
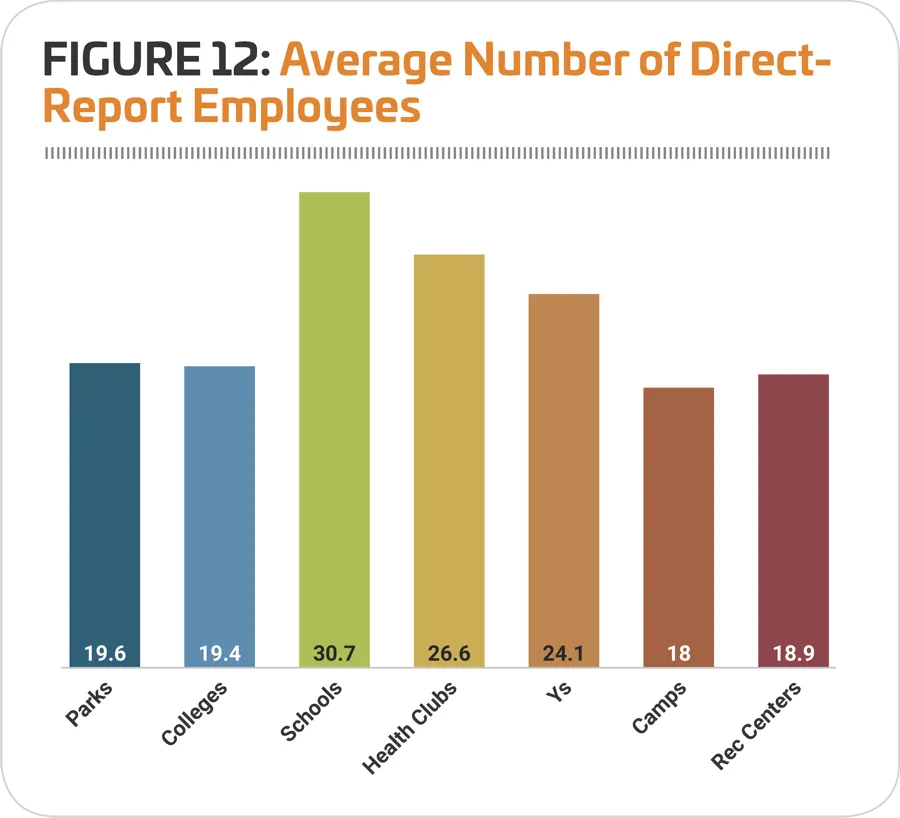
The number of direct-report employees is highest for those from schools, who have an average of 30.7 direct reports. They were followed by health clubs, with 26.6, and Ys, with 24.1. (See Figure 12.)
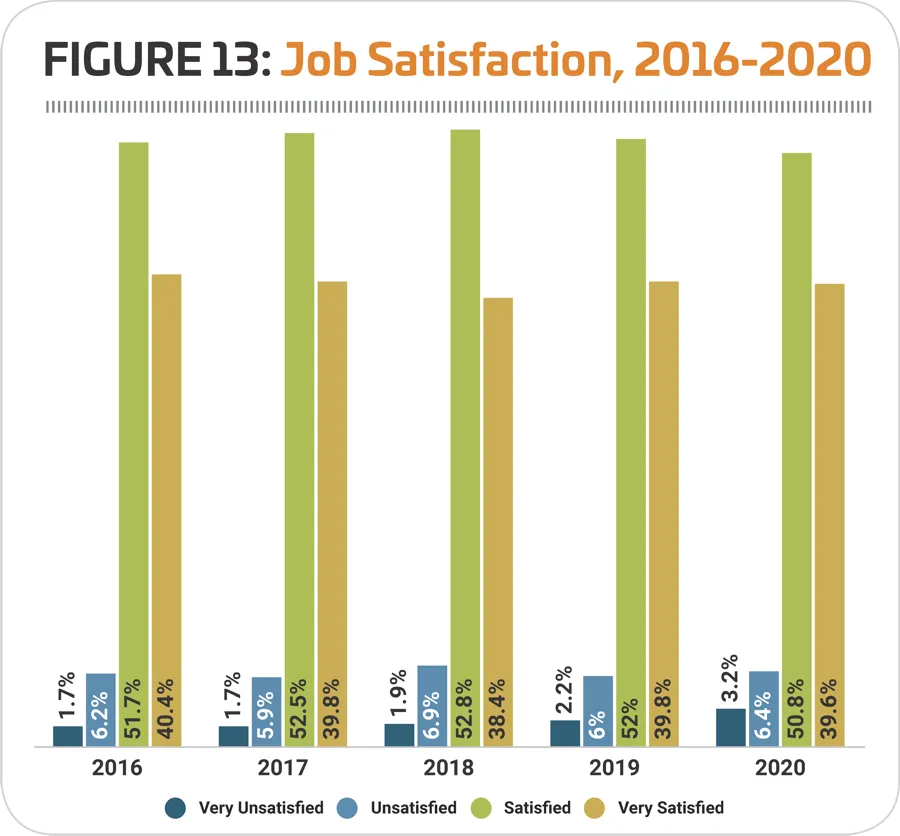
While there was a very slight uptick in the percentage of respondents who say they are unsatisfied in their jobs, from 8.2% in 2019 to 9.6% in 2020, the majority of respondents are either very satisfied (39.6%) or satisfied (50.8%) in their current positions. (See Figure 13.)
Respondents from camps reported the highest levels of satisfaction in their work, with 93.3% indicating they were satisfied. They were followed by those from Ys (93% of whom said they're satisfied in their current jobs) and schools (91.2%). Conversely, respondents from colleges and health clubs were the most likely to report dissatisfaction in their work, though the majority in both cases were satisfied. Some 12.9% of college respondents and 10.8% of health club respondents said they are unsatisfied with their jobs. RM
