


In our annual Aquatic Trends Report, reported in the January issue of Recreation Management, we covered aquatic facilities from top to bottom, but there’s always more data to parse. That’s why we’re back with even more information gleaned from the Aquatic Trends Survey, which gathered details on operations, programming, budgets and more from 628 professionals whose facilities include aquatics, from indoor and outdoor pools to splash pads and waterparks. 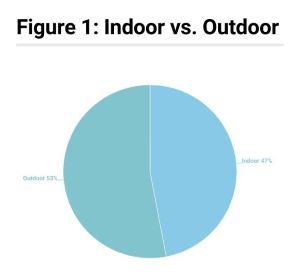
Of those who responded to the survey, 413, or 65.8%, reported that they had only indoor swimming pools or outdoor swimming pools. Of those respondents, more than half (53%) said they had outdoor pools only, and 47% said they had indoor pools only.
Respondents from camps, parks and rec centers were the most likely to indicate that they only had outdoor swimming pools. In fact, 100% of respondents from camps had outdoor-only pools. None had indoor pools. More than three-quarters (78.6%) of park respondents said they had outdoor-only pools, and somewhat fewer (64.7%) respondents from rec centers had outdoor-only pools.
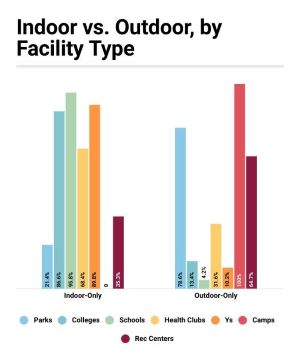 On the other side of the coin, respondents from schools (95.8%), Ys (89.8%), and colleges (86.6%) were far more likely to have indoor swimming pools only.
Here are some highlights of the difference between respondents with indoor pools only vs. those with outdoor pools only:
- Respondents with indoor pools only were more than twice as likely as those with outdoor pools only to use a secondary form of disinfection. Some 43.2% of indoor-only respondents said they currently use secondary disinfection, compared with 22.2% of outdoor-only respondents.
- When it comes to equipment, indoor-only respondents were much more likely to have: lane lines (87.1% vs. 65.8%), pool exercise equipment (73.1% vs. 37.4%), starting platforms (68.4% vs. 28.4%), and scoreboards (46.8% vs. 12.6%). On the other hand, those with outdoor-only pools were much more likely to have: pool slides (45.3% vs. 20.5%), shade structures (63.7% vs. 5.3%), pool covers (33.2% vs. 6.4%), and poolside cabanas (10% vs. 0).
- When it comes to program offerings, indoor-only pools were much more likely to feature: lap swim time (89.5% vs. 61.6%), aquatic aerobics (76.6% vs. 49.5%), swim meets and competitions (61.4% vs. 39.5%), aquatic programs for those with physical (49.7% vs. 22.1%) or developmental (43.9% vs. 21.1%) disabilities, water walking (43.9% vs. 18.9%) and aquatic therapy (31.6% vs. 4.2%).
- Respondents with indoor-only pools were more likely to indicate they had had difficulties staffing lifeguards at their facilities. More than two-thirds (67.2%) of those with indoor-only pools had trouble finding lifeguards, compared with 41% of those with outdoor-only pools.
To read the entire Aquatic Trends Report, click here.