


Survey Methodology
This report is based on a survey conducted for Recreation Management by Stamats Inc., an independent research company. An e-mail was broadcast and respondents were invited to participate. From the launch of the survey on Sept. 13, 2023, to the closing of the survey on Oct. 23, 2023, 628 completed surveys were received from respondents with aquatic facilities. The findings of this survey may be accepted as accurate, at a 95% confidence level, within a sampling tolerance of approximately +/- 3.91 percent.
 From the smallest HOA pool to the most elaborate privately owned waterpark, the world of aquatic facilities is vast and varied. Each facility is faced with unique challenges and opportunities, and aquatic facility managers have to react to the realities they face—from lifeguard shortages to a bottleneck on pool chemical supplies to maintaining aging infrastructure as the number of people visiting the facility bounces back to pre-pandemic levels and beyond. But despite the myriad experiences of aquatic facility operators, they do all have at least one thing in common, and that thing is a pool, a splash pad, a hot tub or some other amenity that gives visitors a chance to immerse themselves or just splash around.
In these pages, we’ll take a closer look at aquatic facilities as measured by our annual Aquatic Trends survey, along with more specific data detailing how aquatic operations are faring. We’ll give you the top-down view, looking at the responses of more than 600 aquatic industry professionals who completed the Aquatic Trends survey, and where appropriate, we’ll drill down into more specific data for various cohorts, including types of facilities (i.e., park districts, colleges, schools, health clubs, Ys, camps and rec centers).
To kick things off, let’s break down the demographics of the 628 professionals whose facilities include aquatic features who responded to the survey.
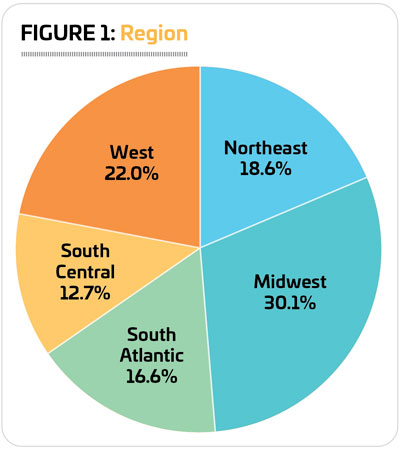
While survey respondents can be found in every region of the U.S., the largest number of respondents—30.1%--make their home in the Midwest. That includes Illinois, Indiana, Iowa, Kansas, Michigan, Minnesota, Missouri, Nebraska, North Dakota, Ohio, South Dakota and Wisconsin. (See Figure 1.)
Another 22% of respondents reported from the West, including Alaska, Arizona, California, Colorado, Hawaii, Idaho,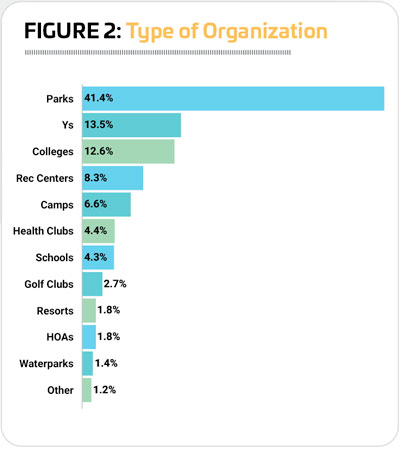 Montana, Nevada, New Mexico, Oregon, Utah, Washington and Wyoming.
Some 18.6% of survey respondents can be found in the Northeast. This includes Connecticut, Maine, Massachusetts, New Hampshire, New Jersey, New York, Pennsylvania, Rhode Island and Vermont.
The South Atlantic is home to 16.6% of respondents. This region includes Delaware, Florida, Georgia, Maryland, North Carolina, South Carolina, Virginia, Washington, D.C., and West Virginia.
The smallest number of respondents reported from the South Central region, with 12.7% of the response. This region includes Alabama, Arkansas, Kentucky, Louisiana, Mississippi, Oklahoma, Tennessee and Texas.
We also asked respondents to describe the type of organization they worked for, from parks and rec departments to homeowners associations. The largest number of respondents—41.4%—said they worked for parks and recreation districts or departments. They were followed by: YMCAs, YWCAs, JCCs and Boys & Girls Clubs (13.5%); colleges and universities (12.6%); community or private recreation and sports centers (8.3%); private or youth camps, campgrounds and RV parks (6.6%); sports, health and fitness clubs, racquet clubs and medical fitness facilities (4.4%); schools and school districts (4.3%); golf clubs and country clubs (2.7%); resorts and resort hotels (1.8%); homeowners’ associations (1.8%); and waterparks (1.4%). Another 1.2% were from other types of organizations, including military installations and churches. (See Figure 2.)
(Where we consider data in terms of the type of organization in the following pages, we’ll be looking at parks, colleges, 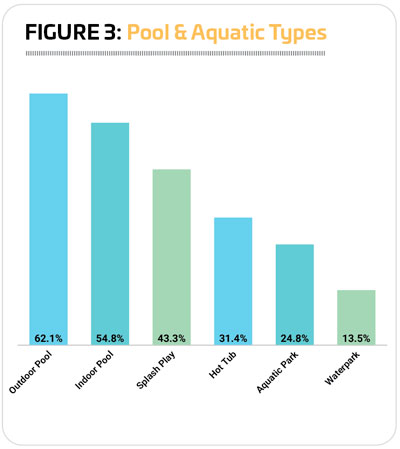 Ys, rec centers, camps, health clubs and schools.)
From college natatoriums that host a variety of programming, swim teams and meets to park district-owned aquatic parks that combine pools with lazy rivers, splash play and slides to a local homeowners’ association’s small neighborhood swimming pool, there’s a tremendous range in types and uses for aquatic facilities. We asked respondents whether they included a range of different facility types among their offerings, including outdoor and indoor swimming pools, hot tubs, aquatic parks (with a primary focus on swimming pools, and featuring other aquatic attractions) and waterparks (with a primary focus on rides and waterslides).
As usual, outdoor swimming pools were the most common type of aquatic amenity, with 62.1% of respondents indicating they had at least one outdoor pool (10.3% of respondents had at least four outdoor pools!). This represents very little change from 2023, when 62.9% of respondents had at least one outdoor pool. More than half (54.8%) of respondents in 2024 indicated that they have at least one indoor pool, down slightly from 55.2%. Some 43.3% of respondents said they currently have at least one splash play area, up from 39.6% in 2023. And 31.4% had hot tubs, spas or whirlpools, up from 27.5%. (See Figure 3.)
While less common, the more complex aquatic parks and waterparks were slightly more common in 2024 than in 2023. Some 24.8% of respondents said they currently have an aquatic park, up from 22.7% in 2023 and 18.2% in 2022. And 13.5% said they currently have a waterpark, up from 10.4% in 2023 and 10.2% in 2022.
Respondents from camp facilities were the most likely to report that they had at least one outdoor pool. Some 90.2% of 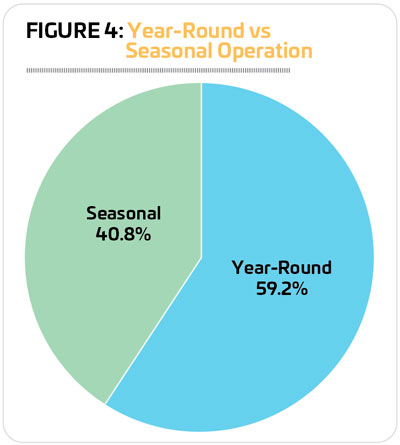 camp respondents said they currently have an outdoor pool. They were followed by parks, where 76.9% of respondents had at least one outdoor pool. Park respondents also had the largest number of outdoor pools, with 15.8% of park respondents reporting that they had four or more outdoor pools among their facilities.
Indoor pools were most common for Ys, schools and colleges. Some 91.8% of Y respondents, 88.9% of school respondents and 87.3% of college respondents said they currently have at least one indoor pool.
Splash play areas were most likely to be found at park facilities. What’s more, the number of park respondents with splash play areas saw a big increase in this year’s survey. Some 68.1% of park respondents said they had at least one splash play area, up from 61.2% in 2023. They were followed by rec center respondents, 42.3% of whom currently have a splash play area.
Hot tubs, spas and whirlpools were most likely to be found at the facilities of health club respondents. More than seven in 10 (70.4%) health club respondents said they currently have a hot tub at their facility. They were followed by Ys (49.4%) and colleges and universities (46.8%).
While less common, more than one-third (34.6%) of park respondents said they currently have an aquatic park, and 17.7% of park respondents said they currently have a waterpark.
Slightly fewer respondents in 2024 than in 2023 said that their aquatic facilities are open all year—59.2% vs. 61.2%—while 40.8% said their aquatic operations are seasonal. (See Figure 4.)
Year-round operations were most common for respondents from schools, Ys and colleges. A majority of these 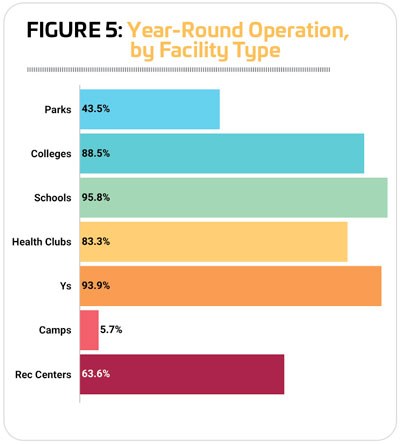 respondents said their aquatic facilities were open year-round, with 95.8% of school respondents, 93.9% of Y respondents and 88.5% of college respondents indicating they have year-round aquatic operations.
On the other side of the coin, camps were by far the most likely to report that their aquatic operations are seasonal. Some 94.3% of camp respondents had seasonal operations. They were followed distantly by
park respondents, where 56.5% of respondents operate seasonally. (See Figure 5.)
Year-round operations were somewhat associated with higher average operating budgets. Around seven out of 10 respondents whose aquatic operating costs in 2022 were $500,000 or more (69.1%) or between $250,000 and $499,999 (70.1%) said they had year-round operations. Just over half (54.6%) of respondents with operating costs in 2022 between $100,000 and $249,000, and less than half (45.7%) of those with operating expenses of less than $100,000 in 2022 said they operated year-round. (See Figure 6.)
With Memorial Day pool openings a longstanding tradition in many communities, it comes as no surprise that May is the most common month for seasonal aquatic operations to begin. A majority (61.8%) of respondents with seasonal operations said their season opens in the month of May. Another 28% said they began their season in June.
With the other end of the season often falling right around Labor Day, September is the most common time for closing seasonal pool operations. Most than half (51.6%) of respondents said their season comes to a close in September. Another 34.2% end their aquatic season in the month of August.
Budgets & Construction Plans
Respondents said their average operating cost for 2022 was $429,750. In 2023, they spent 9.3% more, $469,800.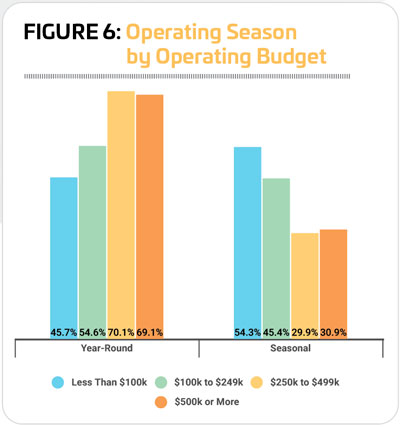 Looking forward, aquatic respondents said they expected to spend 9.7% more in 2024 than in 2023, projecting an average aquatic operating cost of $515,150. (See Figure 7.)
As usual, respondents from parks had the highest overall average operating cost for their aquatic operations. This is driven by multiple factors, including a greater number of facilities for parks, as well as a higher likelihood of including aquatic parks with more complex amenities.
Parks spent 40.1% more in 2022 than the average for all respondents, with an average operating cost of $601,950. They were followed by Ys, where respondents spent $348,400 on average, 18.9% less than the average for all respondents; and rec centers, where respondents spent an average of $298,050, 30.6% less than the average for all respondents. The lowest average operating cost in 2022 was reported by camps, with a comparatively very low average cost of $65,700. (See Figure 8.)
All facility types reported an increase to their average operating costs for aquatics from 2022 to 2023. The sharpest increases were seen by respondents at Ys and colleges. Y respondents reported a 12.3% increase, from an average of $348,400 in 2022 to $391,400 in 2023, and college respondents reported a 12.2% increase, from an average of $205,750 in 2022 to $230,900 in 2023. They were followed by parks, with an 8.3% increase from $601,950 in 2022 to $652,100 in 2023, and camps, with a 7.2% increase from $65,700 in 2022 to $70,400 in 2023. Rec centers saw the smallest increase, with a 5.6% jump between 2022 and 2023, from an average of $298,050 to $314,650.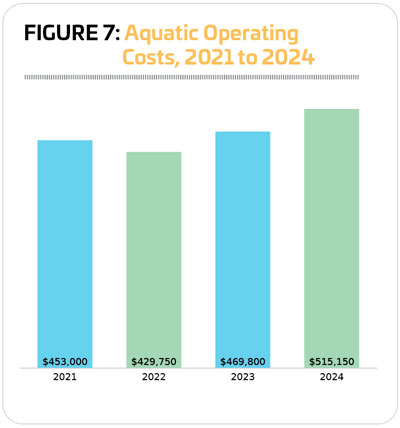
While they may have the lowest overall operating cost, looking forward, respondents from camps expected their aquatic operating cost to increase at the fastest clip between 2022 and 2024, reporting a 75.1% increase to an average of $115,050. They were followed by colleges, where respondents expected aquatic costs to climb 26.2% from 2022 to 2024, to an average of $259,600. Parks followed, with an 18.9% increase to an average of $715,650.
Editor’s Note: The sample size for respondents from schools and health clubs who answered budget-related questions was too small to provide accurate mean data. The median operating costs reported in 2022 for school respondents was $65,000 and for health club respondents was $165,000. The medians for 2023 were $80,000 for schools and $175,000 for health clubs. And the medians for 2024 were $80,000 for schools and $180,000 for health clubs.
There was a slight increase in the number of respondents who said that they had built a new aquatic facility over the past few years. In 2022, 12.7% of respondents said they had built new facilities, and in 2023, 13.2% of respondents had built new facilities. Respondents from camps, parks and schools were the most likely to say they had built a new aquatic facility over the past three years. Some 16.7% of camp respondents, 16.4% of park respondents and 16% of school respondents had built new facilities. That said, only respondents from parks and rec centers were more likely in 2023 than in 2022 to have constructed new facilities. All other facility types were somewhat less likely to have constructed new facilities. No health clubs in 2023 said they had constructed new aquatic facilities over the past three years. (See 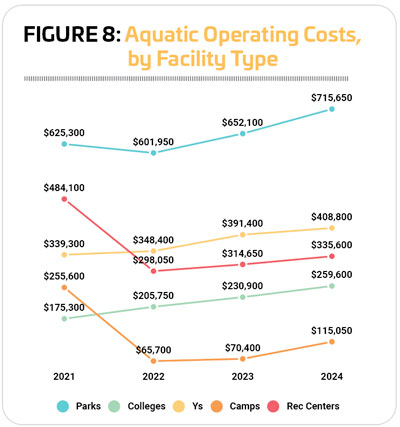 Figure 9.)
After holding steady for three years, there was a slight increase in the number of respondents who said they had closed aquatic facilities in 2023, though the number is still quite small. In 2023, 5.1% of respondents said they had permanently closed a pool without building a replacement, up from 3.3% in 2022. Another 1.6% said they had closed a swimming pool and replaced it with a splash pad, up from 1% in 2022. (See Figure 10.)
College and university respondents were by far the most likely to report that they had permanently closed an aquatic facility without building a replacement over the past three years. Some 14.1% of college respondents indicated they had done so, up from 7.6% in 2022. They were followed by Ys, where 6% of respondents said they had permanently closed an aquatic facility without building a replacement. With the exception of a single school respondent, parks were the only respondents who reported that they had closed an aquatic facility and replaced it with a splash pad. Some 3.4% of park respondents said they had done so, up from 2.2% in 2022.
Managing Water & Resources
The backbone of any aquatic facility is its infrastructure, and that includes the various systems that facility managers rely on to keep pool water clean and safe for swimming. We asked respondents to tell us about the various systems they rely on to maintain proper water chemistry at their facilities, from filtration to secondary disinfection and more.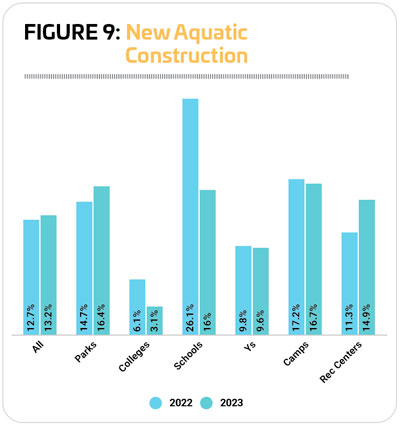
There’s been little change over the past few years in the types of filtration systems relied on most. Sand filters continue to be the dominant method of pool filtration, with more than three-quarters (76.3%) of respondents indicating they use sand filters. This represents little change from 2022 (76.5%) and is still higher than 2021 (67.5%). Diatomaceous earth (D.E.) filters were used by 18.2% of respondents in 2023, down slightly from 20.8% in 2022. Regenerative media filters (RMFs) have seen usage increase slightly in each year measured, from 9.2% in 2020 to 12.3% in 2022. (See Figure 11.)
A majority (83.3%) of respondents reported that they currently use chlorination systems at their facilities, down from 84.6% in 2022. Another 11% said they rely on bromination systems, up from 7.8% in 2022. Nearly four in 10 (39.4%) said they currently use a tablet chlorination system (up from 38.4%), and 7.9% are using salt chlorine generators (up from 3%).
To improve water quality further and better prevent recreational water illnesses, the Model Aquatic Health Code (MAHC) recommends installing secondary disinfection systems, such as UV systems. However, there was a small decrease in the number of respondents in 2023 who said they currently employ some form of secondary disinfection at their facilities. Some 37.5% of respondents said they use secondary disinfection, down from 41.7% in 2022, but still higher than the 35.2% who did so in 2021.
UV systems continue to be the dominant form of secondary disinfection deployed by far. Some 84.7% of those who use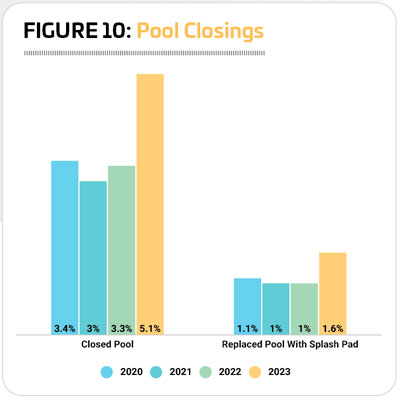 secondary disinfection said they rely on UV systems, up from 83% in 2022. Another 6.2% said they are using AOP (advanced oxidation process) systems, up from 4.7% in 2022 and 2.9% in 2021. Ozone systems are used by 4.8% of respondents with secondary disinfection, representing virtually no change from 4.7% in 2022. Another 4.3% said they use some other form of secondary disinfection. (See Figure 12.)
Health clubs, rec centers and Ys were the most likely to report that they used secondary forms of disinfection. Some 42.3% of health club respondents, 41.3% of rec center respondents and 41% of Y respondents said they currently use a secondary form of disinfection. Camps were the least likely to use secondary disinfection, with just 10.5% of respondents indicating they do so, down from 17.9% in 2022. (See Figure 13.)
Respondents who spent more annually on their operations were much more likely to report that they use secondary disinfection at their facilities. Some 54.9% of those whose operating costs are more than $500,000 a year said they currently use secondary disinfection, down from 69.5% in 2022. For those with annual costs between $250,000 and $499,999, 40.8% are using secondary disinfection, relatively unchanged from 41.1% in 2022. Some 34.3% of those with costs between $100,000 and $249,999 use secondary disinfection, while 25.4% of those whose operating costs are less than $100,000 use secondary disinfection systems.
Respondents with indoor pools only are far more likely to use secondary disinfection than those with outdoor-only pools.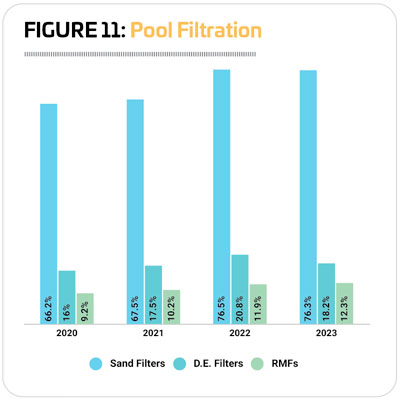 Some 43.2% of those with indoor pools only said they currently use secondary disinfection, up from 38% in last year’s report. And 22.2% of those with outdoor pools only said they rely on secondary disinfection, up from 8.3%.
Looking forward, 16.5% of respondents said they had plans to add new systems or update existing systems at their aquatic facilities over the next three years, virtually unchanged from 2022, when 16.7% had such plans. Respondents from parks, Ys and camps were the most likely to have such plans, with 17.9% of park respondents, 17.1% of Y respondents and 17.1% of camp respondents indicating that they had such plans.
UV systems were the most commonly planned upgrade to pool water treatment systems. Some 45.6% of those with plans for updates said they would be adding UV systems. D.E. filtration and RMFs were the second most commonly planned upgrade, with 26.7% of respondents with plans for upgrades indicating they would add D.E. filters, and 26.7% indicating they would add RMFs.
Automation systems can help manage water balance, maintaining a continual stream of chlorine and using other methods to measure and maintain water quality. Only 7.9% of respondents in 2023 said they have deployed no types of controllers on their pools. Most common in 2023 were chemical feed pumps, used by 77.7% of respondents (down from 79.6%). Another 77.6% use chemical controllers, representing virtually no change from 77.7% in 2022. And 41.4% use backwash controllers, up from 35.8% in 2022. (See Figure 14.)
The number of respondents to the Aquatic Trends survey who deploy strategies and tools to conserve resources at their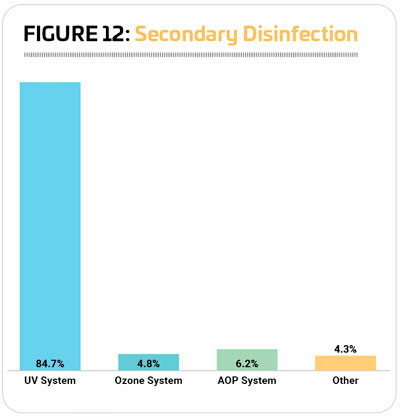 facilities continued to fall with this year’s survey. In 2023, less than half (47.7%) of respondents said they aimed to conserve resources, down from 55.6% in 2022, and down dramatically from 2019, when 71% of respondents said they were conserving resources. Conserving chemicals was most common, with one-third (33.3%) of respondents indicating that they have strategies and tools in place to conserve chemicals. This is up from 31.2% in 2022. Nearly three in 10 (29.5%) respondents said they aim to conserve energy at their facilities, down from 34.4%; and more than one-quarter (26.7%) said they aim to conserve water at their facilities, up from 24%.
Respondents from rec centers and schools were the most likely to report that they currently have strategies and systems in place to conserve water, energy or chemicals at their facilities. Two-thirds (66.7%) of rec center respondents said they conserve resources, down from 69.8% in 2022. And 63.6% of school respondents said they conserve resources, up from 52.2%. Camps and Ys were the least likely to have resource-conservation measures in place. Just 21.9% of camp respondents and 35.9% of Y respondents said they are working to conserve resources at their aquatic facilities, down from 34.5% and 41%, respectively.
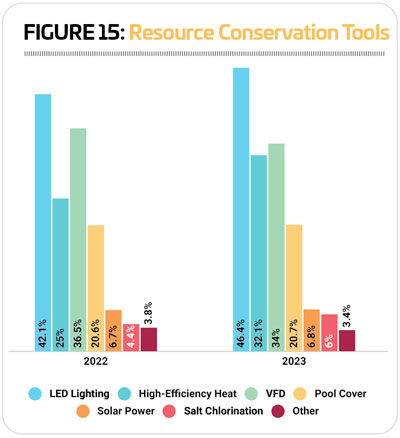
When it comes to tools commonly deployed to conserve energy, chemicals and water at aquatic facilities, LED lighting and high-efficiency heaters, as well as salt chlorine generators to a lesser degree, were used by more respondents in 2023 than in 2022. Almost half (46.4%) of respondents said they have LED lighting in place, up from 42.1% in 2022, and nearly a third (32.1%) said they use high-efficiency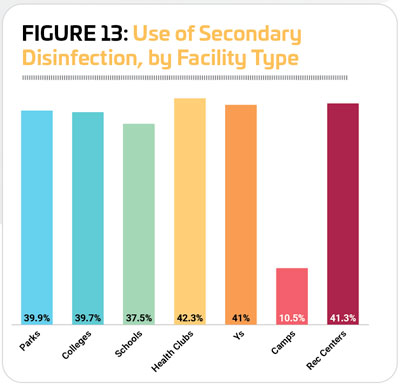 heaters at their aquatic facilities, up from 25%. While far fewer respondents rely on salt chlorine generators, the number using them grew from 4.4% in 2022 to 6% in 2023. More than one-third of respondents (34%) also said they used variable frequency drives and pumps at their facilities, down from 36.5% in 2022. (See Figure 15.) Some 3.4% of respondents said they had other ways to conserve resources at their facilities, including electronic monitoring and automated controls, adjustments to HVAC systems, modifying temperature and water chemicals based on demand, installing new filters and more.
Equipping the Pool
You can build a pool and just offer time for folks to splash and play, but if you really want to draw in more visitors, adding some amenities can make a big difference. Whether it’s accessibility equipment mandated by the ADA Guidelines or a lazy river for relaxing and water walking, there are many ways to make more of a pool by adding amenities to improve accessibility, competition, recreational opportunities, sports and more.
The equipment most commonly found at respondents’ facilities in 2023 includes: lifeguard stands (82.9% of respondents have lifeguard stands); lane lines (76.3%); pool lifts or other accessibility equipment (66.2%); pool exercise equipment (55.2%); and starting platforms (49.2%). Beyond these most common items is a vast range of possibilities when it comes to equipping the pool to enhance competitive events, support recreation and fitness and more. Here’s a list of in-pool and on-the-deck equipment commonly found among respondents’ facilities: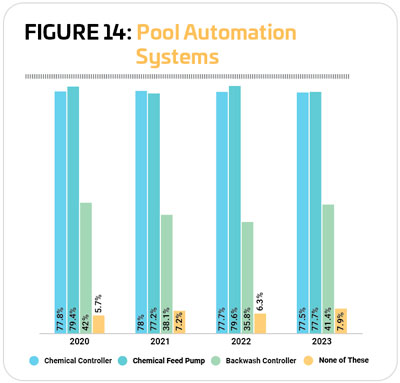
- Lifeguard Stand: 82.9%
- Lane Lines: 76.3%
- Pool Lift or Other Accessibility Equipment: 66.2%
- Pool Exercise Equipment: 55.2%
- Starting Platforms: 49.2%
- Diving Boards: 47.9%
- Pool Slides: 44%
- Shade Structures: 43.9%
- Zero-Depth Entry: 41.3%
- Water Basketball Equipment: 32.7%
- Scoreboard: 28.4%
- Water Polo Equipment: 22.4%
- Teaching Platform: 21.1%
- Water Playground: 18.7%
- Pool Inflatables: 17.6%
- Swim Platform: 15.6%
- Water Volleyball Equipment: 15.2%
- Lazy River: 14.9%
- Diving Platforms: 13.6%
- Swim Wall or Pool Bulkhead: 11.7%
- Poolside Cabanas: 9.9%
- Poolside Climbing Wall: 8.8%
- Lily Pads/Water Walk: 7%
- Underwater Treadmill or Bike: 4.6%
- Pool Obstacle/Ninja Course: 4%
- Wave Pool: 2.6%
- River Raft Ride: 2.2%
- Water Coaster: 1.3%
- Surf Machine: 0.6%
 The only item that saw substantial growth between 2022 and 2023 was diving platforms, up 3.8 percentage points from 9.8% in 2022.
Respondents from parks were more likely than others to include pool slides, shade structures, zero-depth entry, water playgrounds, lazy rivers, poolside climbing walls, lily pads/water walks, river raft rides, water coasters, and surf machines.
College respondents were more likely than others to include lane lines, pool exercise equipment, water basketball equipment, water polo equipment, water volleyball equipment, and diving platforms.
School respondents were the most likely to include pool lifts and other accessibility equipment, starting platforms, diving boards, scoreboards, teaching platforms, swim platforms, swim walls or pool bulkheads, and underwater treadmills or bikes.
Respondents from health clubs were the most likely to include pool obstacle or ninja courses.
Camp respondents were the most likely to include wave pools.
Finally, respondents from rec centers were the most likely to include lifeguard stands, pool inflatables and poolside cabanas.
Respondents in 2023 were somewhat more likely to report that they had plans to add features at their facilities over the next few years. Some 41.8% of respondents said they had such plans, up from 40.2% in 2022 and 24.3% in 2021.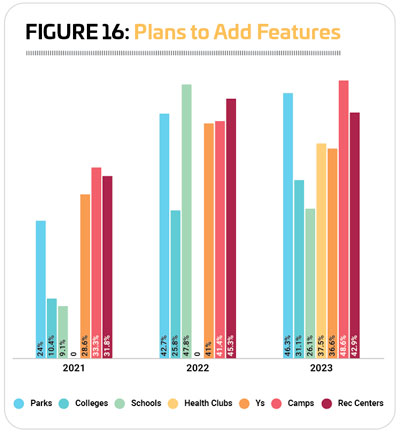
Respondents from camps, parks and rec centers were the most likely to be planning to add features. Some 48.6% of camp respondents, 46.3% of park respondents and 42.9% of rec center respondents said they would be adding features at their facilities over the next three years. Respondents from schools were the least likely to be planning to add features to their facilities. (See Figure 16.)
The 10 most commonly planned additions at aquatic facilities include:
1. Shade structures (planned by 30.7% of those who will be adding features, virtually unchanged from 30.1% in 2022)
2. Poolside climbing walls (24.1%, down from 25.4%)
3. Poolside cabanas (21.5%, up from 19.6%)
4. Pool obstacle/ninja course (20.2%, down from 22.5%)
5. Pool inflatables (16.7%, no change)
6. Teaching platform(15.8%, up from 12.9%)
7. Pool lift or accessibility equipment (15.4%, up from 11%)
8. Zero-depth entry (15.4%, up from 13.4%)
9. Water playground (14.5%,virtually unchanged from 14.8%)
10. Pool slides (13.6%, down from 14.4%)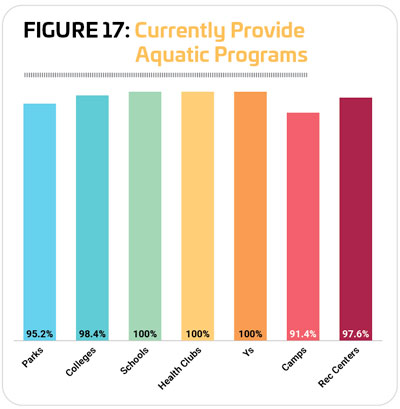
Respondents from parks were the most likely to be planning to add shade structures, poolside cabanas, zero-depth entry, pool slides, lazy rivers, starting platforms, and swim walls or pool bulkheads.
Colleges were the most likely to be planning to add water polo equipment, scoreboards, and diving boards.
Respondents from schools were the most likely to be planning to add lifeguard stands, and swim platforms.
Health club respondents were the most likely to be planning to add pool exercise equipment, underwater treadmills or bikes, and teaching platforms.
Respondents from Ys were the most likely to be planning to add pool lifts or accessibility equipment, water volleyball equipment, and water basketball equipment.
Camp respondents were the most likely to be planning to add water playgrounds, diving platforms, water coasters, wave pools, and surf machines.
Finally, rec center respondents were the most likely to be planning to add poolside climbing walls, pool obstacle/ninja courses, pool inflatables, lane lines, lily pads/water walks, and river raft rides.
Programming
Not every aquatic facility hosts aquatic programming (splash pads, for example, are unlikely to have much in the way of 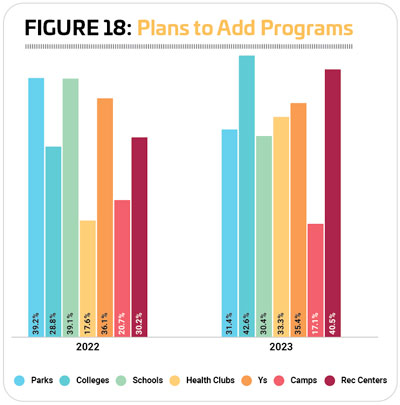 programming), but the vast majority of respondents to the Aquatic Trends survey said that they do provide programming at their facilities, from learn-to-swim and water safety to aquatic exercise, water polo and more. Some 96.9% of respondents in 2023 said they currently provide programming at their facilities, down slightly from 97.5% in 2022.
A full 100% of respondents from schools, health clubs and Ys said they currently feature aquatic programs at their facilities. They were closely followed by colleges (98.4%) and rec centers (97.6%), and more than nine out of 10 respondents from parks (95.2%) and camps (91.4%) also said they provide aquatic programs at their facilities. (See Figure 17.)
The following are the types of programs covered in the survey and their prevalence among respondents’ offerings:
- Learn-to-Swim Programs (82.4%)
- Leisure Swim Time (79.6%)
- Lifeguard Training (79.4%)
- Lap Swim Time (74.5%)
- Aquatic Aerobics (63.5%)
- Water Safety Training (61.7%)
- Special Events (60.9%)
- Birthday Parties (60.7%)
- Youth Swim Teams (58.5%)
- Swim Meets & Other Competitions (52.8%)
- School Swim Teams (37.2%)
- Aquatic Programs for Those With Physical Disabilities (36.7%)
- Aquatic Programs for Those With Developmental Disabilities (35.6%)
- Water Walking (35%)
- Dive-In Movies (28.3%)
- Adult Swim Teams (23.1%)
- Aqua-Yoga & Other Balance Programs: (22.8%)
- Aquatic Therapy (20.4%)
- Diving Programs & Teams (19.4%)
- Water Polo (17.1%)
- Doggie Dips (16.3%)
- Collegiate Swim Teams (10.3%)
- Ninja Competitions (0.6%)
Programs that saw an increase of at least two percentage points over 2022 include: dive-in movies (up 4.5 percentage points from 23.8%); aquatic programs for those with physical disabilities (up 4.4 from 32.3%); and aquatic programs for those with developmental disabilities (up 4.4, from 31.2%).
As always, respondents from Ys were the most likely to offer many different types of aquatic programming. Respondents from Ys were the most likely to include learn-to-swim programs, lifeguard training, aquatic aerobics, water safety training, special events, birthday parties, aquatic programs for those with physical disabilities, and aquatic programs for those with developmental disabilities.
Park respondents were the most likely to offer doggie dips. Those from colleges were the most likely to offer dive-in movies, adult swim teams, water polo, and collegiate swim teams. School respondents were the most likely to include youth swim teams, swim meets and other competitions, school swim teams, and diving programs and teams. 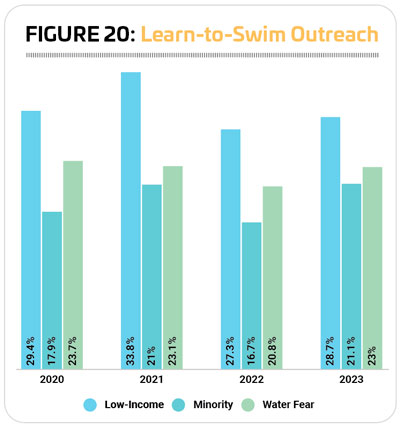 Respondents from health clubs were the most likely to offer leisure swim time, lap swim time, water walking, aqua-yoga and other balance programs, and aquatic therapy. Respondents from camps were the most likely to include ninja competitions.
Around one-third (33.4%) of respondents in 2023 said that they had plans to add aquatic programs at their facilities over the next three years. This is down slightly from 2022, when 34.6% had such plans, but still well above the numbers reported for 2021 (23.1%) and 2020 (25.5%).
Respondents from colleges and rec centers were the most likely to indicate that they would be adding aquatic programming at their facilities. Some 42.6% of college respondents and 40.5% of rec center respondents said they had such plans, up from 28.8% and 30.2%, respectively. At least one-third of respondents from Ys (35.4%) and health clubs (33.3%) also said they would be adding aquatic programs. Fewer respondents from parks (31.4%) and schools (30.4%) had plans to add programs. Camp respondents were the least likely to be planning to add aquatic programs, though 17.1% of them did have such plans. (See Figure 18.)
The top 10 most commonly planned program additions include:
- Programs for those with physical disabilities (planned by 31.3% of those who will be adding programs, down from 38.9% in 2022)
- Programs for those with developmental disabilities (28.6%, down from 33.9%)
- Aqua-yoga and other balance programs (25.3%, down from 28.3%)
- Dive-in movies (23.6%, down from 33.3%)
- Aquatic therapy (22.5%, up from 21.1%)
- Aquatic aerobics (20.3%, down from 23.9%)
- Special events (19.8%, not measured in 2022)
- Water walking (18.7%, up from 15.6%)
- Adult swim teams (17%, up from 12.8%)
- Youth swim teams (16.5%, up from 15.6%)
 Learn-to-swim programs are often the centerpiece and main focus of pool programming, and for good reason. The USA Swimming Foundation reports that drowning is still the leading cause of unintentional death in the U.S. for kids between 1 and 4 years old, and the second leading cause for kids younger than 14, and more than one-third of adults in the U.S. can’t swim the length of a pool. Meanwhile, just one month of formal swimming lessons reduces the risk of drowning by 88%, making learn-to-swim programs an essential foundation for all aquatic activities.
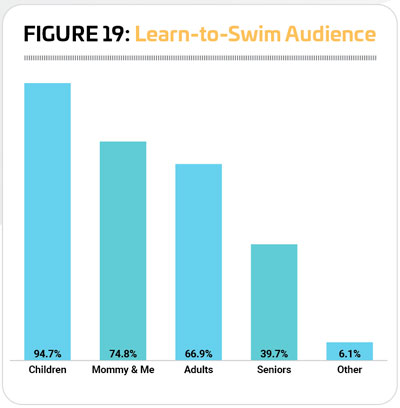
We asked the 82.4% of Aquatic Trends survey respondents who offer learn-to-swim programs to tell us more about the audience they reach with their programs. The vast majority—94.7% of respondents—of those who currently provide swimming lessons said they have programs for children 17 and younger, up slightly from 93.5% in 2022. Another 74.8% said they have swimming lessons designed for parents and babies or toddlers, such as mommy (or daddy) and me classes, down from 77.1% in 2022, but still above the 71.9% reported in 2021. Two-thirds (66.9%) provide learn-to-swim programs for adults and up, up from 65.7% in 2022, and 39.7% said they offer learn-to-swim specifically for seniors, up from 35.4% in 2022. Another 6.1% called out “other” audiences for their swim lessons, including adaptive swimming, swimming lessons for patrons with disabilities and one respondent who specifically noted that they provide free lessons to all children in their local community, a laudable achievement! (See Figure 19.)
There are many factors that have an influence on whether someone learns to swim or not, including whether their parents learned to swim, socioeconomic status and more. A 2017 USA Swimming report found that 79% of children in low-income families have little to no swimming ability, and 64% of black children, and 45% of Hispanic children have little to no swimming ability, compared with 40% of white children. Various grants and programs across the country have made it 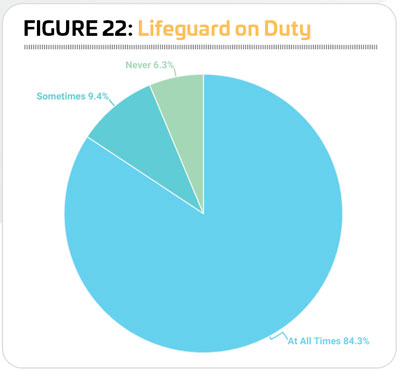 their mission to remove the barriers to learn-to-swim programs for minorities and low-income communities. In addition, there are programs that aim to work with people who have a fear of the water, helping them overcome their phobias and learn to swim.
The number of respondents to the Aquatic Trends survey who are involved in these types of outreach programs has remained relatively consistent over the past few years. In 2023, 28.7% of respondents said they were involved in outreach to low-income patrons, up from 27.3% in 2022. Another 21.1% are engaged in minority outreach, up from 16.7% in 2022. And 23% said they offer learn-to-swim programs designed to help people overcome their fear of the water, up from 20.8% in 2022. (See Figure 20.)
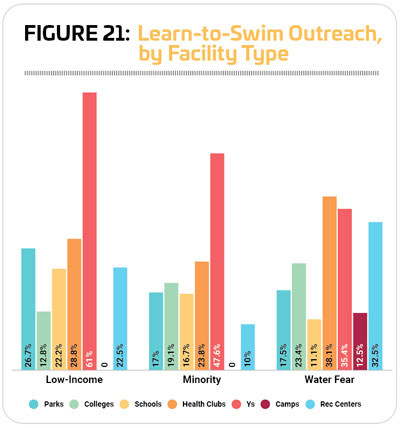
Ys were by far the leader when it comes to outreach to low-income audiences, with 61% of Y respondents indicating they were involved in low-income outreach, up from 58.3% in 2022. They were followed by health clubs (28.8%) and parks (26.7%). The same pattern holds true for outreach to minority audiences, with nearly half (47.6%) of Y respondents indicating they aimed to help get more minority audiences involved in learning to swim. Again, health clubs followed (at 23.8%.). Health clubs (38.1%), Ys (35.4%) and rec centers (32.5%) were the most likely to have programs that help people overcome their fear of the water and learn to swim. (See Figure 21.)
Water Safety
Provided by 61.7% of survey respondents, water safety training can provide an important foundation to help prevent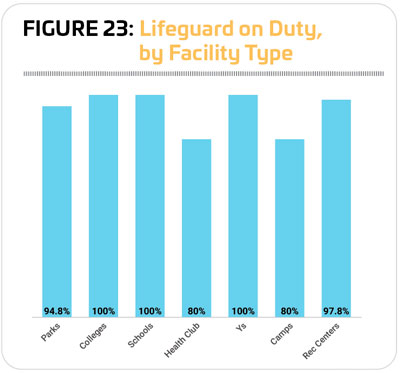 drowning, providing community members with the water skills they’ll need around any body of water, from a backyard pool to the beach and beyond. But within the literal or proverbial walls of the aquatic facility, the main responsibility for preventing fatal drownings lies with the lifeguarding staff.
The majority of respondents—93.7%—said a lifeguard is on duty at least some of the time during their operating hours, representing virtually no change from 2022 (93.8%). Some 84.3% said a lifeguard is on duty at all times the facility is open (representing no change from 2022, when 84.4% had a lifeguard on duty at all times), and 9.4% said a lifeguard is on duty during at least some hours of operation, representing no change from 2022. Just 6.3% said a lifeguard is never on duty at their facilities, compared to 6.2% in 2022. (See Figure 22.)
All 100% of the respondents from colleges, schools and Ys said they have a lifeguard on duty at least some of the time, with 97.6% of Ys, 91.8% of colleges and 83.3% of schools indicating that a lifeguard is always on duty when their aquatic facilities are open. Respondents from health clubs and camps were the least likely to have a lifeguard on duty, though a majority of each group (80%) said a lifeguard is on duty at least some of the time. (See Figure 23.)
A layered approach to drowning is the best approach, and while having a lifeguard on duty is the most essential practice when it comes to keeping your swimmers safe, other methods and technologies can also help. The tools most often used to prevent drowning by respondents to the Aquatic Trends survey include:
- Lifeguard on Duty: 93.7%, up from 92.3% in 2022
- Life Preservers Required for Less-Skilled
- Swimmers: 44%, up from 40.9%
- Video or Other In-Pool System for Detecting Swimmers in Trouble: 5.8%, up slightly from 5.2%
- Safety Device That Sounds an Alarm When Submerged: 3.1%, up from 2.7%
- Other: 5.3%
- None: 4.5%, up from 3.7%
 The COVID-19 pandemic had a dramatic impact on lifeguard staffing, with trainings interrupted and facility closures rampant. Over the past few years, we’ve been following these challenges. The good news? Facilities have been recovering lost ground, and fewer facilities in 2023 said they had difficulty hiring lifeguards.
While more than half (53.3%) of respondents in 2023 said that their facility had been affected by lifeguard staffing difficulties, this number is down significantly from 2022, when more than two-thirds (67.3%) were experiencing such difficulties. Respondents from colleges and Ys were the most likely to indicate they were having trouble hiring lifeguards, with 75.4% of college respondents and 67.9% of Y respondents reporting they were having difficulty. On the other end of the spectrum, camps and health clubs were the least likely to be having a hard time finding lifeguards, with 22.9% of camp respondents and 40% of health club respondents agreeing that it was a problem.
Without a reliable staff of lifeguards to watch over swimmers’ safety, aquatic facilities have been forced to adapt in various ways. Nearly half (44.6%) said they had reduced their facility’s hours of operation. Much smaller numbers of respondents said they had cut their season short (13.9%) or kept a pool closed (8.5%) due to their difficulty in finding lifeguards.
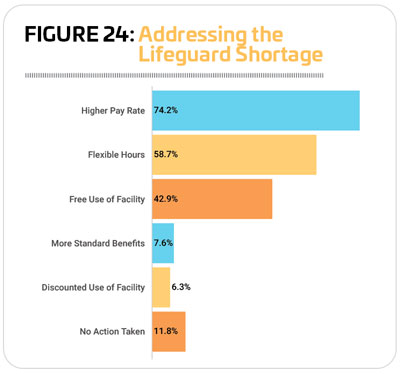
We also asked respondents about the actions they had taken to attract more lifeguards to staff their facilities. Nearly three-quarters (74.2%) said that they had offered a higher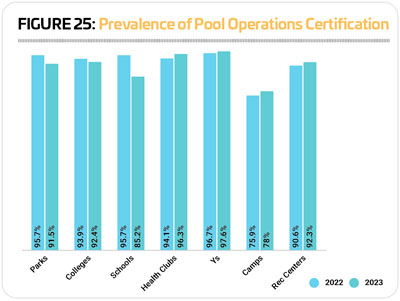 rate of pay in order to attract more potential lifeguards. This is up from two-thirds (66.7%) in 2022. Another 58.7% said they offered flexible hours (up from 53.8%), and 42.9% said they had offered free use of their facilities, up from 35.2%. (See Figure 24.)
Some respondents offered up other ideas for attracting more lifeguards, including active recruitment, sign-on bonuses and bonuses for lifeguards who stayed with the job a specified amount of time, providing bonuses, providing free training and certification, providing referral incentives to existing staff, and more.
Hiring, training and certifying lifeguards is one side of the aquatic safety staffing coin. The other side involves professionals who are educated and certified as knowledgeable in the field of aquatics. Certifications such as the Certified Pool & Spa Operator (CPO) or Aquatics Facility Operator validate industry professionals’ acumen, and require continuing education to ensure aquatic professionals are knowledgeable when it comes to the latest trends and practices in aquatic operations.
In 2023, more than nine out of 10 (90.8%) respondents said that they or someone at their facility has an aquatic management or pool operations certification, down from 93.1% in 2022.
Respondents from health clubs (96.3% vs. 94.1%), Ys (97.6% vs. 96.7%), camps (78% vs. 75.9%) and rec centers (92.3% vs. 90.6%) were slightly more likely to have these 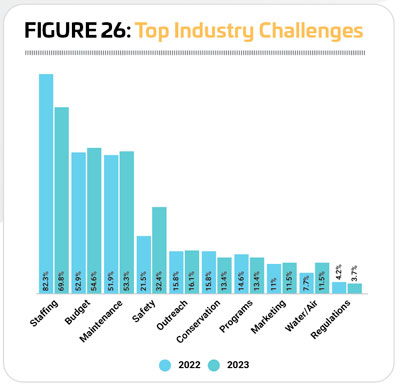 certifications in 2023 than in 2022. The opposite holds true for respondents from parks (91.5% vs. 95.7%), colleges (92.4% vs. 93.9%) and schools (85.2% vs. 95.7%). (See Figure 25.)
Industry Challenges
While the number of respondents naming staffing issues as a top industry concern decreased in 2023, it still is the No. 1 issue for respondents to the Aquatic Trends report. Nearly seven out of 10 (69.8%) respondents in 2023 said that staffing issues were a top industry concern, down from 82.3% in 2022. More than half (54.6%) said budgetary issues were a top concern, up slightly from 52.9%, and just slightly fewer (53.3%) named equipment and facility maintenance as a top concern, up from 51.9%. (See Figure 26.)
Respondents from colleges, Ys and rec centers were the most likely to name staffing issues as a top concern for the industry. Some 82% of college respondents, 81.7% of Y respondents and 76.2% of rec center respondents said staffing is a top industry concern. Respondents from colleges (65.6%) and schools (65.2%) were the most likely to say that budgetary issues were a top concern. Equipment and facility maintenance was most likely to be a top concern for respondents from camps (61.8%) and parks (58.7%). RM
