
With more than a decade of industry-wide research under our belt, in 2018, Recreation Management launched our first Aquatic Trends Report. Last year, we expanded further on this concept, and created our first pull-out report on aquatic trends.
With their complex operations, unique challenges and programming and dedicated staff, swimming pools and other aquatic facilities provide a fertile field for study. We already provide a great deal of information on aquatic facilities—from budgets to construction plans and beyond—in our annual State of the Industry Report, which is published every June. This Aquatic Trends Report aims to dive a little deeper into the aquatic segment of the industry, whether that involves a park district pool or a privately owned waterpark, a college natatorium or a splash pad at a sleepaway camp.
Welcome to our Aquatic Trends Report. In these pages, we expand on the information covered in our annual State of the Industry Report to discuss more specific trends within the aquatics industry, from the biggest challenges to equipment and programming trends and more. This report does not replace the information covered in the State of the Industry Report. The June issue will still include aquatics information, including construction trends and more. But here, you'll find more detail about systems used for keeping pool water safe and clear, trends in resource conservation, pool features, programming, water safety, awareness of things like ADA guidelines and the Model Aquatic Health Code, and more.
Survey Methodology
This report is based on a survey conducted for Recreation Management by Signet Research Inc., an independent research company. An email was broadcast and respondents were invited to participate. From the launch of the survey on Oct. 4, 2019, to the closing of the survey on Nov. 6, 2019, 713 completed surveys were received from respondents with aquatic facilities (out of 1,022 total returns). The findings of this survey may be accepted as accurate, at a 95 percent confidence level, within a sampling tolerance of approximately +/- 3.7 percent.
Let's start by covering some basic information to give you a better idea of just who is represented by the 713 survey respondents whose facilities included aquatic elements—anything from a hot tub or swimming pool to a full-blown aquatic park or waterpark with slides, rides, lazy rivers and more.
Respondents were found in all regions of the United States, with the greatest percentage reporting in from the Midwest. Nearly three in 10 (29.3%) respondents said they were from Illinois, Indiana, Iowa, Kansas, Michigan, Minnesota, Missouri, Nebraska, North Dakota, Ohio, South Dakota or Wisconsin. (See Figure 1.)
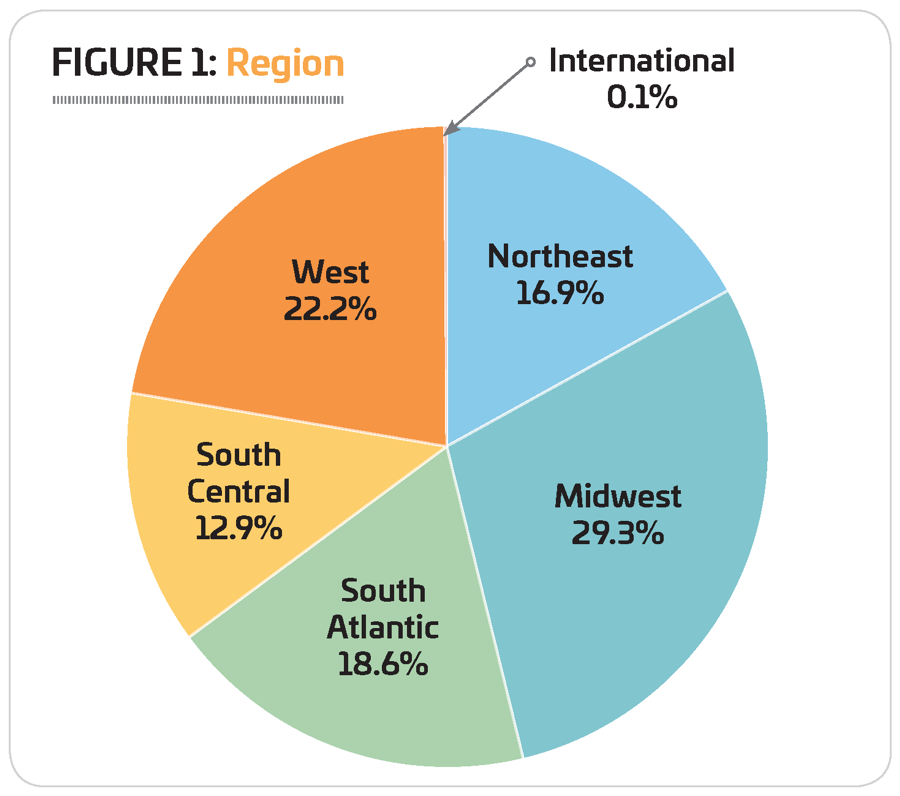
The next largest region was the West, with 22.2%. This includes Alaska, Arizona, California, Colorado, Hawaii, Idaho, Montana, Nevada, New Mexico, Oregon, Utah, Washington and Wyoming.
The South Atlantic region was home to 18.6% of survey respondents. This includes Delaware, Florida, Georgia, Maryland, North Carolina, South Carolina, Virginia, Washington, D.C., and West Virginia.
Some 16.9% of survey respondents said they were from the Northeastern states. This includes Connecticut, Maine, Massachusetts, New Hampshire, New Jersey, New York, Pennsylvania, Rhode Island and Vermont.
The South Central region was represented by 12.9% of respondents. This region includes Alabama, Arkansas, Kentucky, Louisiana, Mississippi, Oklahoma, Tennessee and Texas.
Just 0.1% of respondents said they were from outside the United States.
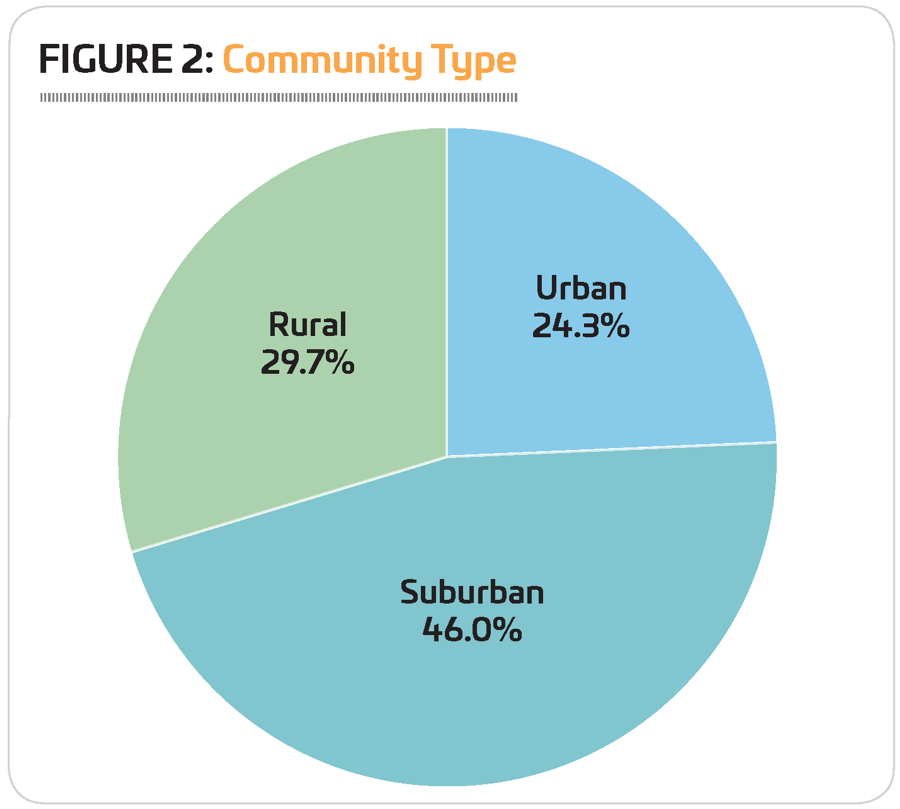
We also asked respondents to indicate the type of community they serve. Nearly half (46%) said they represented suburban communities. Smaller numbers were from rural areas (29.7%) and urban communities (24.3%). (See Figure 2.)
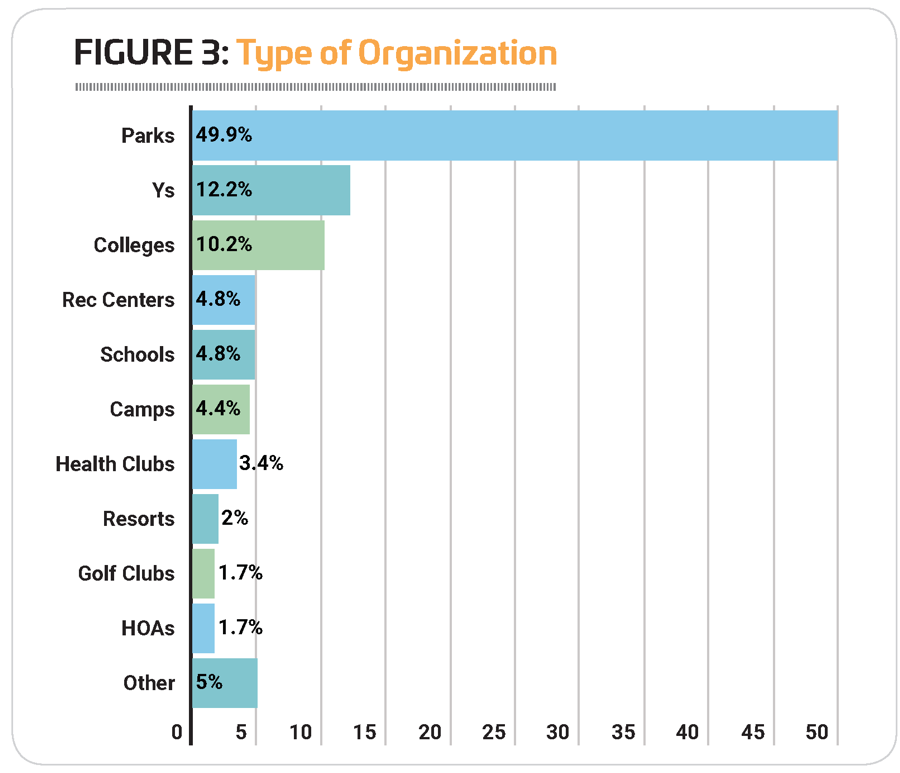
When it comes to the type of organization respondents work for, parks and recreation departments and districts were most prevalent, with nearly half (49.9%) of respondents indicating they work for this type of organization. They were followed by: YMCAs, YWCAs, JCCs and Boys & Girls Clubs (12.2%); colleges and universities (10.2%); community or private recreation and sports centers (4.8%); schools and school districts (4.8%); campgrounds, RV parks and private or youth camps (4.4%); sports, health and fitness clubs, and medical fitness facilities (3.4%); resorts and resort hotels (2%); golf or country clubs (1.7%); and homeowners' associations (1.7%). Another 5% were from other types of organizations, including churches and military installations, among others. (See Figure 3.)
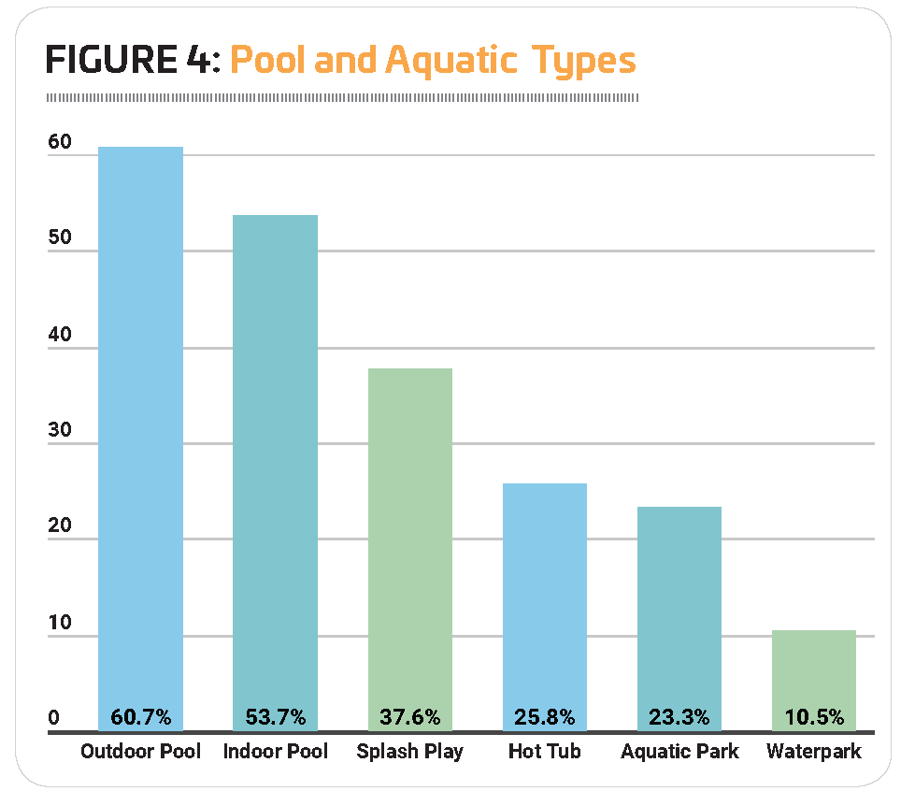
From indoor and outdoor pools to splash play and full-blown waterparks, different types of aquatic facilities were well represented, with the predominant type being outdoor swimming pools and indoor swimming pools. More than six in 10 (60.7%) respondents said they currently have at least one outdoor pool, and more than half (53.7%) have at least one indoor swimming pool. Splash play areas were also popular, with 37.6% of respondents indicating they had at least one. Some 25.8% had at least one hot tub, spa or whirlpool. Slightly less than a quarter (23.3%) said they had at least one aquatic park (with a focus primarily on swimming pools and other aquatic activities). And 10.5% said they had at least one waterpark (with a focus primarily on rides and waterslides). (See Figure 4.)
Outdoor swimming pools were most commonly found among respondents from camp facilities, where 90.3% said they had at least one outdoor pool. They were followed by parks respondents, 80.9% of whom had at least one outdoor pool, and rec centers, at 70%.
Indoor pools were most common for respondents from schools (93.9% had at least one indoor pool), colleges and universities (90%), and Ys (89.4%).
Splash play areas were most commonly found among park facilities, where 65.2% of respondents said they had at least one splash play area. They were followed by rec centers, 55.2% of which had at least one splash play area.
Hot tubs, spas and whirlpools were most prevalent among Ys, where nearly three-quarters (73.3%) said they had at least one hot tub. They were followed by rec centers (51.7%) and colleges (32%).
Aquatic parks were most commonly found among the facilities of respondents from rec centers (46.2% said they had an aquatic park) and parks (42.1%).
Finally, waterparks were most prevalent among the facilities of rec center respondents (34.6% of whom said they had a waterpark) and park respondents (18.4%).
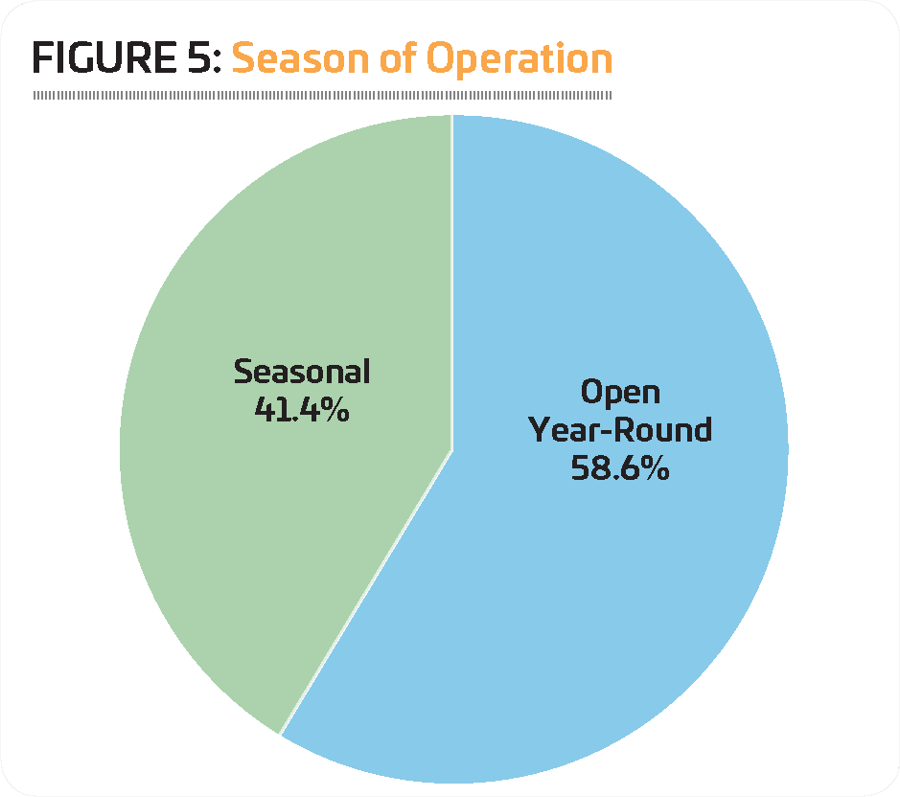
When it comes to season of operation, a majority of respondents (58.6%) said their aquatic facilities are open year-round. Some 41.4% said their operations are seasonal. (See Figure 5.)
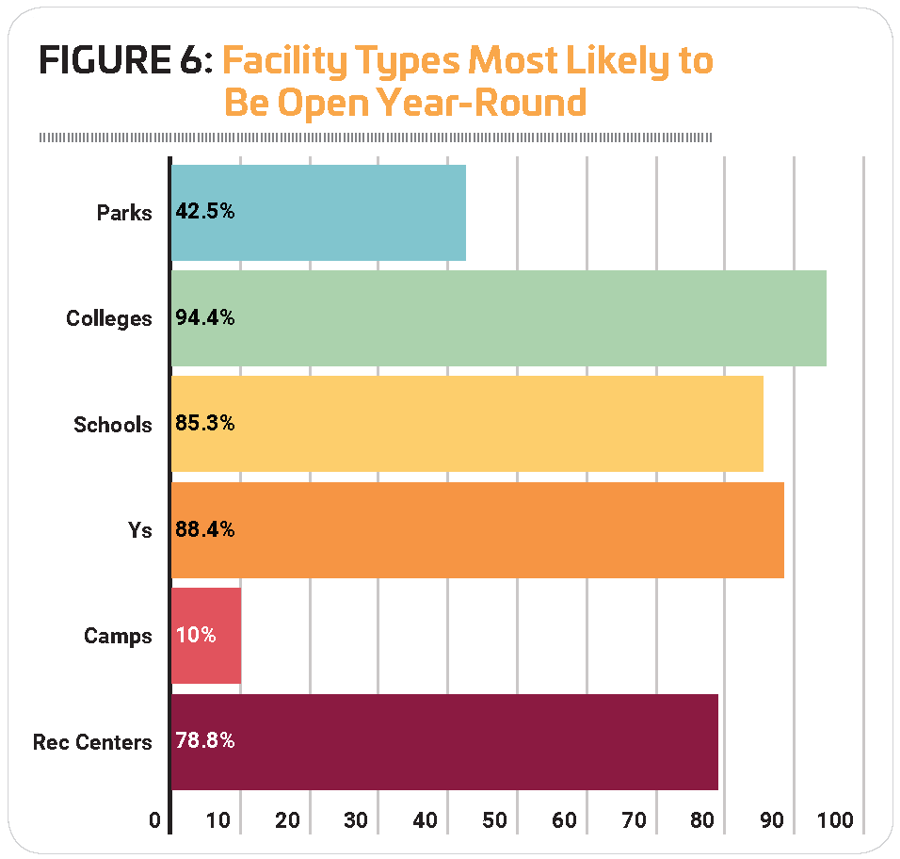
Respondents from colleges and Ys were the most likely to indicate that their aquatic facilities are open year-round. Some 94.4% of college respondents and 88.4% of Y respondents said they had year-round operations. They were followed by schools (85.3%) and rec centers (78.8%). Respondents from parks and camps were less likely to report that their aquatic facilities were open year-round, with just 42.5% of parks and 10% of camps indicating they had year-round aquatics. (See Figure 6.)
Obviously, indoor pools are more likely to be open year-round than outdoor pools. Among respondents who had only indoor facilities, 94.9% said their aquatic facility was open year-round. For those with outdoor-only facilities, 17.5% said they were open for business all year long.
Among respondents with seasonal operations, May was the most popular month for opening the aquatic season, and September the most likely month for closing operations for the year. Some 26.6% of all respondents said their season begins in May, while 9.9% said they open for the season in June. Some 22.6% of respondents said they close for the season in September, while 15.3% close the season in August.
Money Matters
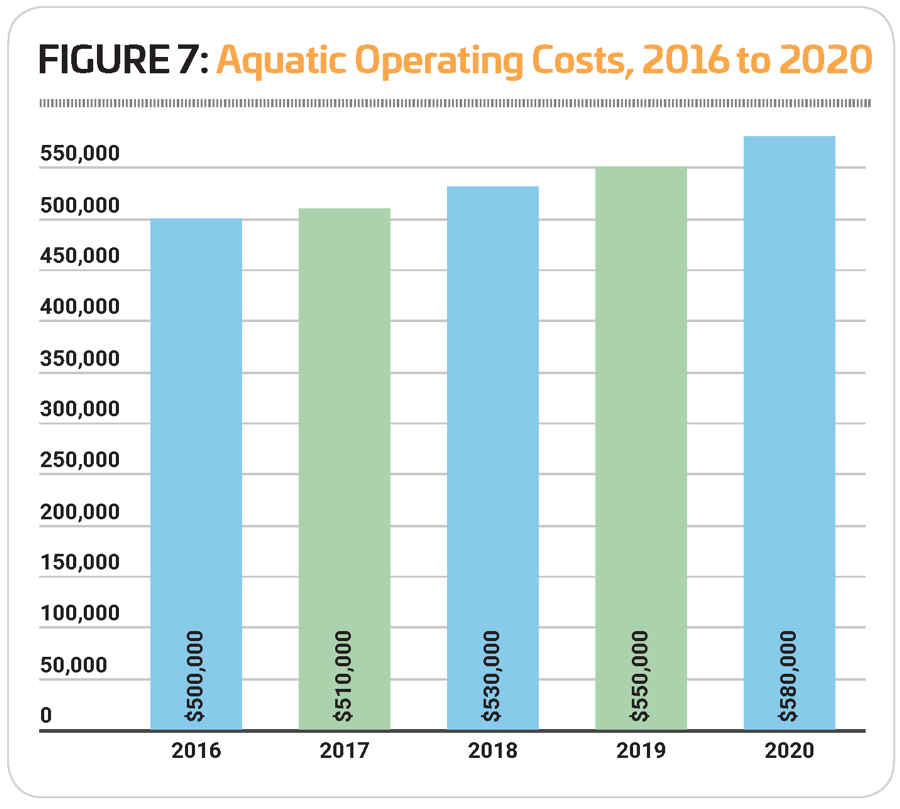
The average operating costs for aquatic facilities increased 3.9% from 2017 to 2018, from an average of $510,000 to $530,000. Looking forward, respondents expect operating costs to increase another 9.4% between 2018 and 2020, from $530,000 to $580,000. (See Figure 7.)
Respondents from parks and Ys had the highest average operating costs in 2018, with parks spending an average of $670,000 and Ys spending $580,000 in that year. They were followed by schools ($400,000) and rec centers ($370,000). Camps and colleges had the lowest operating costs, with camps spending an average of $100,000 in 2018 and colleges spending $260,000. (See Figure 8.)
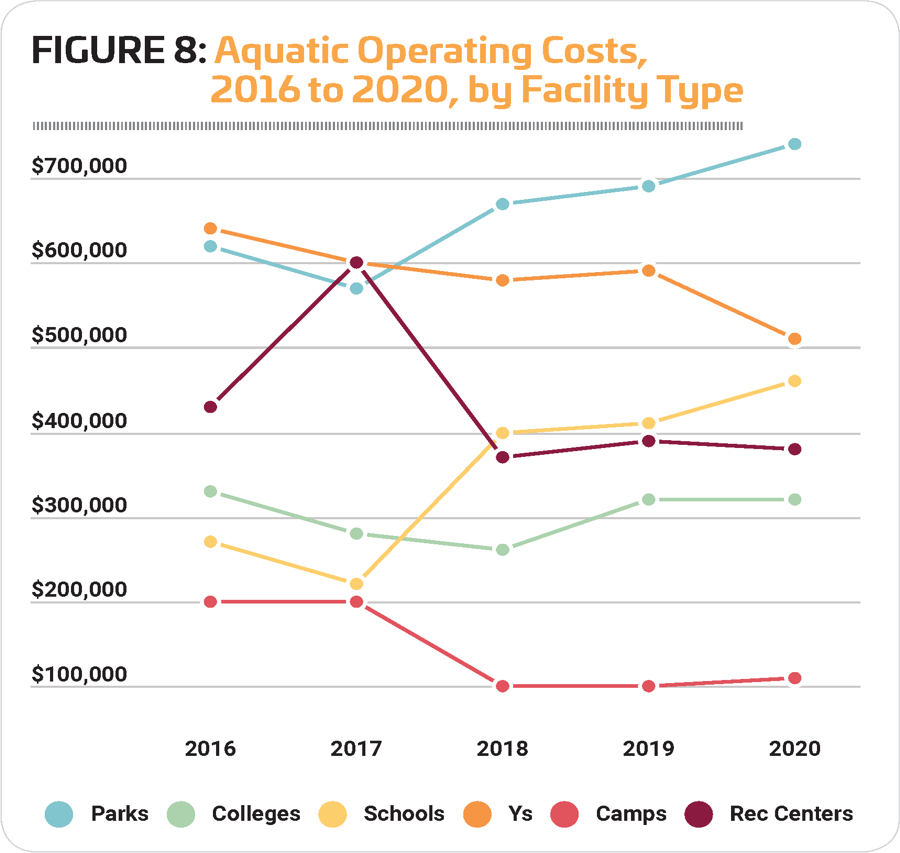
From 2018 to 2019, the greatest increases in operating expenses are expected among respondents from colleges, who projected a 23.1% increase from an average of $260,000 to $320,000 in 2019. They were followed by respondents with much more modest increases, with rec centers expecting a 5.4% increase from $370,000 to $390,000; parks projecting a 3% increase from $670,000 to $690,000; schools expecting a 2.5% increase from $400,000 to $410,000; and Ys projecting a 1.7% increase from $580,000 to $590,000.
From 2018 to 2020, colleges also expect the greatest increase, but this is only because they projected no change in their operating cost from 2019 to 2020, resulting in a 23.1% increase from 2018 to 2020. Increases of greater than 10% are also expected among respondents from schools (a 15% increase to $460,000); parks (up 10.4% to $740,000); and camps (up 10% to $110,000). Smaller increases are expected by those from rec centers, who projected a 2.7% increase to $380,000. Ys actually projected a 12.1% drop in their operating costs from 2018 to 2020, to an average of $510,000.
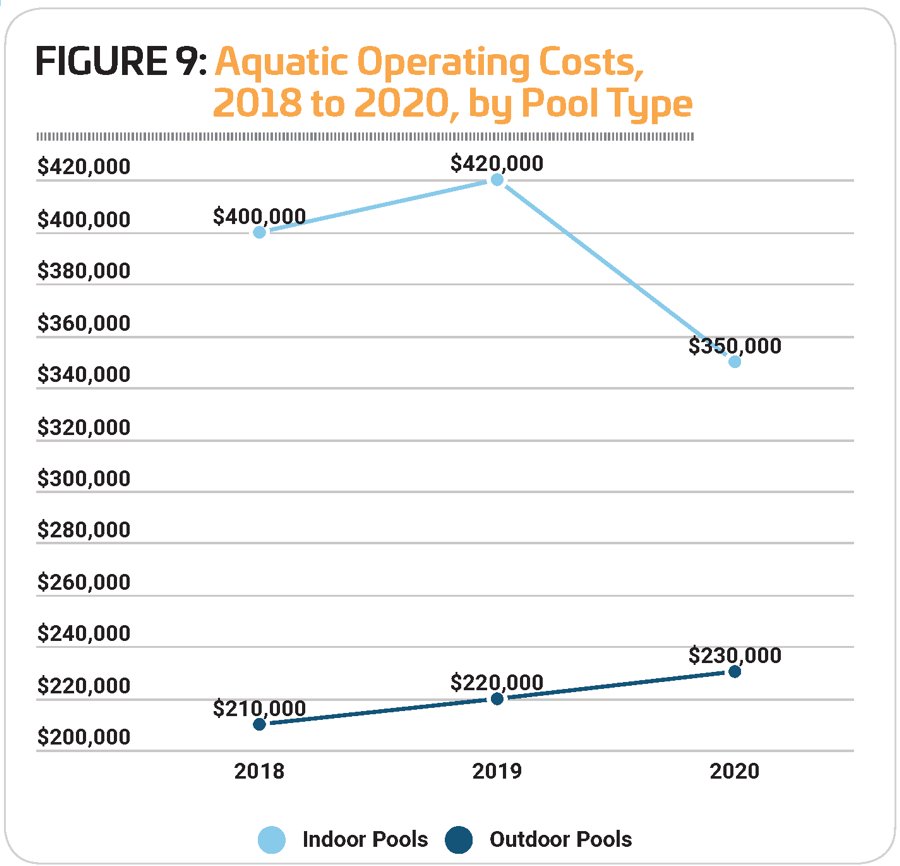
This year, we also broke out facilities that only included indoor or outdoor pools and compared various factors. In 2018, respondents with indoor pools only reported a 90.5% higher average operating cost than those with outdoor pools only, with indoor pool respondents spending an average of $400,000 and outdoor respondents spending $210,000. That said, they reported a similar rate of increase in their operating costs from 2018 to 2019, with indoor respondents seeing a 5% increase to $420,000, and outdoor pool respondents reporting a 4.8% increase, to $220,000. (See Figure 9.)
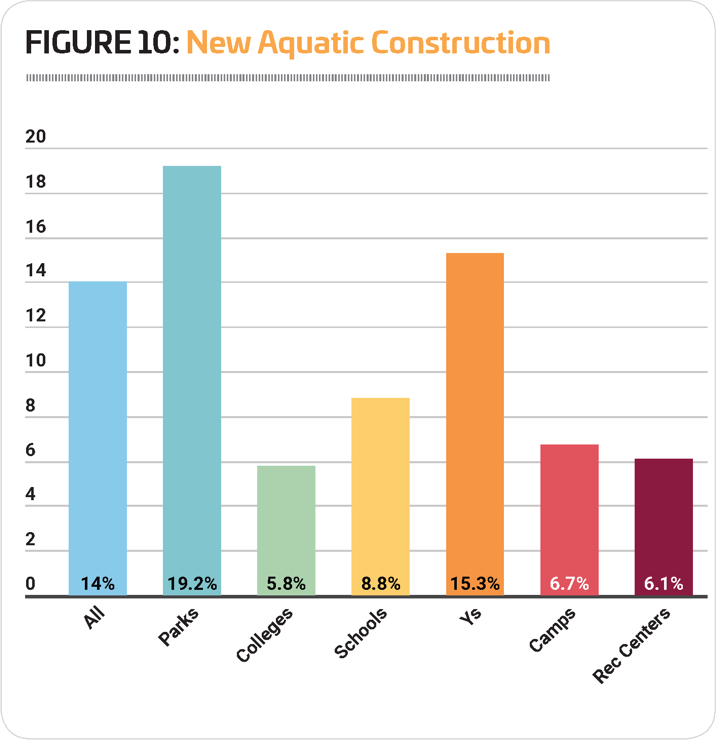
This year we asked respondents about various actions they had taken in regard to their aquatic facilities, from building new aquatic facilities to closing existing pools. Some 14% of all respondents said they had built a new aquatic facility in the past three years. Respondents from parks were the most likely to have done so, with nearly one-fifth (19.2%) indicating they had built a new aquatic facility. They were followed by Ys (15.3%) and schools (8.8%). (See Figure 10.)
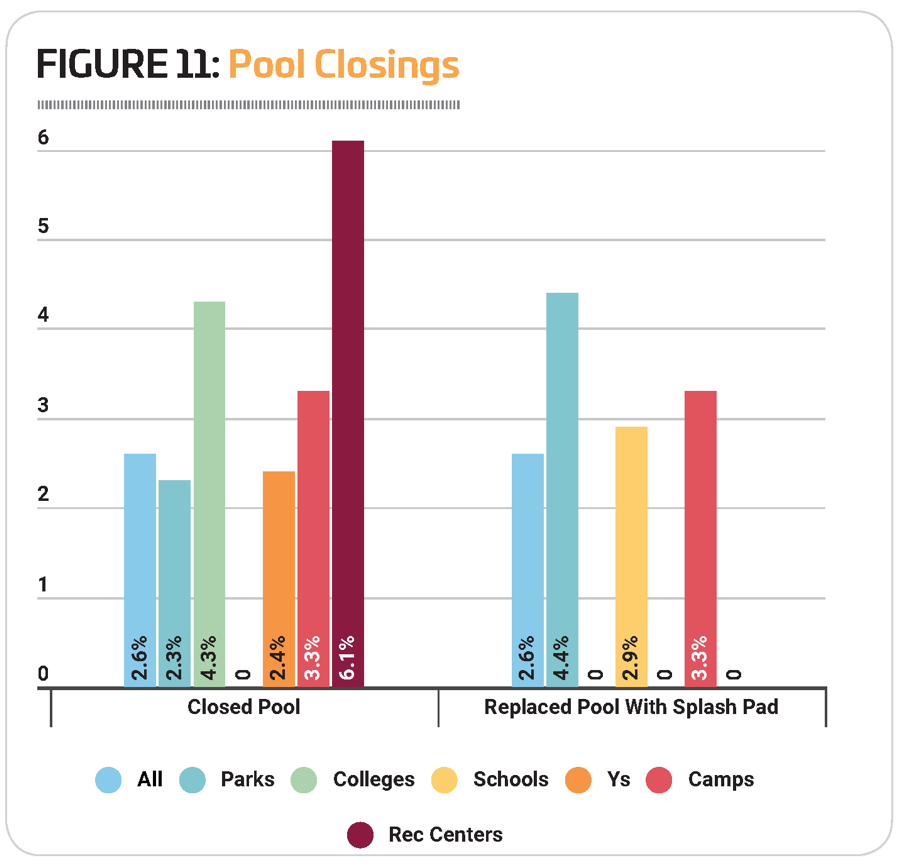
Pool closings were a fairly rare event, with only 2.6% of all respondents indicating they had closed a pool permanently without constructing a replacement facility, and another 2.6% indicating they had closed a swimming pool and built a splash pad in its place. Pool closings were most common among respondents at rec centers, where 6.1% said they had closed a pool without replacing it. They were followed by colleges (4.3%) and camps (3.3%). Parks were the most likely to report that they had closed a pool and replaced it with a splash pad, with 4.4% of park respondents indicating they had done so. They were followed by camps, 3.3% of which had closed a pool and built a splash pad in its place. (See Figure 11.)
Systems & Resources
We asked respondents to indicate the various types of systems used to maintain water quality in their pools, as well as their use of secondary disinfection and their resource-conservation goals.
When it comes to pool filtration, sand filters are still dominant, with nearly 68.1% of respondents indicating they currently use sand filters. This is down from 72.2% in 2018. Another 20.1% use diatomaceous earth (D.E.) filters, up from 18.1%, and 9.4% are using regenerative media filters (RMFs), up from 9%. (See Figure 12.)
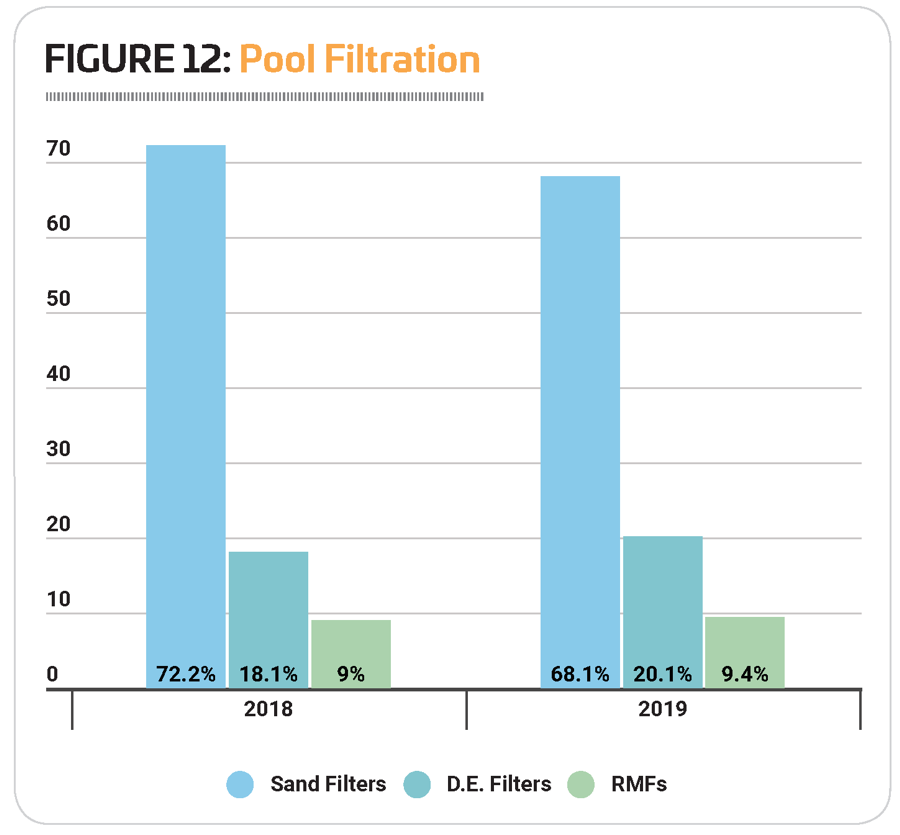
Comparing filtration in indoor vs. outdoor pools, respondents who have indoor pools only are more likely than those with outdoor pools to use sand filters or RMFs, while outdoor pools are more likely to use D.E. filters. Some 62.1% of indoor pool respondents said they use sand filters, compared to 55.1% of outdoor pool respondents; and while 6% of indoor respondents use RMFs, 4.2% of outdoor respondents use them. Conversely, 22.9% of outdoor pool respondents said they rely on D.E. filters, compared with just 12.9% of those representing indoor pools.
A majority of respondents—78.1%—said they currently use chlorination systems at their aquatic facilities, while 8.8% are using bromination systems. Tablet chlorinators are used by 35.2% of respondents, and 7.7% are using salt chlorine generators.
Looking forward, 14.7% of respondents said they had plans to add new systems or update existing systems at their aquatic facilities over the next three years. In regard to pool filtration, RMFs are the most commonly planned addition, with 24.8% of those respondents indicating they planned to add RMFs (up from 23.5% in 2018). They were followed by sand filters (20%) and D.E. filters (18.1%). In addition, 10.5% of those respondents said they plan to add salt chlorine generation, and another 10.5% are planning to add tablet chlorination.
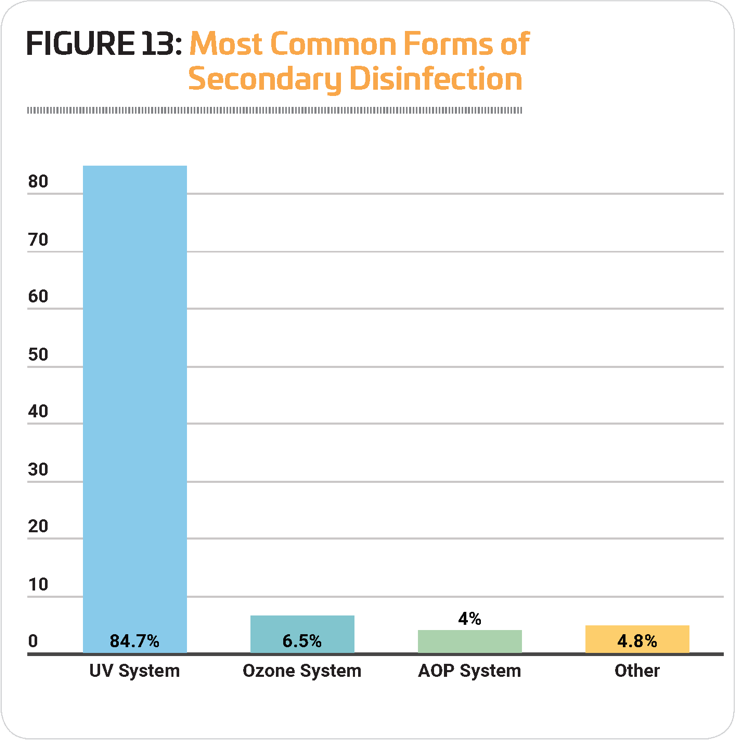
When it comes to secondary disinfection—recommended in the Model Aquatic Health Code (MAHC) as a way to improve water quality and prevent recreational water illnesses—36.4% of respondents indicated that they currently use some form of secondary disinfection. This is up from 32% in 2018. The majority of these—84.7%—are using UV systems, while another 6.5% use ozone systems. Some 4% said they use AOP (advanced oxidation process) systems, and 4.8% are using some other form of secondary disinfection. (See Figure 13.)
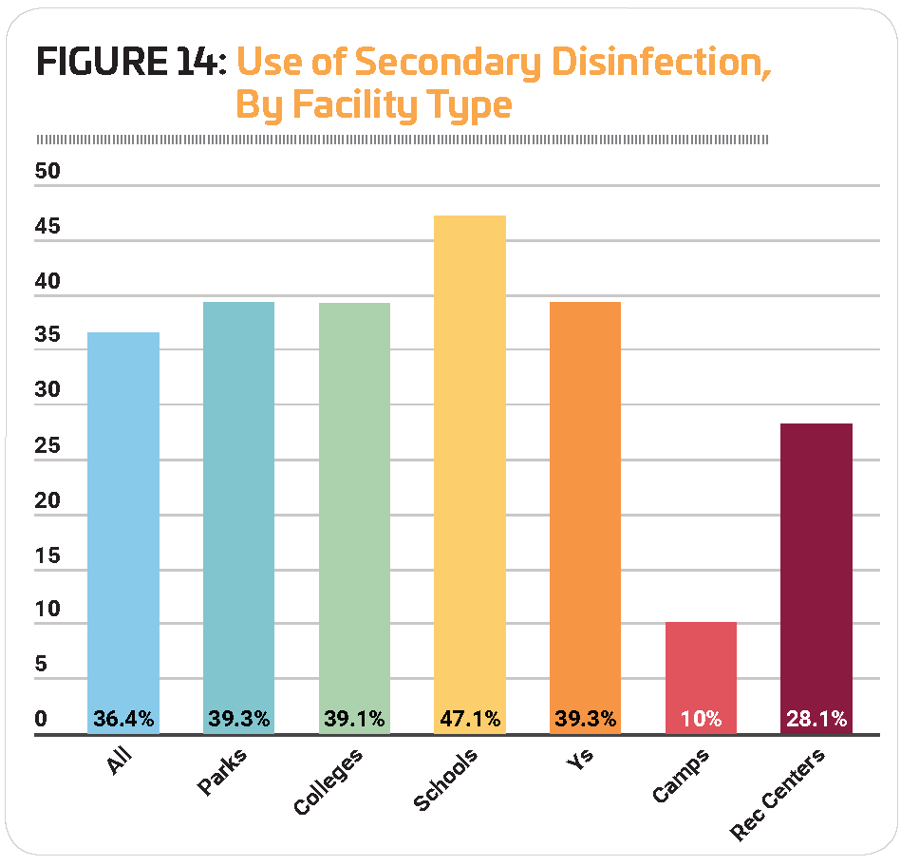
Respondents from schools were the most likely to report that they are currently using some form of secondary disinfection. Some 47.1% of school respondents said they use secondary disinfection at their facilities. They were followed by parks and Ys (39.3% of each group uses secondary disinfection), and colleges (39.1%). Camp respondents were the least likely to indicate that they use secondary disinfection, with just 10% indicating they do so. (See Figure 14.)
Respondents whose facilities have higher average operating costs are more likely to report that they use secondary disinfection than those with lower costs. A majority (63.9%) of those whose operating costs average more than $500,000 said they currently use secondary disinfection, up from 50.5% in 2018. For those whose operating costs average between $250,000 and $500,000, 33.9% currently use secondary disinfection. And for those whose costs average less than $250,000, 25.8% currently use secondary disinfection.
Respondents who have indoor pools only are much more likely to rely on secondary disinfection than those who have outdoor pools only. Some 39.1% of indoor pool respondents said they currently use secondary disinfection, compared with just 12.2% of those with outdoor pools. UV is by far the most common method used, with one-third (33%) of indoor pool respondents using UV, and 6.1% of outdoor pool respondents using UV as their secondary disinfection method.
Looking forward, among the 14.7% of respondents who are planning to make additions at their pools over the next few years, 46.7% plan to add UV systems (up from 37.1% in 2018), and 15.2% plan to add ozone (down from 18.2%). Another 14.3% said they are planning to add AOP systems.
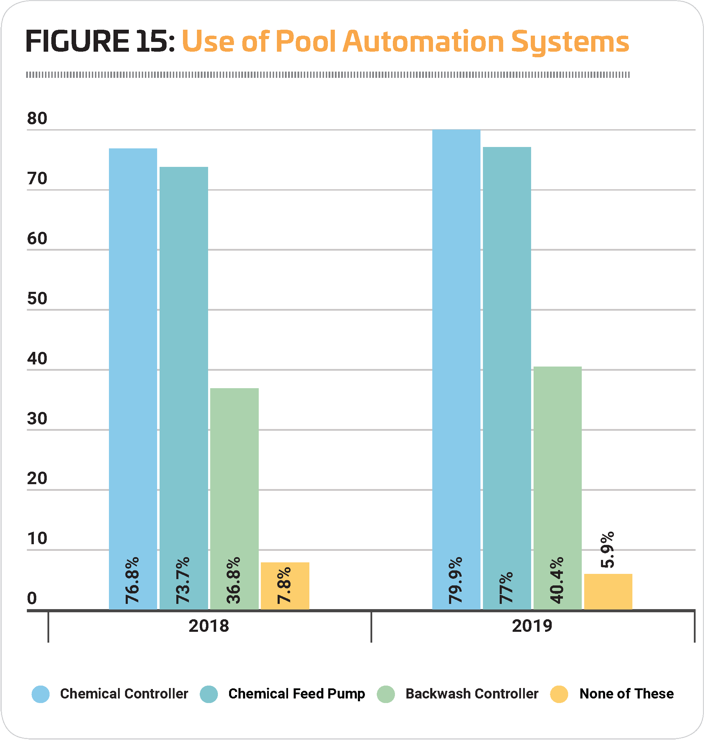
Pool automation systems were very common among survey respondents and have seen growing usage over the past couple of years. Some 79.9% of respondents said they currently use chemical controllers, up from 76.8% in 2018. Another 77% currently use a chemical feed pump (up from 73.7), while 40.4% use a backwash controller (up from 36.8%). (See Figure 15.)
When it comes to conservation of resources, a majority of respondents (71%) said they currently have strategies and tools in place to conserve energy, chemicals, water and more. More than half said they currently use strategies and tools to conserve energy (53.6%, up from 52.6% in 2018) and chemicals (52.3%, up from 51.6% in 2018). Another 43.4% said they aim to conserve water, down slightly from 44.8% in 2018.
Respondents from recreation centers were the most likely to report that they currently aim to conserve energy, chemicals and water. Some 74.2% of these respondents said they have conservation strategies and tools in place. They were followed by respondents from Ys (73.8%), parks (72.3%) and schools (70.6%). Camp respondents were the least likely to have conservation strategies and tools, though the percentage who do so grew from 46.9% in 2018 to 60.7% in 2019. They were followed by colleges, 66.2% of whom said they currently aim to conserve energy, chemicals and water.
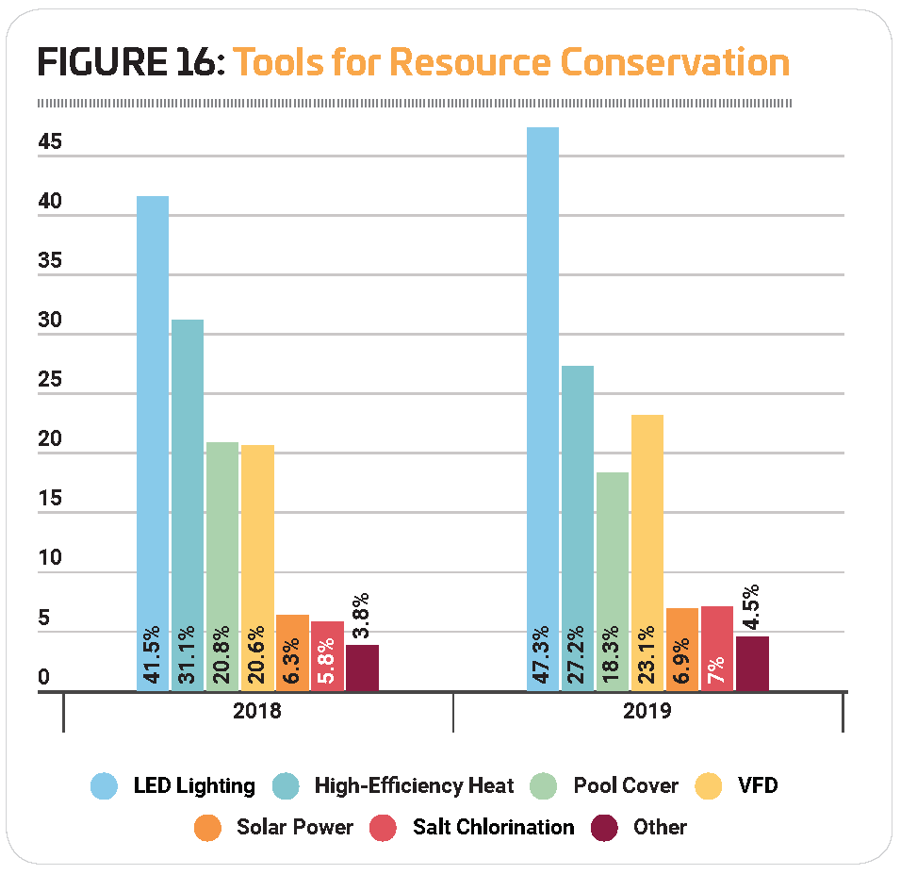
The most common tools used to conserve energy, chemicals and water at aquatic facilities included LED lighting (used by 47.3% of all respondents, up from 41.5% in 2018) and high-efficiency heaters (used by 27.2%, down from 31.1% in 2018). Another 23.1% rely on VFDs, and 18.3% use pool covers or blankets. (See Figure 16.)
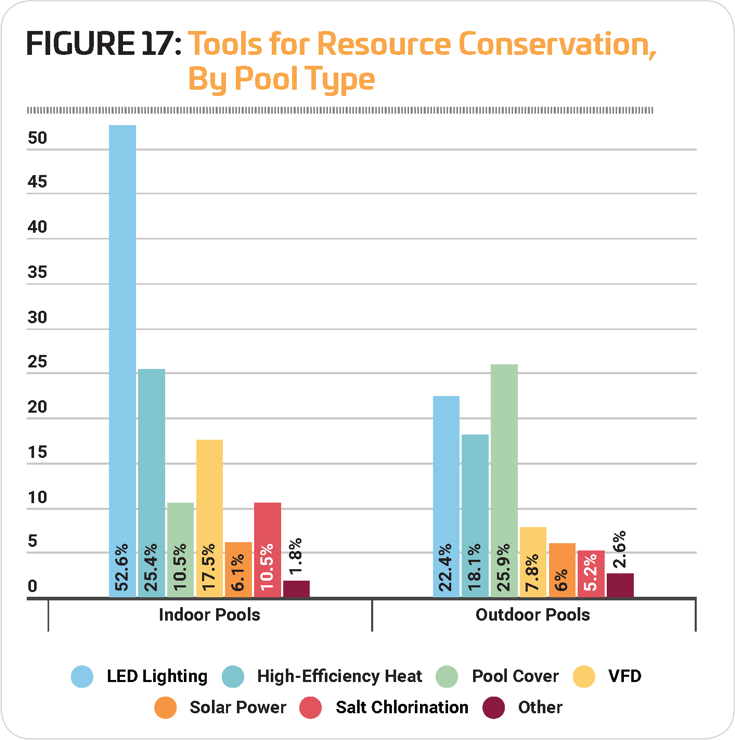
Respondents with indoor pools only were more likely than those with outdoor pools only to rely on things like LED lights, high-efficiency heat and VFDs, while outdoor-only respondents were more likely to use pool covers. Some 52.6% of indoor pool respondents said they currently use LED lights, compared with 22.4% of outdoor pool respondents. And, while 25.4% of indoor pool respondents use high-efficiency heat, 18.1% of outdoor pool respondents use them. Similarly, 17.5% of indoor pool respondents use VFDs, and 10.5% use salt chlorination, compared with 7.8% and 5.2% of outdoor pool respondents, respectively. On the other hand, while 25.9% of outdoor pool respondents said they currently use a pool cover, 10.5% of indoor pool respondents use them. (See Figure 17.)
Aquatic Facility Features
From water playgrounds and waterslides to poolside cabanas, lifeguard stands and beyond, outfitting an aquatic facility can provide excitement for patrons and more ways to expand aquatic programming. A wide variety of products is available, with new ideas continually being introduced to the market, all of which can help make a simple pool more attractive to swimmers or help complete a waterpark or aquatic park that can attract a regional audience. Other features might be added to provide an outlet for competition or fitness programing, as well as improving accessibility and instruction.
Here are some of the more common features found among aquatic respondents' facilities:
- Lifeguard Stand: 80.5%
- Lane Lines: 77.3%
- Pool Lift or Other Accessibility Equipment: 65.4%
- Pool Exercise Equipment: 51.5%
- Diving Boards: 47.5%
- Starting Platforms: 46.9%
- Pool Slides: 45.3%
- Shade Structures: 41.4%
- Zero-Depth Entry: 39.8%
- Water Basketball Equipment: 30.4%
- Scoreboard: 25%
- Water Playground: 22.1%
- Pool Inflatables: 21.4%
- Water Polo Equipment: 19.6%
- Water Volleyball Equipment: 17.6%
- Teaching Platform: 15.7%
- Lazy River: 14.4%
- Diving Platforms: 13%
- Swim Platform 9.4%
- Poolside Cabanas: 9.1%
- Swim Wall or Pool Bulkhead: 8.8%
- Poolside Climbing Wall: 7.6%
- Lily Pads/Water Walk: 6.5%
- Underwater Treadmill or Bike: 3.8%
- River Raft Ride: 2.6%
- Wave Pool: 2.2%
- Surf Machine: 0.7%
- Water Coaster: 0.6%
Respondents from parks were the most likely to include many types of features at their facilities. They were more likely than respondents from other types of facilities to include: pool slides, water coasters, water raft rides, poolside climbing walls, lily pad/water walks, wave pools, water playgrounds, zero-depth entry, lazy rivers, pool covers or blankets, poolside cabanas, shade structures, surf machines, and lifeguard stations.
Respondents from colleges and universities were more likely than those from other facilities to include: diving platforms, teaching platforms, water polo equipment, water basketball equipment, and water volleyball equipment.
Certification in Pool Operations
The Pool & Hot Tub Alliance (PHTA), formerly two separate organizations, the National Swimming Pool Foundation (NSPF) and the Association of Pool & Spa Professionals (APSP), offers training and certification for pool operators.
The Certified Pool & Spa Operator (CPO) certification, for example, provides knowledge, techniques and skills necessary for pool and spa operations, while the Professional Pool and Spa Operator (PPSO) certification provides a course for commercial swimming pool operators, managers, engineers, service professionals, health officials and facility owners.
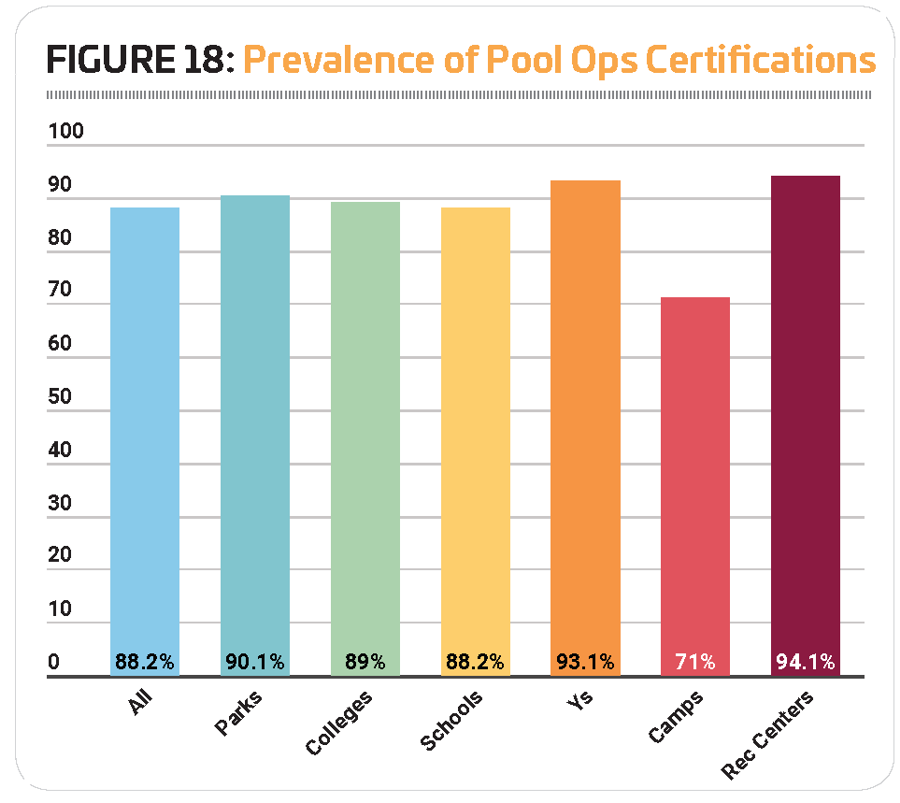
The majority (88.2%) of respondents said that either they or someone at their facility currently has this sort of certification, up from 87.5% in 2018. Respondents from rec centers were the most likely to be certified. Some 94.1% of rec center respondents said they or someone at their facility was certified in aquatic management or pool operations. They were followed by Ys (93.1%), parks (90.1%), colleges (89%), schools (88.2%), and camps (71%). (See Figure 18.)
School respondents were more likely than those from other types of facilities to include: diving boards, starting platforms, lane lines, scoreboards, swim platforms, and swim walls/pool bulkheads.
Respondents from Ys were more likely than those from other facility types to include: pool exercise equipment, underwater treadmills, and pool lifts and other accessibility equipment.
Finally, camp respondents were more likely than others to include pool inflatables and solar pool heating.
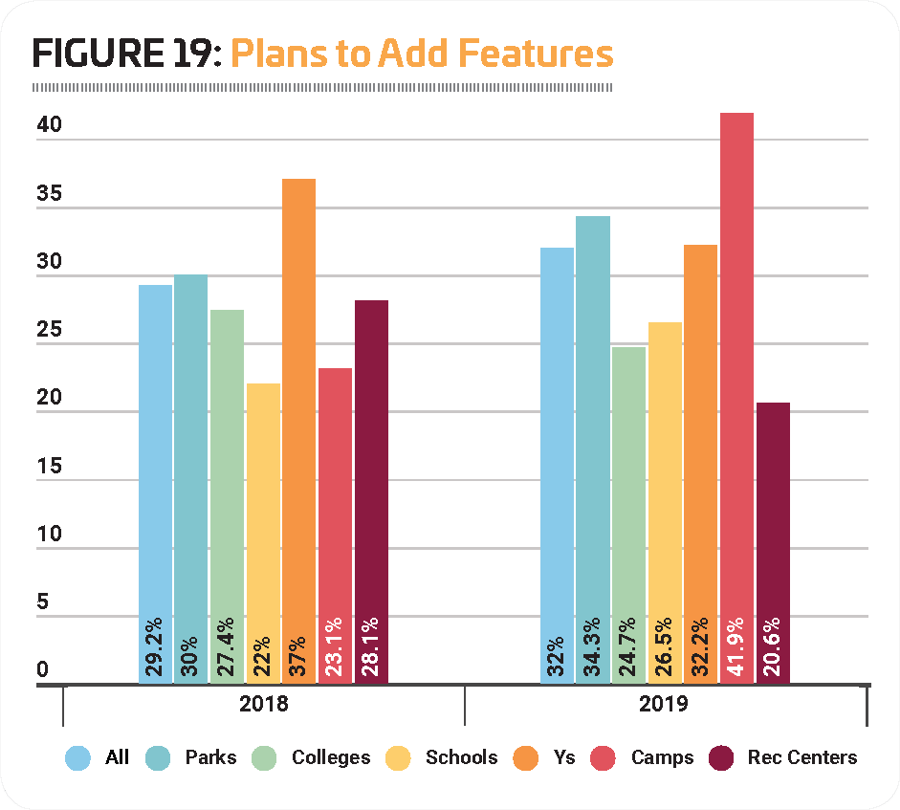
Nearly one-third (32%) of respondents said that they have plans to add features at their facilities within the next three years, up from 29.2% in 2018. Respondents from camps were the most likely to have such plans. Some 41.9% of camp respondents said they would be adding features at their facilities. They were followed by parks (34.3%), and Ys (32.2%). Respondents from rec centers and colleges were the least likely to be planning additions at their facilities, though 20.6% and 24.7%, respectively, said they had such plans. (See Figure 19.)
The 10 most commonly planned additions at aquatic facilities in the next three years include:
- Shade structures (planned by 28.9% of those who will be making additions, up from 26.1%)
- Poolside climbing walls (21.5%, down from 23.9%)
- Pool inflatables (20.2%, up from 14.9%)
- Pool slide (18.9%, up from 17.9%)
- Pool exercise equipment (18.4%, down from 18.7%)
- Water playgrounds (15.9%, up from 14.9%)
- Poolside cabanas (14.9%, up from 13.8%)
- Teaching platform (13.2%, did not appear on 2019 top 10 list)
- Zero-depth entry (13.2%, up from 12.3%)
- Water basketball equipment (12.7%, up from 11.1%)
Respondents from parks were the most likely to be planning to add: pool slides, water coasters, river raft rides, pool inflatables, lily pad/water walks, diving platforms, wave pools, water playgrounds, zero-depth entry, lazy rivers, poolside cabanas, surf machines, and lifeguard stands.
School respondents were the most likely to be planning to add: diving boards, pool exercise equipment, pool lifts and other accessibility equipment, water polo equipment, water basketball equipment, water volleyball equipment, and scoreboards.
Respondents from Ys were the most likely to be planning to add: starting platforms, lane lines, underwater treadmills, teaching platforms, and swim walls/pool bulkheads.
Camp respondents were the most likely to be planning to add: poolside climbing walls, solar heating, pool blankets and covers, and shade structures.
Respondents from rec centers were the most likely to be planning to add swim platforms.
Programming
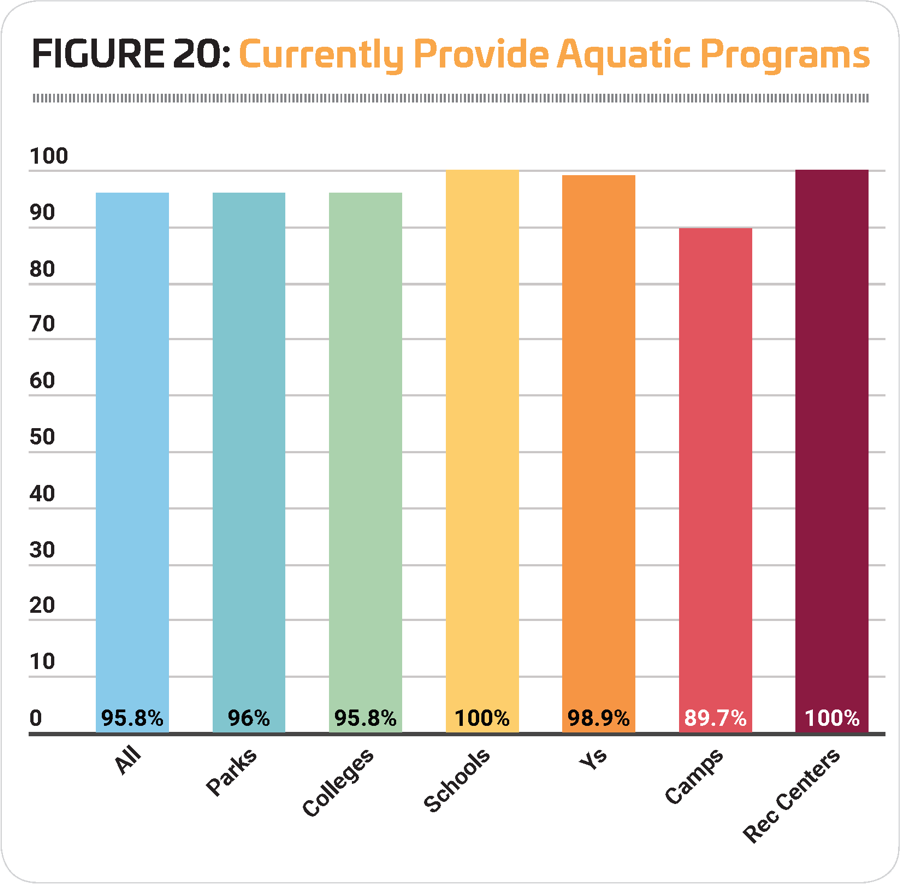
Though not every aquatic facility needs to offer programming to entice swimmers to the water (splash pads and waterparks can provide enough attraction simply by being built), it does offer a way to boost revenues and outreach in the community. A majority—95.8%—of respondents to the survey said they do currently provide some type of programming at their facilities. In fact, 100% of respondents from schools and recreation centers said they currently provide programming. Camp respondents were least likely to do so, though a majority—89.7%—even of these respondents said they currently do provide programming at their aquatic facilities. (See Figure 20.)
The following are the types of programs covered in the survey and their prevalence among respondents' offerings:
- Learn-to-Swim Programs (87.6%)
- Lifeguard Training (80.8%)
- Leisure Swim Time (80.4%)
- Lap Swim Time (76.6%)
- Birthday Parties (70.8%)
- Aquatic Aerobics (70.7%)
- Water Safety Training (64.1%)
- Youth Swim Teams (62.1%)
- Swim Meets & Other Competitions (53.1%)
- Aquatic Programs for Those With Physical Disabilities (39.2%)
- School Swim Teams (38%)
- Aquatic Programs for Those With Developmental Disabilities (36.1%)
- Water Walking (32.2%)
- Dive-In Movies (28.3%)
- Aquatic Therapy (24.3%)
- Adult Swim Teams (24%)
- Aqua-Yoga & Other Balance Programs (23.1%)
- Diving Programs & Teams (20.1%)
- Water Polo (15.3%)
- Doggie Dips (14.1%)
- Collegiate Swim Teams (9.1%)
Respondents from Ys were the most likely to offer most types of programming. They were more likely than those from other facility types to offer learn-to-swim programs, youth swim teams, programs for those with physical disabilities, programs for those with developmental disabilities, aquatic aerobics, aqua-yoga and other balance programs, water walking, leisure swim time, lap swim time, aquatic therapy, water safety training, lifeguard training and birthday parties.
Respondents from colleges were more likely than those from other facility types to provide adult swim teams, collegiate swim teams, water polo, and dive-in movies.
Respondents from schools were more likely than those from other facility types to provide school swim teams, swim meets and competitions, and diving programs and teams.
Park respondents were more likely than those from other facility types to provide doggie dips.
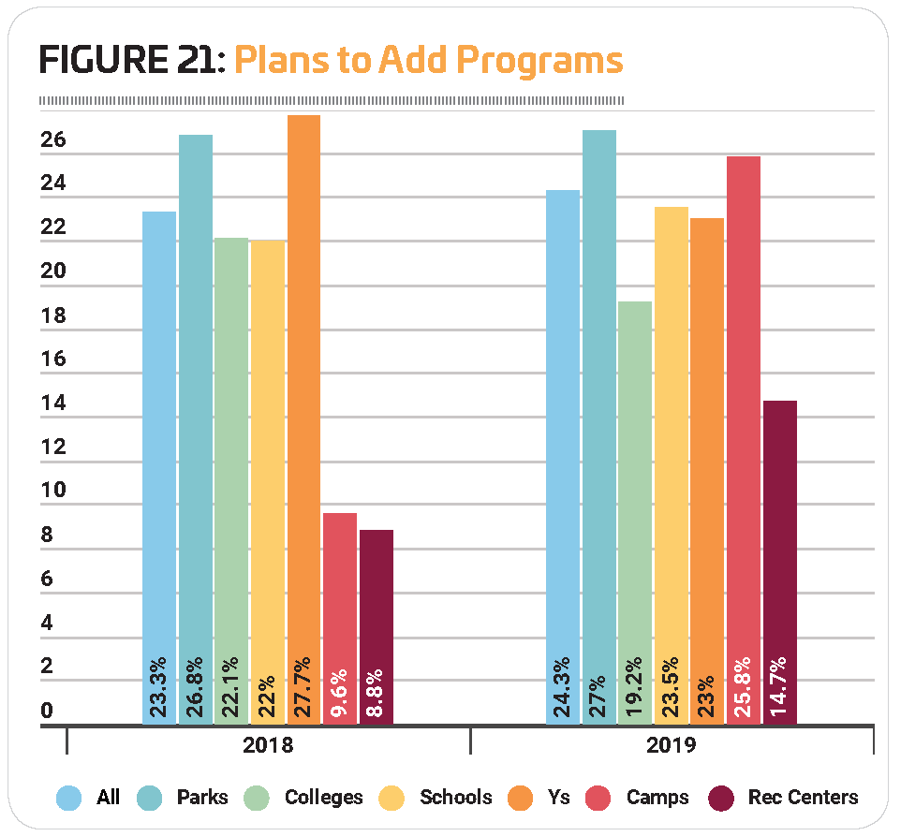
Nearly a quarter (24.3%) of respondents said they had plans to add more programs at their facilities over the next three years, up from 23.3% in 2018. Respondents from parks were the most likely to have such plans. Some 27% of park respondents said they would be adding programs at their facilities in the next three years. They were followed by camps (25.8%), schools (23.5%) and Ys (23%). Rec center respondents were the least likely to be planning to add programs, though 14.7% of rec center respondents said they had such plans. (See Figure 21.)
The top 10 most commonly planned program additions include:
- Dive-In Movies (planned by 38.7% of those who will be adding programs)
- Aqua-Yoga & Other Balance Programs (28.3%)
- Programs for Those With Physical Disabilities (28.3%)
- Programs for Those With Developmental Disabilities (26%)
- Aquatic Aerobics (21.4%)
- Adult Swim Teams (16.2%)
- Water Walking (15.6%)
- Youth Swim Teams (12.7%)
- Learn-to-Swim Programs (12.1%)
- Aquatic Therapy (12.1%)
Program types that saw growth from 2018 to 2019 include: dive-in movies (up from 33.2%); programs for those with physical disabilities (up from 25.7%); aqua aerobics (up from 19.2%); adult swim teams (up from 12.6%); water walking (up from 13.6%); and learn-to-swim programs (up from 11.7%). Youth swim teams did not appear on last year's top 10 list. That program replaced doggie dips.
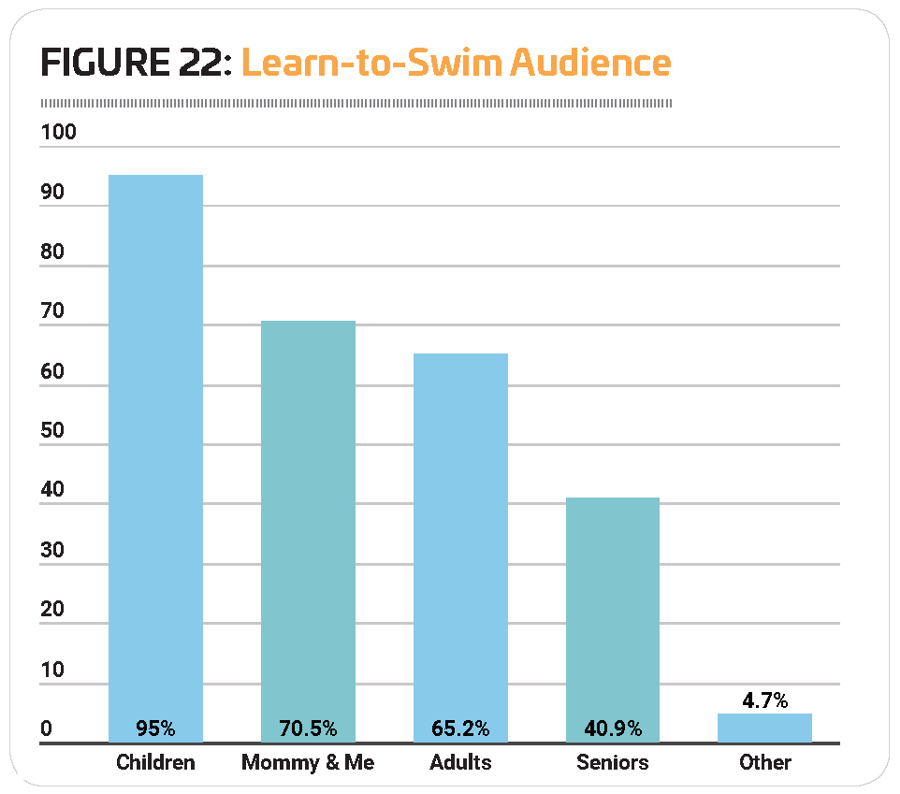
We asked the 87.6% of respondents who offer learn-to-swim programs some further questions about the audience they reach with their programs. As one might expect, learn-to-swim programs aimed at children are the most popular type of program, but there are plenty of other offerings, as well.
The vast majority (95%) of respondents who provide learn-to-swim programs are providing programs that reach children ages 17 and younger. Another 70.5% offer programs for parents and babies or toddlers (such as mommy—or daddy—and me classes). Some 65.2% provide learn-to-swim programs for adults ages 18 and older. Some 40.9% provide learn-to-swim programs for seniors, and 4.7% provide other types of learn-to-swim programs. (See Figure 22.)
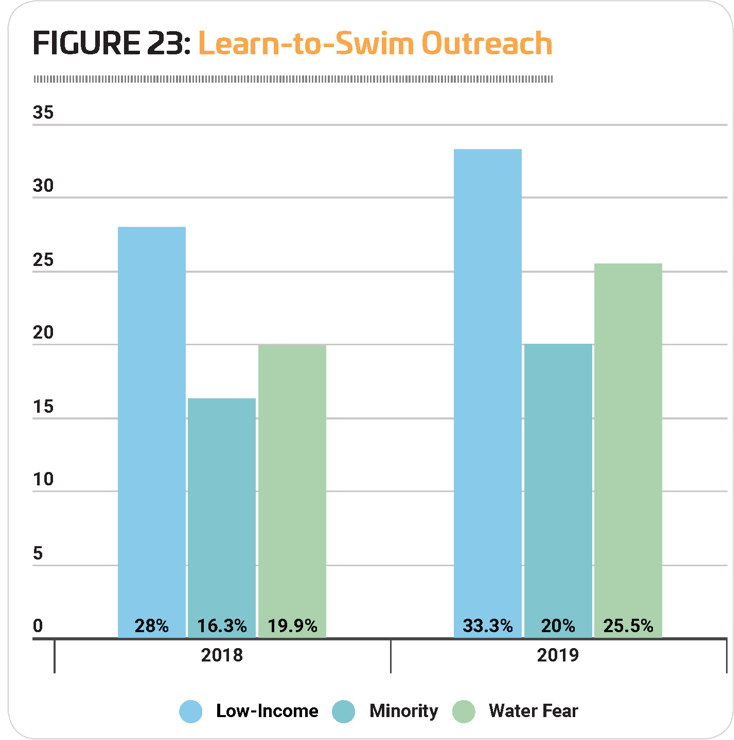
It is fairly commonly understood in the aquatic industry that lower-income populations, as well as minorities, often have less access to learn-to-swim programs. Many facilities attempt to overcome these barriers—as well as reaching those with a fear of water—with outreach programs. One-third of respondents (33.3%) said they currently have a low-income outreach program, up from 28% in 2018. One-fifth (20%) said they do minority outreach, up from 16.3%. Finally, more than one-quarter (25.5%) offer learn-to-swim programs that aim to help patrons overcome a fear of water, up from 19.9%. (See Figure 23.)
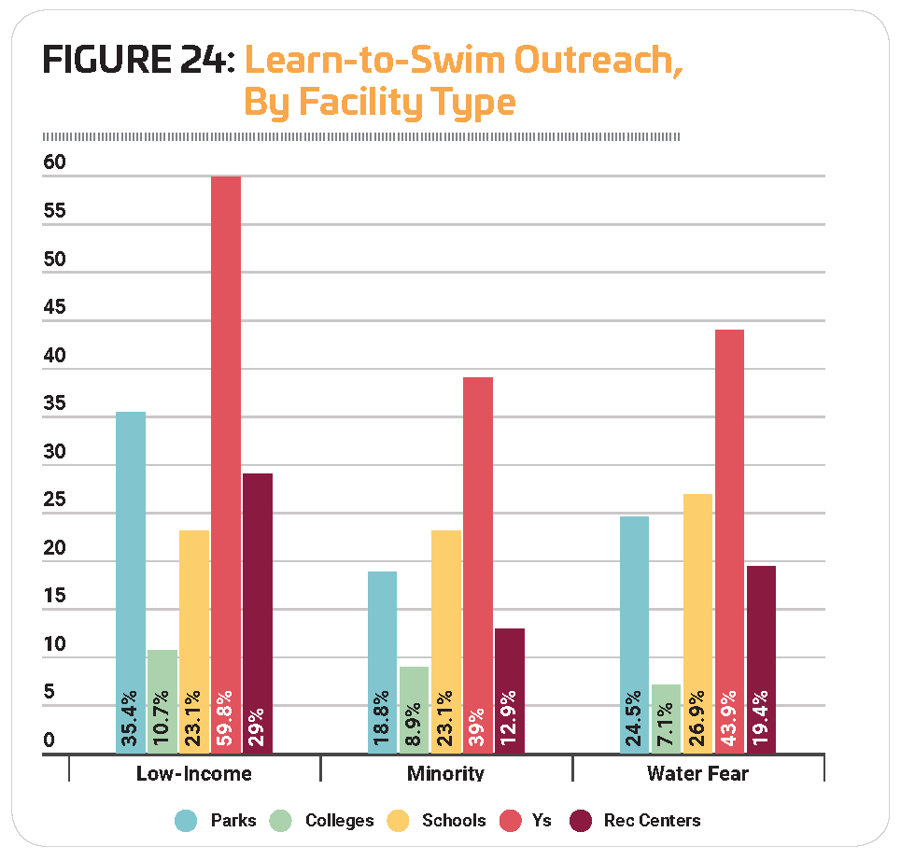
Respondents from Ys were the most likely to reach out to low-income, minority and water-phobic audiences. In fact, more than half (59.8%) of Y respondents who had learn-to-swim programs said they had low-income outreach programs, while 39% engaged in minority outreach, and 43.9% had programs for those looking to overcome a fear of water. More than one-third (35.4%) of parks and nearly a third (29%) of rec centers also offered low-income outreach. Nearly a quarter (23.1%) of schools did minority outreach. And around a quarter of schools (26.9%) and parks (24.5%) provided programs to help patrons overcome a fear of the water. (Not enough camps provide learn-to-swim programs to provide measurable data for this portion of the report.) (See Figure 24.)
Water Safety & Drowning Prevention
As mentioned in the previous section, a majority (64.1%, up from 57.2% in 2018) of respondents provide water safety training to their patrons. But there are other ways to address water safety, through lifeguarding programs, as well as specific tools aimed at preventing drowning.
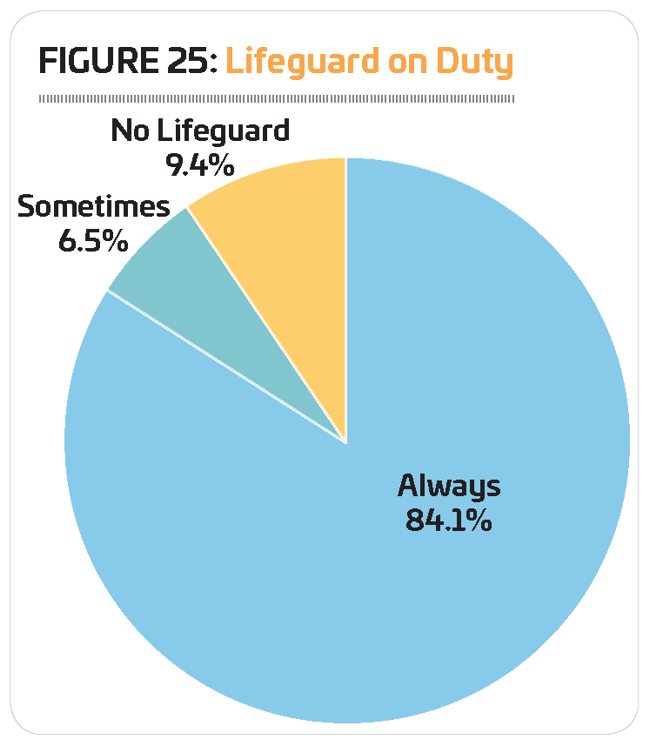
A majority of respondents (84.1%) reported that there is a lifeguard on duty at all times the aquatic facility is open. Another 6.5% said a lifeguard is on duty during some hours of operation. Some 9.4% said there is never a lifeguard on duty at their facilities. (See Figure 25.)
All 100 percent of the respondents from Ys said that a lifeguard is on duty at least some of the time. Some 98.8% of Y respondents said a lifeguard is always on duty, and 1.2% said a lifeguard is sometimes on duty at their facilities.
Colleges were the next most likely to have a lifeguard on duty, with 94.5% indicating there is always a lifeguard and 2.7% indicating there is sometimes a lifeguard on duty. They were followed by parks respondents, where 92% said a lifeguard is always on duty, and 4.3% said a lifeguard is sometimes on duty.
Some 8.8% of respondents from schools and rec centers said they never have a lifeguard. That said, 79.4% of rec centers and 76.5% of schools said a lifeguard is always on duty at their aquatic facilities, and 11.8% of rec centers and 14.7% of schools said a lifeguard is sometimes on duty.
Camp respondents were the least likely to report that they had a lifeguard on duty at their facilities, with nearly one-fifth (19.4%) indicating they never have a lifeguard on duty. Still, nearly three-quarters (74.2%) of camp respondents said a lifeguard is always on duty at their facilities, and 6.5% said a lifeguard is sometimes on duty.
Lifeguards are the first line of defense against drowning, but they are not the only method used to protect swimmers. When it comes to drowning prevention, here are the tools most commonly employed by respondents:
- Lifeguard on Duty: 90.6%, down from 92.1%
- Life Preservers Required for Less-Skilled Swimmers: 56.9%, up from 54.2%
- Video or Other In-Pool System for Detecting Swimmers in Trouble: 5.5%, up from 4.9%
- Safety Device That Sounds an Alarm When Submerged: 4.8%, down from 4.9%
- Other: 5.7%
- None: 5.7%
ADA Awareness & Compliance
The U.S. Census Bureau reports that there were 56.7 million people in the United States with a disability in 2010. That represents 19 percent—nearly one-fifth—of the population. This includes both physical and mental impairments that have an impact on major life activities.
Also in 2010, the Americans With Disabilities Act (ADA) Standards were updated with new requirements for swimming pools. Broadly speaking, the requirements cover commercial swimming pools, including public pools run by municipalities and school districts, as well as private pools, such as those in hotels. The rules require that pools with more than 300 linear feet of wall need to include two means of access, one of which must be a fixed pool lift or sloped entry. Pools with less than 300 linear feet of wall only require a single means of access, but that must be a lift or sloped entry.
Nearly a decade after the new requirements were introduced, awareness and compliance are both relatively high.
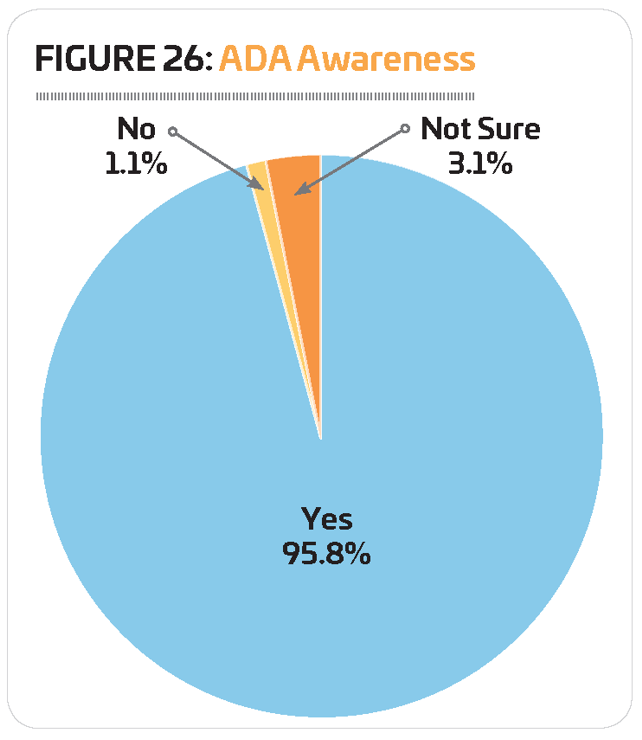
The vast majority of respondents (95.8%) said they are aware of the ADA requirements for swimming pools. Another 1.1% said they are not aware of the requirements, and 3.1% were not sure. This represents virtually no change from 2018. (See Figure 26.)
Slightly more respondents—87.6%, up from 86.8% in 2018—reported that their facilities are currently in compliance with the ADA requirements for swimming pools. Another 6% said they are not in compliance, and 6.4% were unsure. (See Figure 27.)
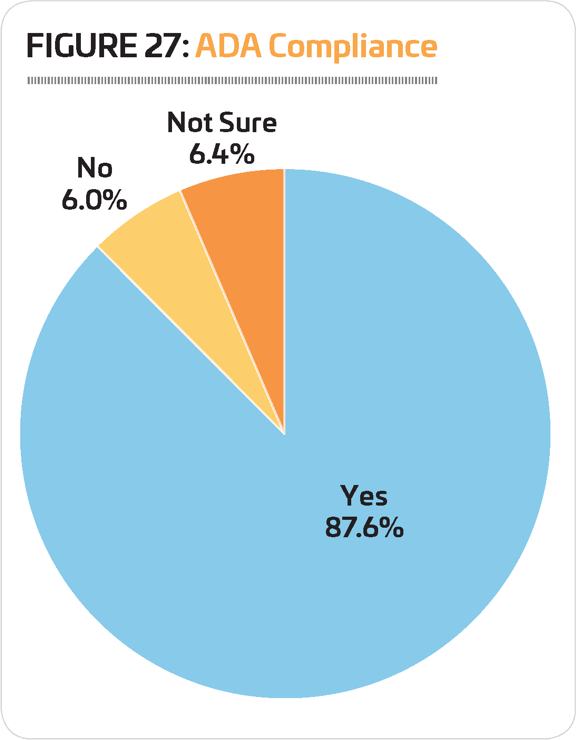
Respondents from Ys were the most likely to report that they were in compliance with ADA requirements, while those from camps were the least likely to be in compliance. Some 93% of Ys said their aquatic facilities are currently in compliance with ADA requirements. They were followed by those from parks (91.1% were in compliance), schools (88.2%), colleges (87.7%) and rec centers (84.8%). By comparison, just two-thirds (66.7%) of camp respondents said their facilities are currently in compliance with ADA requirements.
MAHC Awareness & Participation
The Model Aquatic Health Code (MAHC) is a set of guidelines published by the U.S. Centers for Disease Control & Prevention (CDC), bringing together the latest science and best practices in order to help state and local government officials develop and update their pool codes. Codes have historically been developed at the local government level to cover such things as how and how often water is tested for safety, how aquatic facilities are built and operated, how chemicals should be used to maintain safe water and more. The MAHC provides local officials with the ability to create a more standardized set of rules and regulations for aquatic facilities based on well-recognized and -researched industry practices.
First released in the summer of 2014, the MAHC is not a static code, but rather is updated regularly as new information and input is made available. The third edition of the code was published in 2018.
Created at the request of businesses, health departments, academics and others, the MAHC is meant to be a tool for government agencies to use as they develop their own pool codes. It is not a federal law, which means government agencies can choose whether to adopt it at all, whether to use all of the MAHC or just part of it, or whether to modify all or part of it to fit their needs.
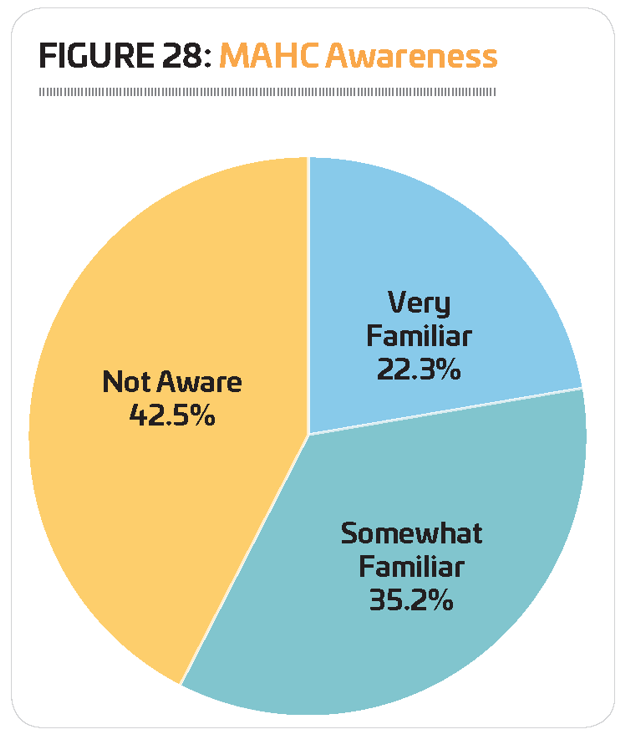
Nearly six in 10 (57.5%) of respondents said they are familiar with the MAHC, virtually no change from 2018, but up from 53.2% in 2017. Some 22.3% are very familiar with the MAHC, while 35.2% said they are somewhat familiar with it. (See Figure 28.)
To ensure the MAHC is regularly updated, a nonprofit organization, the Council for the Model Aquatic Health Code (CMAHC) was created in 2013. The council serves as a clearinghouse for input and advice on improvements to the MAHC. CMAHC members can take part in the process of updating the MAHC and have their input heard by the CDC as it revises and releases the next edition. The next CMAHC Conference will be held in October 2020.
(To learn more about participating in the CMAHC, visit www.cmahc.org.)
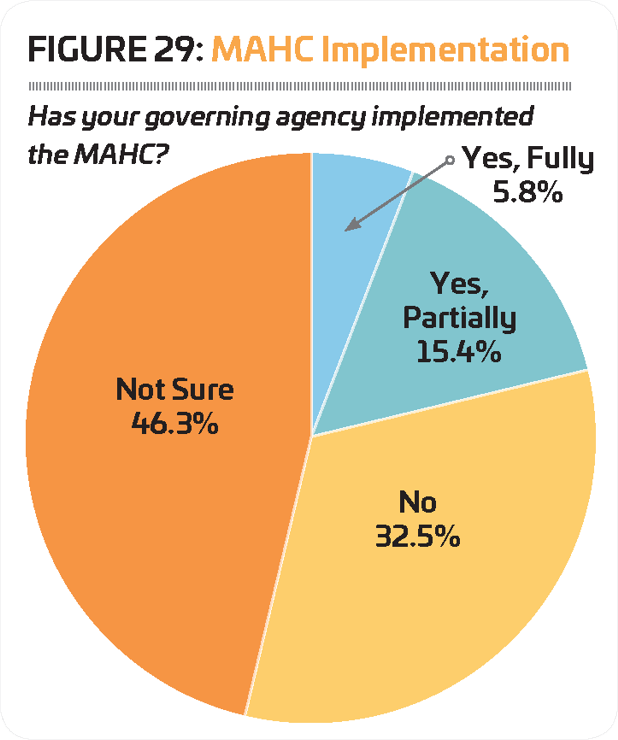
We also asked respondents whether the regulatory agency that governs their facilities has adopted the MAHC, either fully or partially. Slightly less than half (46.3%) were not sure. Nearly one-third (32.5%) said their regulatory agency had not adopted the MAHC. Some 5.8% said the MAHC had been fully implemented by their regulatory agency, up from 4.1% in 2018, and 15.4% said their regulatory agency has adopted portions of the MAHC. (See Figure 29.)
Challenges & Issues
Between the equipment and staff required to keep them running safely and the programming and promotion that needs to happen to keep them operating at least close to a budget, aquatic facilities can present a plethora of challenges.
According to respondents to the aquatic survey, staffing, budgets and equipment facility maintenance are the top issues facing aquatic facilities.
More than half of respondents said the top issues facing the aquatics industry include staffing (60.5%) and budgetary issues (56.8%), and nearly a half (48.8%) said equipment and facility maintenance was their top challenge. Safety and risk management was another top concern for respondents, with 31.3% indicating this was one of their top challenges. (See Figure 30.)
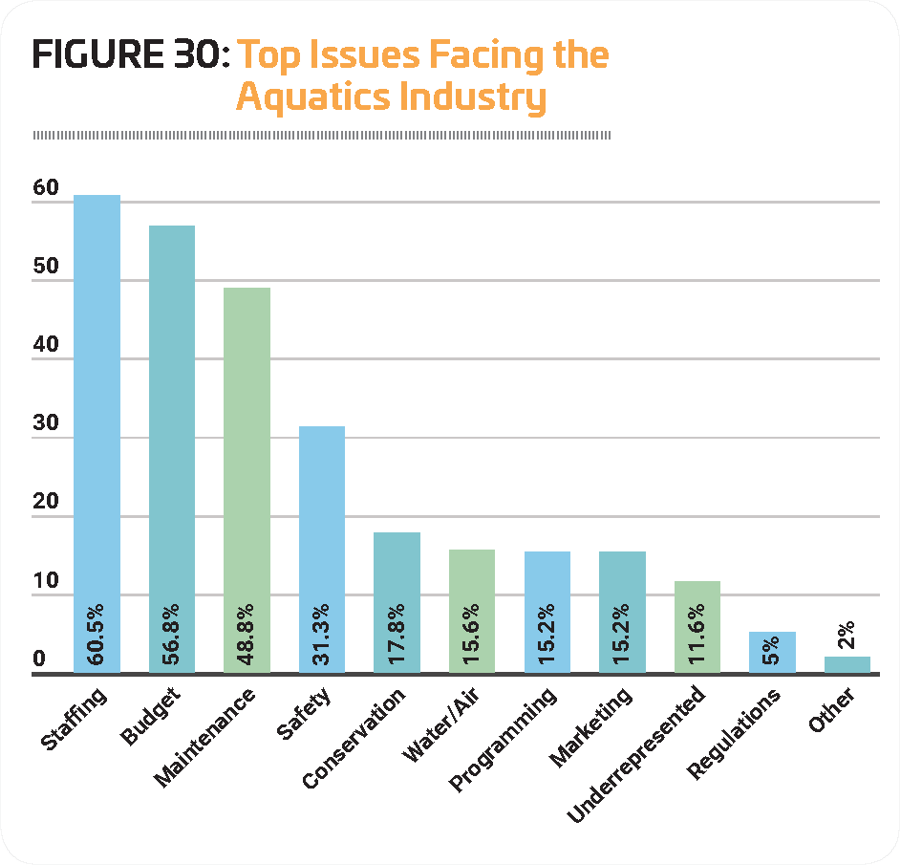
Smaller percentages listed other concerns among the top issues facing the aquatics industry, including: conservation (17.8%); water and air quality (15.6%); new programming ideas (15.2%); and marketing and increasing attendance (15.2%).
Nearly two-thirds (66.1%) of parks respondents said staffing issues were their top challenge. Another 60% named budgets as their top challenge, while more than half (50.4%) said equipment and facility maintenance was their top issue.
For college respondents, the top issues were: budget challenges (67.1%); staffing (45.2%); and safety and risk management (45.2%).
For school respondents the top issues were: budget challenges (58.8%); staffing (47.1%); and equipment and facility maintenance (38.2%).
Among Y respondents, the top challenges were: staffing issues (84.9%); budget challenges (45.3%); and equipment and facility maintenance (40.7%).
For camp respondents the top concerns were: equipment and facility maintenance (62.1%); budgets (51.7%); and staffing issues (48.3%).
For rec center respondents, the top issues were: budgets (67.6%); staffing (55.9%); and equipment and facility maintenance (44.1%).
Interestingly, respondents who had only indoor or only outdoor pools also saw the challenges facing the aquatic industry differently.
Those with indoor pools only were more likely to consider the following as top concerns: safety and risk management (37.3% of indoor pool respondents vs. 32.8% of outdoor pool respondents); water and air quality (28.8% vs. 7.6%); new programming ideas (13.6% vs. 10.1%); and outreach to underrepresented audiences (12.7% vs. 7.6%).
Those with outdoor pools only were more likely to consider these as their top concerns: staffing (53.8% of outdoor pool respondents vs. 50.8% of indoor pool respondents); budgets (64.7% vs. 62.7%); equipment and facility maintenance (56.3% vs. 46.6%); conservation (23.5% vs. 15.3%); marketing and increasing attendance (17.6% vs. 10.2%); and regulatory issues (4.2% vs. 2.5%).
Many respondents discussed the difficulties of staffing lifeguards, citing minimum wage increases and a general lack of people willing to do the job. The need to update and maintain existing equipment was also a commonly called out challenge.
Here is a list of some of the challenges cited by individual respondents:
- "Staffing has been and will continue to be an immense challenge. Finding, training and retaining lifeguards has become increasingly difficult. It is simply a job that has become undervalued by our department and the community. This drought of lifeguards can be felt nationwide."
- "Our city is growing and we are out of programming space currently. It's time to build another facility."
- "We have not been able to recruit older demographics to guard, resulting in limited, if not no, open hours after school is back in session. If no staffing, then no growth in programming or hours offered to the public. Creates a domino effect in all areas of operation."
- "This is not an issue at my facility as we do not employ lifeguards but the top challenge nationwide will be the availability of lifeguards as fewer and fewer individuals are willing to take on the responsibility."
- "With the building of our new facility, our greatest challenge will be organizing all the programs we would like to offer and getting those publicized for the community to know what we have to offer and getting them involved."
- "We have both indoor (less than three years old) and have three outdoor seasonal pools. We are discussing with our citizens closing one neighborhood pool and replacing it with a splash pad and have strong neighborhood resistance. They want a new pool even if it's heavily subsidized because of lack of features."
- "The pool will need to be replaced in the coming years and the question will be whether to replace it or phase out aquatics."
- "We are constantly chasing leaks, so that will likely continue. Water loss = increased expenses. Additionally, there are fewer teens seeking lifeguarding as a job, so the labor force has diminished."
- "We will need to come up with significant funds to renovate our aging pool."
- "It is always challenging to attempt to meet the needs of all types of our members—from young families to seniors, all looking for different pool experiences."
- "Our pools are over their life span, and with dwindling operational and capacity numbers at camps it will be a hard sale to replace."
- "Extending the life of our pool for another 50 years in ways that would be economical, but also conserving our resources such as water."
- "Finding staff is, and will be an issue. We employ kids in high school, and then we try and keep them around as long as possible. It is becoming increasingly difficult to convince kids to want to be a lifeguard."
- "The public would like to see the pools remodeled or rebuilt, but we need to raise the funds to provide a proper facility or we will just have to keep putting band-aids on our aging facilities."
- "In our aquatics facility the challenge will be increasing memberships and improving staff training and facility operations."
- "Keeping our numbers up to justify our city's financial commitment to our facility and our value in our community." RM
© Copyright 2022 Recreation Management. All rights reserved.

