


A Look at Regional Trends
While there is wide variation within each region of the country, it can be helpful to break down the results of the survey using geographic distinctions. Some types of facilities, and some types of amenities are more prevalent in one region vs. another, and budgets and construction costs, in particular, can vary widely depending on the geography represented.
The regional distribution of the 2,100-plus respondents to the Industry Report survey is slightly different from the population distribution, according to the most recent U.S. Census, with the greatest variation found in the percentage of respondents from the Midwest.
According to the U.S. Census, 17.9 percent of the population is located in the Northeast, 21.7 percent in the Midwest, 19.4 percent in the South Atlantic states, 17.7 percent in the South Central region, and 23.3 percent in the West. In the 2016 survey, 17.6 percent of respondents are located in the Northeast, 31.2 percent in the Midwest, 16.8 percent in the South Atlantic states, 12.1 percent in the South Central region, and 21.4 percent in the West. Some 1 percent of respondents were located outside of the United States.
Respondents from the South Atlantic and South Central regions were the most likely to be from urban communities. More than one-quarter (27.3 percent) of South Atlantic respondents, and 24.1 percent of South Central respondents were from urban communities. They were followed by those from the West (20.6 percent of whom were from urban areas) and the Midwest (19.3 percent). Respondents from the Northeast were the least likely to be located in urban communities (15 percent).
Respondents from the Northeast and the South Atlantic region were more likely than other regions to be located in suburban communities. Well over half (57.4 percent) of Northeastern respondents and 48.6 percent of South Atlantic respondents said they were from the suburbs. They were followed by those in the West (44.6 percent) and the Midwest (40.1 percent). Respondents in the South Central region were least likely to be from suburban communities (38.3 percent).
Midwestern and Northeastern respondents were more likely than others to be from rural communities. Some 40.7 percent of those in the Midwest and 38 percent from the Northeast said they were located in rural areas. They were followed by the South Central region (37.5 percent) and the West (34.8 percent). Respondents from the South Atlantic states were least likely to be from rural communities (37.5 percent).
Given the fact that some regions are more heavily representative of rural or suburban communities, it should come as no surprise that there is a wide variation in the average population size for each region. The largest average populations were found among those from the South Atlantic and South Central regions, with the smallest populations served in the Northeast and Midwest. South Atlantic respondents served an average of 108,000 people, while those in the South Central region served 101,300. They were followed by the West, with an average population served of 92,700. Northeastern respondents served an average of 65,900 people, while those in the Midwest served an average of 65,500.
Likewise, those in the Midwest and Northeast were much more likely to report that they served a population of less than 30,000 people, with 69 percent of Northeastern and 62.8 percent of Midwestern respondents indicating that the average population size served by their facilities was less than 30,000 people. This compares with 49.2 percent in the West, 48.6 percent in the South Central states, and 45.7 percent in the South Atlantic region.
Respondents from the South Central and South Atlantic region were more likely than others to report that their average population size was more than 100,000 people, with 25.7 percent of South Central respondents and 25.6 percent of South Atlantic respondents reporting that they served 100,000 or more. They were followed by the West, where 23.9 percent had a population of 100,000 or more. Just 14.3 percent of Midwestern respondents and 12.6 percent of Northeastern respondents said they served a population of more than 100,000.
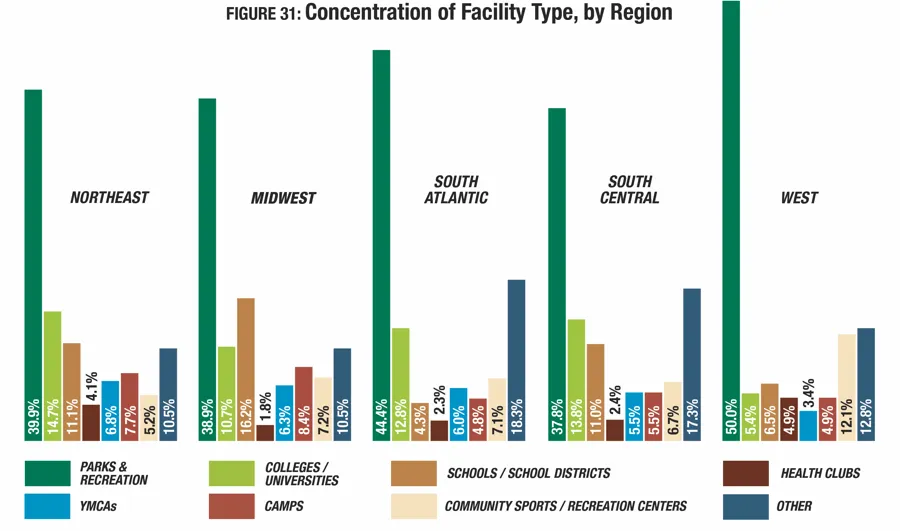
While respondents from every region were most likely to be representing parks and recreation organizations, the concentration of facility types does vary from one region to another, with those in the West most heavily represented by parks and recreation, and those in the South Central states least heavily represented by parks and recreation. (See Figure 31.)
In the Northeast, 39.9 percent of respondents said they were with parks and recreation. The next largest group were from colleges and universities (14.7 percent). They were followed by schools and school districts (11.1 percent); camps (7.7 percent); YMCAs (6.8 percent); community sports and recreation centers (5.2 percent); and health clubs (4.1 percent). Another 10.5 percent represented other types of facilities, with those from the Northeast being more likely than any other region to represent ice rinks (1.1 percent of Northeastern respondents).
In the Midwest, 38.9 percent of respondents were with parks and recreation organizations. The next largest group were from schools and school districts (16.2 percent). They were followed by colleges and universities (10.7 percent); camps (8.4 percent); community sports and recreation centers (7.2 percent); YMCAs (6.3 percent); and health clubs (1.8 percent). Another 10.5 percent were from other types of facilities.
Some 44.4 percent of South Atlantic respondents were from parks and recreation facilities. The next largest group were from colleges and universities (12.8 percent). They were followed by community sports and recreation centers (7.1 percent); YMCAs (6 percent); camps (4.8 percent); schools and school districts (4.3 percent); and health clubs (2.3 percent). South Atlantic respondents were more likely than those from any other region to represent "other" facilities, with 18.3 percent coming from some other type of facility. Among these, the South Atlantic was more likely than other regions to be home to golf and country clubs (4.6 percent of South Atlantic respondents worked for golf facilities); resorts and resort hotels (3.1 percent); military (2.8 percent); and racquet or tennis clubs (1.1 percent).
In the South Central region, 37.8 percent of respondents were from parks and recreation facilities. The next largest group was from colleges and universities (13.8 percent). They were followed by schools and school districts (11 percent); community recreation and sports centers (6.7 percent); YMCAs and camps (5.5 percent each); and health clubs (2.4 percent). Some 17.3 percent of South Central respondents represented other types of facilities. Those that were most likely to be located in the South Central states include waterparks (2.8 percent of South Central respondents were from waterparks); medical fitness or wellness facilities (1.6 percent); amusement or theme parks (1.2 percent); and corporate recreation or sports centers (1.2 percent).
In the West, half of respondents (50 percent) said they were with parks and recreation organizations. The next largest group of respondents were from community sports and recreation centers (12.1 percent). They were followed by schools and school districts (6.5 percent); colleges and universities (5.4 percent); health clubs, and camps (4.9 percent each); and YMCAs (3.4 percent). Some 12.8 percent of Western respondents were from other types of facilities.
A majority of respondents in all regions indicated that they form partnerships with outside organizations. Those in the Midwest and South Atlantic regions were the most likely to do so, while those in the Northeast were the least likely to form such partnerships.
Some 89.8 percent of Midwestern respondents said they had partnered with outside organizations, and 88.9 percent of South Atlantic respondents had done so. They were followed by those in the West (87.5 percent) and the South Central region (86.2 percent). Among those in the Northeast, 82.2 percent had formed partnerships with outside organizations.
Respondents from the South Atlantic region were more likely than others to partner with: local government (55 percent of South Atlantic respondents had partnered with local government); nonprofit organizations (51.6 percent); colleges and universities (37.9 percent); corporate or local businesses (35.6 percent); YMCAs (24.8 percent); health care or medical facilities (24.2 percent); federal government (19.7 percent); and the military (15.1 percent).
Respondents in the West were more likely than those in other regions to partner with local schools (61.7 percent).
South Central respondents were more likely than those in other regions to partner with state government (32.7 percent).
Finally, Northeastern respondents were more likely than those in other regions to partner with private health clubs (6.8 percent).
The most likely primary audience for respondents in all regions was all ages. Those in the West were the most likely to report that they served an all-ages audience, while those in the Northeast were the least likely to do so. Nearly half (48.1 percent) of Western respondents said their primary audience was all ages. They were followed by the Midwest (42.7 percent); the South Central states (39.4 percent); and the South Atlantic (37.5 percent). More than one-third (35.4 percent) of Northeastern respondents also serve an all-ages audience.
Respondents in the Northeast were more likely than those in other regions to report that their primary audience was made up of children ages 4 to 12. Nearly one-quarter (23.7 percent) of Northeastern respondents named this as their primary audience. Midwestern respondents were more likely than those in other regions to have teens as their primary audience, with 11.7 percent of Midwestern respondents serving teens. Infants and toddlers were most likely to be the primary audience among the South Atlantic states, where 0.6 percent serve infants and toddlers. College students were the primary audience for South Central respondents more than any other region. Some 13.4 percent of South Central respondents said college students were their primary audience. Adults and seniors were most likely to be the primary audience for respondents in the West. Some 21.9 percent of Western respondents said they primarily served adults, and 4.3 percent said seniors were their primary audience.
Budgets & Utilization
When it comes to the number of people using their facilities, respondents from the South Central, South Atlantic and Western regions were the most likely to report increases in the years covered by the survey, a trend that has held steady over many years, and coincides with broader population trends, wherein more people are moving into these regions.
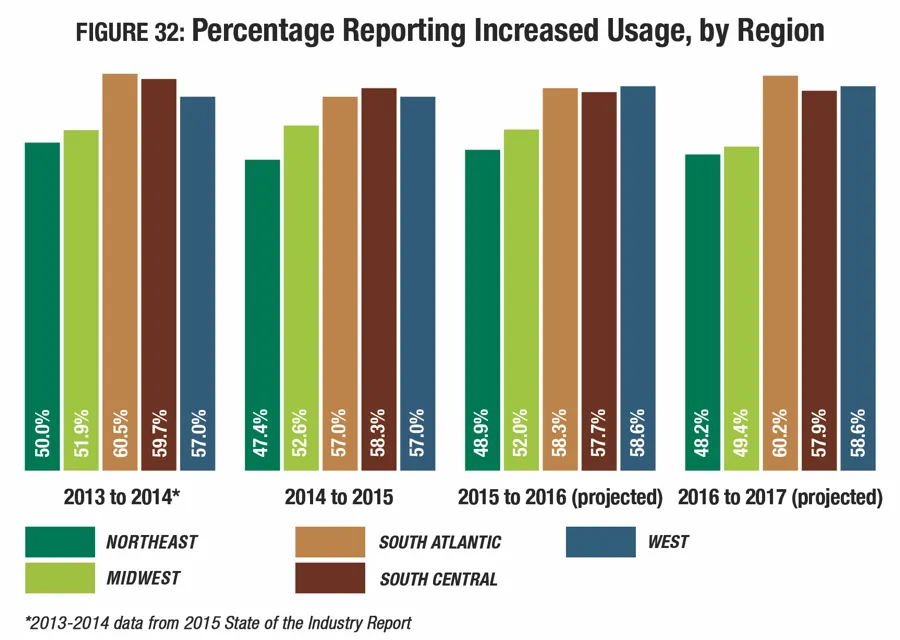
From 2014 to 2015, South Central respondents were the most likely to report that usage at their facilities had risen, with 58.3 percent reporting an increase. They were followed by the South Atlantic and West—57 percent of respondents in each of those regions reported increases in utilization. Respondents from the Northeast were least likely to report increases, with less than half (47.4 percent) indicating utilization had gone up. (See Figure 32.)
Looking ahead, respondents from the West are most likely to expect further increases in 2016, while those in the South Atlantic region are most likely to expect increases in 2017. Respondents in the Northeast continue to be the least likely to expect usage to rise. Some 58.6 percent of respondents in the West expect increases in 2016, and in 2017. They are followed in 2016 by those in the South Atlantic states (58.3 percent) and are preceded by the South Atlantic states in 2017 (60.2 percent). Less than half of those in the Northeast expect an increase in usage in 2016 (48.9 percent) and in 2017 (48.2 percent).
Respondents in the South Atlantic region employ the largest average number of people, while those in the South Central states have the smallest staffs. On average, respondents in the South Atlantic region have 142.6 employees. They were followed by the Midwest (135.7) and the West (133.6). South Central respondents have the fewest employees, with an average of 121.7, followed by the Northeast (127.4).
Respondents from the South Atlantic and Western regions were the most likely to indicate that they had plans to add staff over the coming year. Some 21.6 percent in the South Atlantic and 20.3 percent in the West reported that they would be adding staff. They were followed by the South Central states, where 18.9 percent plan to increase staff, and the Midwest, where 17.3 percent will be adding employees. Just 13 percent of Northeastern respondents had plans to add staff at their facilities.
Respondents from the West were the most likely to report that their revenues had increased from 2014 to 2015. Half (50 percent) of respondents in the West said revenues had increased in that time period. They were followed by South Atlantic respondents (46 percent) and South Central respondents (44.4 percent). Respondents in the Northeast were the least likely to report increasing revenues from 2014 to 2015, with just 37.7 percent indicating they'd seen revenues rise. They were followed by the Midwest, where 41.3 percent reported an increase.
Looking forward, respondents in the West will continue to be most likely to see increasing revenues. In 2016, 52.9 percent of Western respondents expect an increase, and in 2017, 54.6 percent expect revenues to increase. They were followed in both years by the South Atlantic, where 49 percent project an increase to revenues in 2016, and 50.5 percent expect an increase in 2017. Respondents from the Northeast will continue to be least likely to see increasing revenues, with 43.9 percent projecting an increase in 2016 and 44.1 percent projecting an increase in 2017.
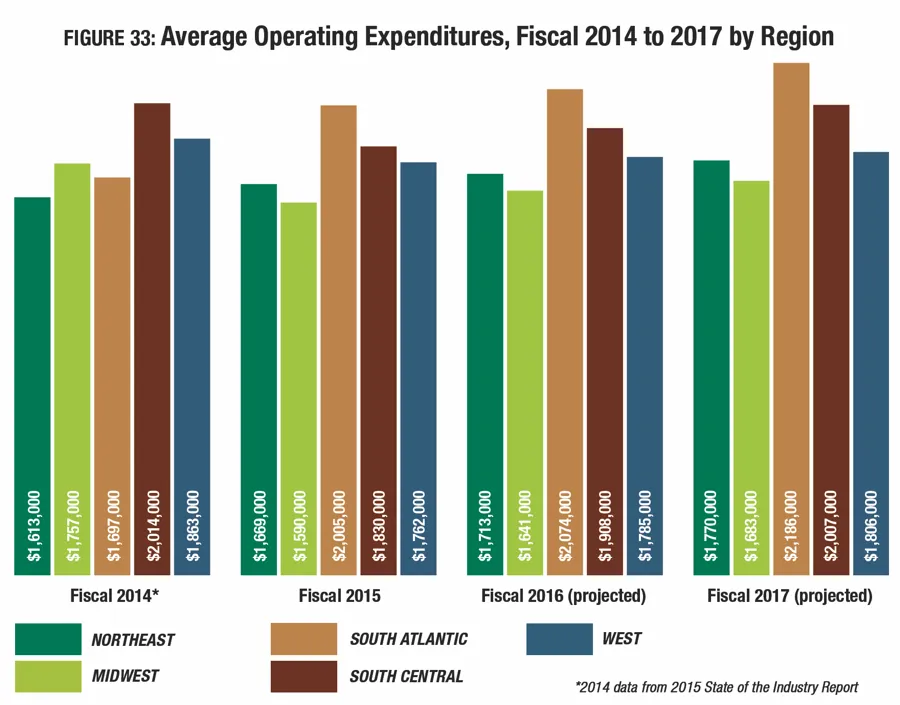
Respondents from the South Atlantic states had the highest average operating expenditure in fiscal 2015, at $2,005,000, 15.2 percent higher than the average for all regions. They were followed by South Central respondents, whose average operating expenditure of $1,830,000 was 5.2 percent higher than the average for all regions, and the West, at 1.3 percent higher than all regions with $1,762,000. Respondents in the Midwest had the lowest average operating cost for fiscal 2015, spending $1,590,000 on average, or 8.6 percent lower than the average for all regions. They were followed by the Northeast, spending 4.1 percent less than all regions at $1,669,000. (See Figure 33.)
Looking ahead, respondents from the South Central states are expecting the greatest increase in their average operating expenditure between fiscal 2015 and 2017. These respondents projected a 9.7 percent increase to $2,007,000 in fiscal 2017. They were followed by the South Atlantic region, with a 9 percent increase to $2,186,000, and the Northeast, with a 6.1 percent increase to $1,770,000. The smallest increase was reported by respondents from the West, who projected their operating expenditures to rise 2.5 percent from 2015 to 2017, to an average of $1,806,000. They were followed by the Midwest, projecting a 5.8 percent increase to $1,683,000.
Respondents in the West earned back the highest percentage of their operating costs via revenue, while those from the South Central region earned the lowest percentage back. In the West, respondents reported that they earned an average of 52.4 percent of their operating costs back via revenues. They were followed by the Northeast (50 percent), the Midwest (49.6 percent), and the South Atlantic region (47.6 percent). Respondents in the South Central states reported that they earned back 46.1 percent of their operating costs via revenue, on average.
Respondents from the West and Midwest were the most likely to report that they had taken action to reduce their operating expenditures, though a majority of respondents in all regions had done so. Some 85.3 percent of respondents in the West and 84.7 percent in the Midwest said they had taken such actions. They were followed by the Northeast, where 83.4 percent had taken action to reduce expenditures. Respondents in the South Atlantic and South Central states were slightly less likely to have taken action to reduce their expenditures, with 80.5 percent and 80.2 percent, respectively, indicating they had done so.
That said, respondents in the South Atlantic states were more likely than those in other regions to report that they had reduced staff (36.2 percent); put construction or renovation plans on hold (31.5 percent); reduced their hours of operation (21.6 percent); shortened their season (20.4 percent); or closed facilities entirely (7.3 percent).
Respondents in the West were more likely than those in other regions to report that they had improved energy efficiency at their facilities (56 percent); or increased their fees (48.3 percent).
Respondents in the Midwest were more likely than those in other regions to report that they had cut programs or services (20.3 percent).
Construction Plans
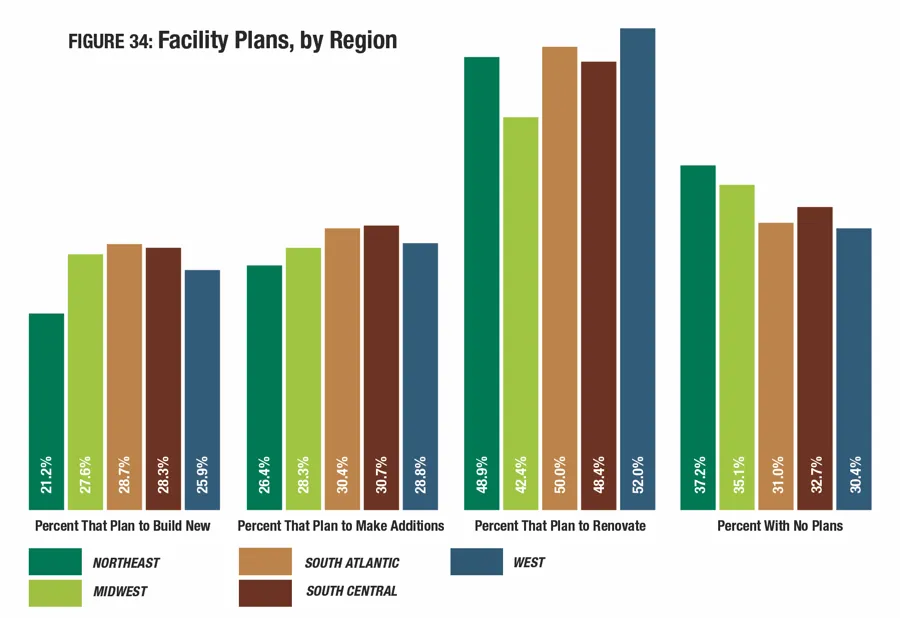
Respondents from the West and South Atlantic regions were the most likely to report that they had plans to build new facilities, or make additions or renovations to their existing facilities. Some 69.6 percent of Western respondents and 69 percent of South Atlantic respondents had plans for construction. They were followed by respondents in the South Central region (67.3 percent of whom planned construction); the Midwest (64.9 percent); and the Northeast (62.8 percent). (See Figure 34.)
Respondents in the South Atlantic were the most likely to be planning to build new, with 28.7 percent indicating they would be doing so. They were followed by the South Central region (28.3 percent of whom are planning new buildings) and the Midwest (27.6 percent). Respondents in the Northeast were least likely to be planning new construction, with 21.2 percent indicating they had such plans.
Plans for additions were most prevalent among respondents in the South Central region (30.7 percent report that they plan to make additions) and the South Atlantic (30.4 percent). Northeastern respondents were the least likely to be planning additions, though more than one-quarter (26.4 percent) indicated that they did have such plans.
Respondents from the West are the most likely to be planning renovations. More than half (52 percent) of Western respondents said they would be making renovations to their existing facilities. They were followed by those in the South Atlantic (50 percent of whom plan renovations), the Northeast (48.9 percent) and the South Central region (48.4 percent). Respondents in the Midwest are the least likely to be planning renovations.
Respondents in the South Atlantic region plan to spend the most on their construction plans, with an average cost of $4,086,000, 16.1 percent higher than the average for all regions. They were followed by the West, at $3,756,000, or 6.7 percent higher than the across-the-board average. In the South Central region, respondents' spending plans fall closely in line with the average for all regions, at just 0.1 percent less, or $3,514,000. Respondents in the Midwest plan to spend 2.2 percent less, and those in the Northeast have construction budgets that are 25.2 percent less than the average for all regions.
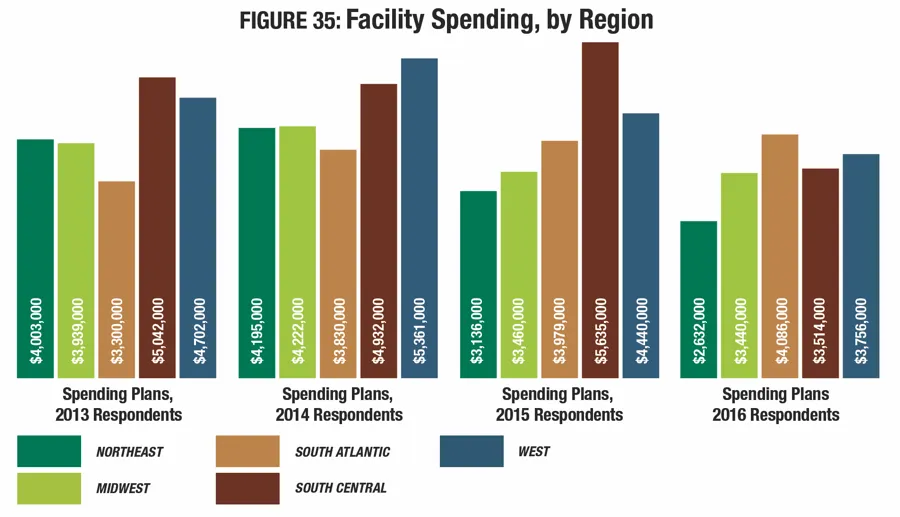
Most regions saw a decrease in their construction budgets from 2015 to 2016. The only exception is the South Atlantic region, which reported a 2.7 percent increase in construction budgets from 2015 to 2016. (See Figure 35.). The greatest decrease is found among those in the South Central states, with a 37.6 percent decrease. They were followed by the Northeast (down 16.1 percent) and the West (down 15.4 percent).
Sometimes the types of amenities included as a part of recreation, sports and fitness facilities can vary quite a bit from one region to another. These differences are usually easily explained when one considers the prevailing climate of specific regions (i.e., ice rinks make more sense in the frigid north than the sunny south). Other times, features first became popular in one region, such as skateparks in the West.
Respondents in the Northeast were more likely than other regions to feature: outdoor courts (60.6 percent include them); natural turf sports fields (58.2 percent); synthetic turf sports fields (28.5 percent); waterfronts and marinas (21.7 percent); ice rinks (17.7 percent); and challenge or ropes courses (12.4 percent).
Respondents in the Midwest were more likely than those in other regions to feature: bleachers and seating (60.5 percent include them); playgrounds (59.9 percent); locker rooms (57.7 percent); open spaces (54.8 percent); bike trails (32.2 percent); indoor aquatic facilities (29.7 percent); indoor tracks (24.2 percent); campgrounds (16.1 percent); and skiing or winter recreation areas (10.1 percent).
South Atlantic respondents were more likely than those from other regions to include: classrooms and meeting rooms (60.5 percent include them); park shelters (57.1 percent); indoor courts (54.3 percent); walking and hiking trails (50.3 percent); exercise studio rooms (44.3 percent); fitness trails or outdoor fitness equipment (24.1 percent); nature centers (13.9 percent); and amusements (4.5 percent).
In the South Central region, respondents were more likely than others to include: concessions (61 percent include them); Wi-Fi services (56.3 percent); fitness centers (51.6 percent); outdoor aquatic facilities (40.6 percent); outdoor tracks (28.3 percent); disc golf courses (25.2 percent); splash play areas (22.8 percent); and waterparks (15.7 percent).
Respondents from the West were more likely than their counterparts from other regions to include the following in their facilities: park restroom structures (50.2 percent include them); community centers (40.4 percent); skateparks (27.9 percent); childcare centers (24.1 percent); dog parks (22.8 percent); community gardens (20.8 percent); climbing walls (19.4 percent); golf courses (19.4 percent); and bike or BMX parks (9.2 percent).
Respondents from the South Central region were the most likely to report that they had plans to add additional features at their facilities over the next three years. They were more likely than those in other regions to be planning to add: splash play areas; walking or hiking trails; dog parks; park restroom structures; bike trails; disc golf courses; bleachers and seating; locker rooms; skateparks; waterparks; nature centers; outdoor aquatic facilities; campgrounds; and childcare centers.
Some 44.7 percent of Midwestern respondents said they had plans to add features at their facilities over the next few years. They were more likely than their peers in other regions to be planning to add: fitness trails and outdoor fitness equipment; park shelters; fitness centers; Wi-Fi; concessions; open spaces; challenge courses or ropes courses; indoor tracks; waterfronts or marinas; ice rinks; and skiing or winter recreation areas.
Some 42.2 percent of respondents from the West have plans to add more features at their facilities over the next few years. They were more likely than those in other regions to be planning to add: playgrounds; classrooms and meeting rooms; exercise studio rooms; natural turf sports fields; indoor courts; community centers; climbing walls; bike/BMX parks; and golf courses.
Some 41.8 percent of respondents in the Northeast are planning to add features at their facilities. They are more likely than those in other regions to be planning to add: synthetic turf sports fields; and community gardens.
Respondents from the South Atlantic region were the least likely to have plans to add features at their facilities over the next few years. Some 38.6 percent of respondents in this region had such plans. They were more likely than those in other regions to be planning to add: outdoor courts; indoor aquatic facilities; outdoor tracks; and amusements.
Programming
Looking at the specific types of programming offered according to region, the South Atlantic, West and Northeast are the most likely to offer the various sorts of programs measured by this study.
Respondents from the Northeast were more likely than those in other regions to offer: educational programs; day camps and summer camps; youth sports teams; arts and crafts; sports training; individual sports activities; trips; and climbing programs.
Respondents from the South Atlantic region were more likely than those from other regions to offer: holidays and special events; fitness programs; sports tournaments and races; personal training; environmental education; nutrition and diet counseling; camping programs; water sports like canoeing; and therapeutic programs.
Respondents from the West were more likely than those from other regions to offer: mind-body balance programs such as yoga; swimming programs; adult sports teams; active older adult programming; aquatic exercise; teen programs; performing arts; festivals and concerts; day care and preschool; and special needs programs.
Northeastern respondents were more likely than any others to report that they had plans to add programming at their facilities over the next few years. Some 34 percent of respondents in the Northeast had such plans. They were more likely than those in other regions to be planning to add: educational programs; fitness programs; mind-body balance programs; arts and crafts; holidays and special events; performing arts; individual sports activities; aquatic exercise; water sports like kayaking; trips; swimming programs; therapeutic programs; and climbing programs.
Some 31.3 percent of respondents in the South Atlantic region said they had plans to add programming at their facilities over the next few years. They were more likely than those in other regions to be planning to add: teen programs; active older adult programming; sports tournaments and races; special needs programs; adult sports teams; youth sports teams; nutrition and diet counseling; sport training; festivals and concerts; and personal training.
Some 31 percent of respondents in the West said they plan to add programs at their facilities over the next few years. They are more likely than those in other regions to be planning to add day camps and summer camps.
Some 30.5 percent of Midwestern respondents have plans to add programs over the next few years. They are more likely than those in other regions to be planning to add daycare and preschool programs.
South Central region respondents were the least likely to have plans to add programs at their facilities over the next three years. Some 29.9 percent of South Central respondents are planning to add programs. They are more likely than those in other regions to be planning to add environmental education programs.