


A Look at Trends in Colleges & Universities
Long after the Great Recession, colleges and universities have still not seen funding cuts restored, for the most part. In a report from the Center on Budget and Policy Priorities, titled "A Lost Decade in Higher Education Funding," the authors assert, "Overall state funding for public two- and four-year colleges in the 2017 school year was nearly $9 billion below its 2008 level, after adjusting for inflation. The funding decline has contributed to higher tuition and reduced quality on campuses as colleges have had to balance budgets by reducing faculty, limiting course offerings and in some cases closing campuses."
Of course, campus recreation and sports programs also have seen cuts as funding has dwindled, though many schools still invest in these programs as a way to boost quality of life for existing students while providing an attractive asset to boost recruitment.
Here, we'll take a look at how some of these trends are affecting our Industry Report survey respondents who represent colleges and universities, making up 10.8 percent of survey respondents in 2018.
As usual, the largest number of college respondents, 28.5 percent, are located in the Midwest. The next largest group, at 21.2 percent, are from the Northeast. They were followed by the West, with 18.2 percent, and South Central region, with 17.6 percent. The smallest number of college respondents are from the South Atlantic, with 14.5 percent. No college and university respondents reported from outside of the United States.
The largest percentage of college respondents in 2018 are from suburban communities. Some 38.3 percent of college respondents said they are from suburban areas. They were followed by urban college respondents, making up 35.9 percent of the group. They are least likely to be located in rural areas. Some 25.7 percent of college respondents said they are from rural communities.
On average, college respondents said they serve an average population of 43,910 people, up from 35,700 in 2017. College respondents are more likely than non-college respondents to report that they serve a population of 20,000 or fewer. More than two-thirds (67.3 percent) of college respondents said they reach 20,000 or fewer people, compared with 45.9 percent of non-college respondents. Conversely, while just 6 percent of college respondents reach an audience of 100,000 or more, 19.3 percent of non-college respondents reach a population of at least 100,000.
More than half (52.9 percent) of college respondents said they are with public colleges and universities. Another 38.2 percent are with private nonprofits, 4.1 percent are with for-profit organizations, and 4.7 percent listed their organization type as "other."
Respondents from colleges and universities manage an average of 4.4 facilities. They were more likely than non-college respondents to report that they manage between one and three facilities. Around two-thirds (66.5 percent) of college respondents said they manage between one and three facilities, compared with 58.9 percent of non-college respondents. Likewise, while 18.1 percent of non-college respondents said they manage 10 or more facilities, only 7.8 percent of college respondents said they manage 10 or more.
College respondents were far less likely than non-college respondents to report that they had partnered with other organizations, though a majority have done so. Some 79.5 percent of college respondents said they have formed such partnerships, compared with 87.5 percent of non-college respondents. The most common partners for college respondents are other colleges and universities. In fact, 61.4 percent of college respondents said they have partnered with other colleges and universities. Other partners for college respondents include: local schools (40.4 percent of college respondents had partnered with them), state government (30.7 percent), local government (24.1 percent) and nonprofit organizations (18.1 percent).
Revenues & Expenditures
College and university respondents continue to struggle with revenues and budgets. While a slightly greater number of college respondents said their budgets increased from 2016 to 2017 than from 2015 to 2016, there was also an increase in the percentage reporting lower revenues in that time period. Some 26.3 percent of college respondents said their revenues increased from 2016 to 2017, and 13.8 percent said they saw a decrease in revenues. (See Figure 47.)
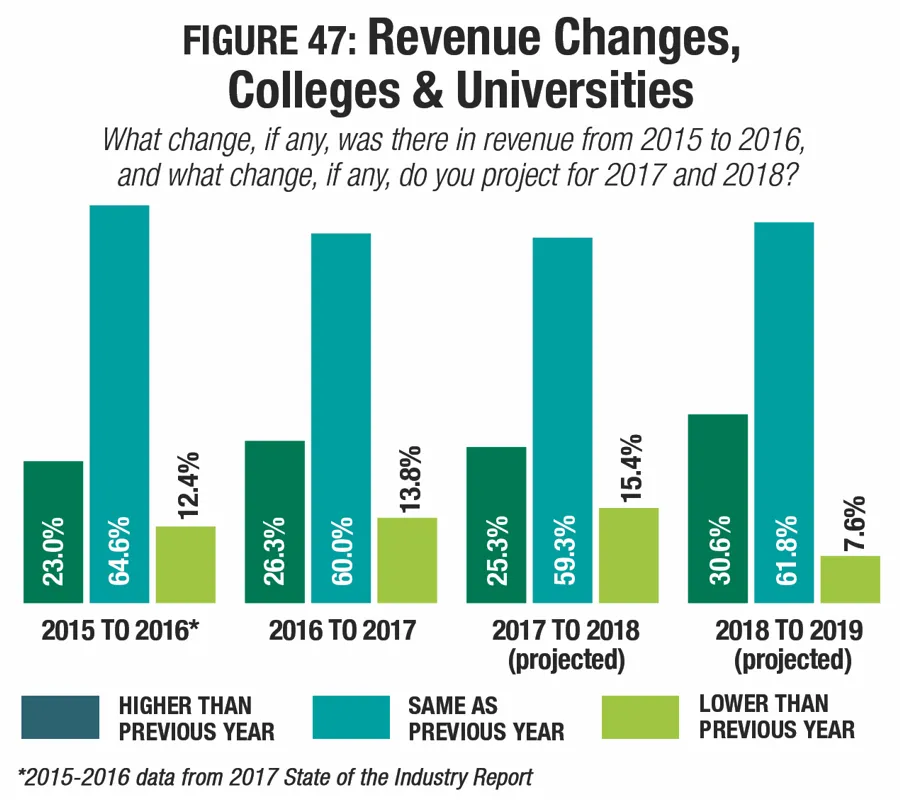
In 2018, college respondents are even less optimistic, with 25.3 percent expecting revenues to increase and 15.4 percent expecting them to decrease. They are slightly more optimistic for 2019, with 30.6 percent expecting an increase and 7.6 percent projecting a decrease.
While overall, respondents reported a decrease of 11.9 percent to operating expenses from 2016 to 2017, college respondents bucked that trend and reported a 1.3 percent increase, from $1,905,000 in 2016 to $1,930,000 in 2017.
Looking forward, college respondents expect their operating costs to grow at a faster clip than the rate for the general survey population. While all respondents reported that they expect operating costs to grow by 6.7 percent between 2017 and 2019, college respondents are expecting an 11.9 percent increase, from an average of $1,930,000 in 2017 to $2,160,000 in 2019.
On average, college respondents report that they recover 33.5 percent of their operating costs via revenue, representing no change from 2017. Colleges and universities have the lowest cost recovery rate of the facilities measured in the survey. More than half (50.9 percent) of college respondents said they recover 30 percent or less of their operating costs via revenue. Another 10.9 percent recover between 31 percent and 50 percent of their operating costs. Some 7.3 percent of college respondents earn back between 51 percent and 70 percent of operating costs. And 15.2 percent of college respondents said they recover 71 percent or more of their operating costs via revenue.
College respondents were less likely than non-college respondents to report that they have taken action to reduce their operating expenses, though a majority said they have done so. Some 76.2 percent of college respondents have taken such action (down from 80.5 percent in 2017), compared with 81 percent of non-college respondents. The most common actions taken by college respondents include improving energy efficiency (40.9 percent of college respondents have done so), reducing staff (33.5 percent), reducing hours of operation (25.6 percent), increasing fees (22.6 percent), and putting construction and renovation plans on hold (22.6 percent).
College respondents were more likely than their counterparts from other types of facilities to report that they have reduced staff or cut their hours of operation. More than one-third (33.5 percent) of college respondents said they have cut staff in order to reduce operating expenses, compared with 27.9 percent of non-college respondents. And while 25.6 percent of college respondents said they have reduced their hours of operation, just 15.5 percent of non-college respondents have done so.
College Facilities
The percentage of college respondents reporting an increase in the number of people using their facilities has fallen substantially over the past couple of years. In the 2017 study, we reported that the number of college respondents reporting an increase fell from 51.9 percent who saw an increase in 2015 to 41.3 percent who saw an increase in 2016. This year, just 38 percent of college respondents said the number of people using their facilities grew from 2016 to 2017. And the percentage who saw usage drop grew from 7.5 percent to 8.4 percent in that time period. (See Figure 48.)
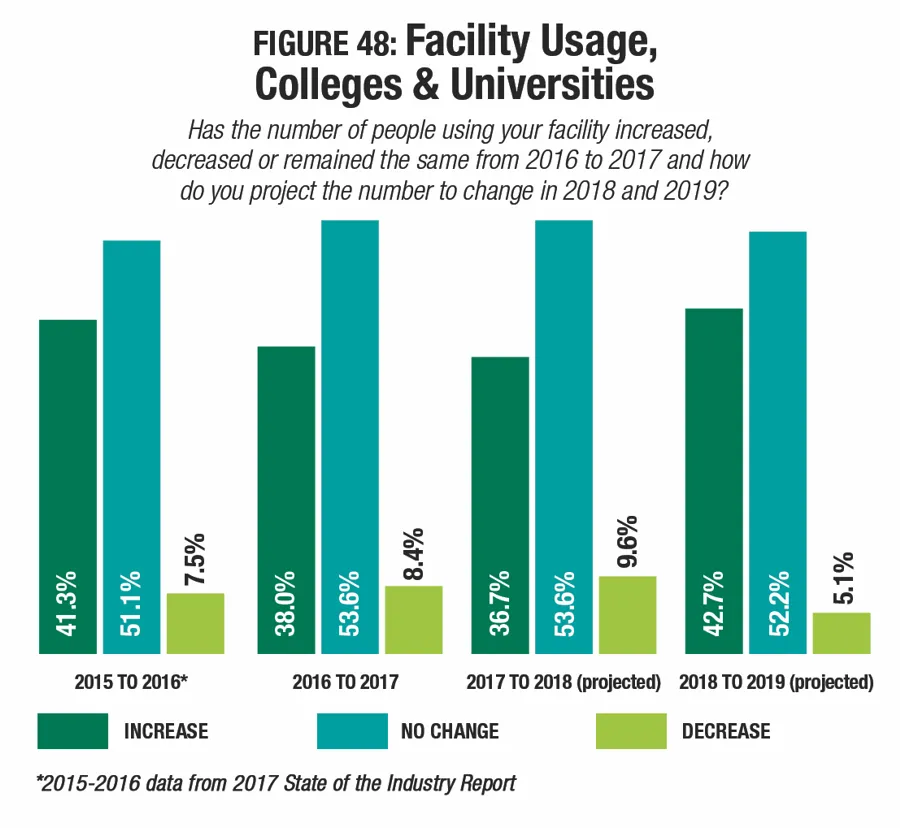
Looking forward, college respondents expect usage to fall again in 2018, with 36.7 percent expecting a drop this year, and 9.6 percent expecting a decrease. They are more positive about growth going forward, with 42.7 percent expecting the number of people using their facilities to grow from 2018 to 2019.
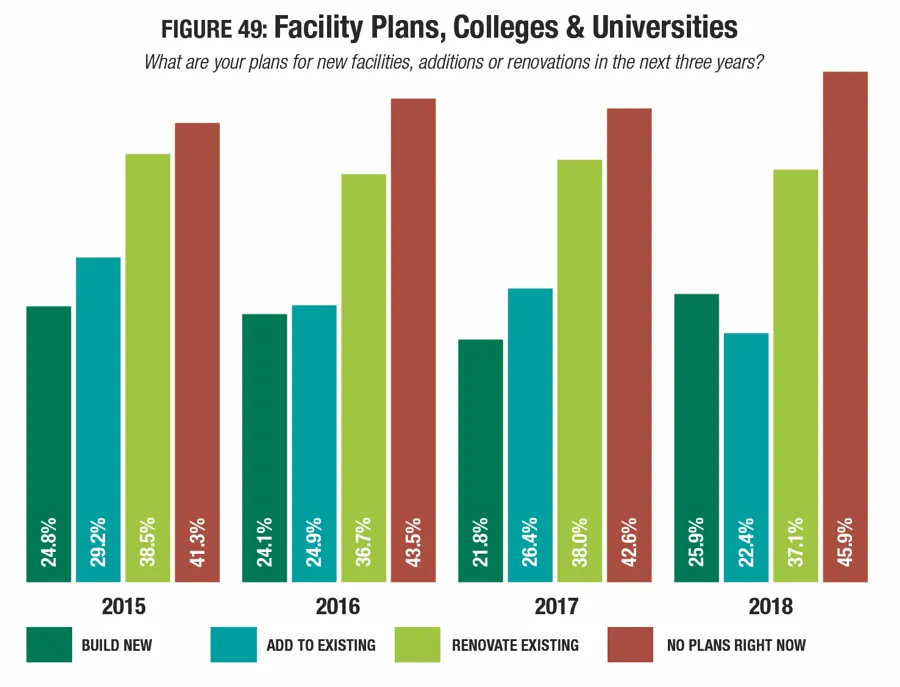
While the number of respondents with construction plans overall has grown over the past several years, for college respondents, those numbers have remained fairly steady, and actually fell in 2018. In fact, in 2018, just 54.1 percent of college respondents said they have plans for construction. This compares with 71.4 percent of non-college respondents who have construction plans.
While the number of college respondents with any construction plans fell, the percentage who are planning to build new facilities actually grew from 21.8 percent in 2017 to 25.9 percent in 2018. Another 22.4 percent of college respondents said they are planning to make additions to existing facilities, and 37.1 percent are planning renovations. (See Figure 49.)
Despite the fact that they are less likely than others to be planning construction, among college respondents who do have plans to build, their budgets for construction are the highest of the groups covered in the survey. College respondents with construction plans reported that they will spend, on average, 121.4 percent more than the average for all respondents--$9,500,000 vs. $4,290,000. In addition, while overall, respondents' construction budgets fell 0.2 percent from 2017 to 2018, college respondents saw their construction budgets grow 22 percent in that time frame, from $7,786,000 in 2017 to $9,500,000 in 2018.
There was little change in the past year in the various features most commonly found among college respondents' facilities. The 10 features that are currently most common include: fitness centers, locker rooms, indoor courts for sports like basketball and volleyball, classrooms and meeting rooms, exercise studio rooms, bleachers and seating, natural turf sports fields, indoor walking/running tracks, outdoor courts for sports like tennis and basketball, and Wi-Fi services.
College respondents were less likely than non-college respondents to report that they have plans to add features at their facilities over the next three years. While 43.9 percent of non-college respondents have such plans, just 36.5 percent of college respondents said they will be adding features. This is up from 32.4 percent in 2017.
The most commonly planned features for college respondents in 2018 include:
- Synthetic turf sports fields (planned by 32.3 percent of college respondents with plans to add features)
- Locker rooms (27.4 percent)
- Fitness centers (25.8 percent)
- Indoor tracks (21 percent)
- Exercise studios (19.4 percent)
- Bleachers and seating (17.7 percent)
- Classrooms and meeting rooms (17.7 percent)
- Climbing walls (17.7 percent)
- Indoor sports courts (16.1 percent)
- Wi-Fi services (12.9 percent)
Synthetic turf sports fields continue to hold the top position among planned features, growing from 28.6 percent in 2017 to 32.3 percent in 2018. There were also increases in the number of college respondents planning to add: locker rooms (up from 22.9 percent); fitness centers (up from 18.6 percent); exercise studios (up from 14.3 percent), bleachers and seating (up from 17.1 percent), and classrooms and meeting rooms (up from 17.1 percent). Commonly planned features in 2018 that did not appear on this list in 2017 include indoor tracks, indoor sports courts and Wi-Fi services. They replace fitness trails and outdoor fitness equipment, disc golf courses, and park restroom structures.
Programming
Some 96.9 percent of college respondents said they provide programming of some kind at their facilities. This compares with 97 percent of non-college respondents. Fitness programs continue to be the most commonly offered program among college respondents. Some 82.8 percent of college respondents said they provide fitness programs, representing virtually no change from 2017, when 83 percent of college respondents provided fitness programs.
Other programs common among college respondents include: mind-body balance programs such as yoga and tai chi (71.2 percent); educational programs (55.2 percent); sports tournaments and races (54.6 percent); swimming programs (53.4 percent); personal training (51.5 percent); individual sports activities such as running clubs or swim clubs (48.5 percent); adult sports teams (46 percent); day camps and summer camps (42.3 percent); and aquatic exercise programs (38.7 percent).
Program offerings that are provided by more college respondents in 2018 than in 2017 include: mind-body balance programs (up from 67.5 percent); sports tournaments and races (up from 52.8 percent); swimming programs (up from 42.9 percent); individual sports activities (up from 46.2 percent); and aquatic exercise programs (up from 36.8 percent).
College respondents were less likely than non-college respondents to report that they were planning to add more programs at their facilities over the next few years. While 33.1 percent of non-college respondents have such plans, just 20.6 percent of college respondents are planning to add programs. This is down from 25.9 percent in 2017.
The top 10 planned programs for college and university respondents include:
- Fitness programs (up from No. 4)
- Mind-body balance programs (down from No. 1)
- Educational programs (did not appear in 2017)
- Day camps and summer camps (down from No. 2)
- Holiday events and other special events (did not appear in 2017)
- Sports tournaments and races (down from No. 3)
- Aquatic exercise programs (up from No. 8)
- Nutrition and diet counseling (down from No. 6)
- Individual sports activities (no change)
- Personal training (down from No. 5)
New to the list in 2017 is holiday events and other special events. It replaces programs for active older adults.
Tough Turf
Synthetic turf sports fields continue to grow in popularity as a planned addition at both colleges and universities and schools and school districts, among other respondents.
This year, the number of college respondents who said they are planning to add synthetic turf grew to 32.3 percent, up from 28.6 percent in 2017.
Among respondents from schools and school districts with plans to make additions at their facilities, 36 percent said they would be adding synthetic turf sports fields, up from 34 percent in 2017.