


A Look at What's Happening in Recreation, Sports and Fitness Facilities
Over the past 13 years, we have collected and reported a great deal of information through our State of the Industry Report. Based on an extensive survey that collects information and opinions from a wide range of professionals working in the recreation, sports and fitness industry, this report brings you the most up-to-date information and trends in the industry, and because we've been collecting data for more than a decade, we can provide a broad look at how some things have remained the same, while others have changed over time. Here in these pages, you'll find that information—everything from budgets and staffing to construction plans, programming, and much more.
In the wake of the Great Recession, around a decade ago, the Industry Report survey results shifted, revealing facilities in a holding pattern as they adjusted to new pressures on operating budgets and revenues, as well as participation and construction plans. In the past several years, many of the facilities we cover here have moved forward, recovering and even thriving in the new normal that arose as the economy has recovered and thrived. Revenues have increased, construction plans have moved forward, and recreation, sports and fitness facilities have been able to devote themselves not only to maintaining their operations, but also to expanding their programming and even reaching out to expand their audiences.
In these pages, we provide a detailed look at the responses collected via our annual 50-question survey. Here, you'll get a look into the current state of affairs in the industry, with a hint of future trends that may have an impact on the management, operations, construction, programming, marketing, staffing and initiatives of recreation, sports and fitness facilities, from parks and rec centers to aquatic facilities, Ys, health clubs, schools, camps and beyond.
Before we dig in, let me take this moment to extend my gratitude to each reader who took the time to participate in the survey. We know it's a daunting task and are grateful that you took the time to provide detailed information on your own facilities and operations. The fact that so many participate fully every year shows just how important the industry is to you, and that the results reported here are meaningful. Thank you!
Survey Methodology
This report is based on a survey conducted for Recreation Management by Signet Research Inc., an independent research company. An e-mail was broadcast and respondents were invited to participate. From the launch of the survey on Jan. 23, 2019, to the closing of the survey on Feb. 19, 2019, 1,413 returns were received. The findings of this survey may be accepted as accurate, at a 95 percent confidence level, within a sampling tolerance of approximately +/- 2.6 percent.
We start here, with a general summary of the survey results, reporting on how the entire survey population of more than 1,400 respondents answered questions, and making occasional comparisons between respondents from different cohorts. After this section, you'll find further examination of the data broken down by facility type, beginning on page 36 with a deeper look at responses from respondents whose facilities include aquatic elements. After that, we dive into the responses from the largest facility-type cohorts in the survey population. This includes parks and recreation organizations, colleges and universities, schools and school districts, health clubs, and Ys, JCCs and Boys & Girls Clubs.
It's a lot of data, but if you need more, head over to the RecManagement.com website, and you'll find further discussion of responses from camp facilities and community centers. And, as always, we bring you a weekly dose of research in the Rec Report newsletter, highlighting a different data point every week. (Is there something you'd like to know? Shoot us a message at [email protected], and we'll see if we can find the answer in the data.) Finally, don't forget to stay tuned next month, when we'll report in our annual Salary Survey on the career and salary trends of these respondents.
Who Are You? Survey Says…
As always, survey respondents serve various functions and in a variety of roles within their organizations, with a majority working in higher-level positions. More than one-third (34 percent) said their job title was "director," down slightly from 36.1 percent in 2018. More than one-fifth (21.7 percent) are in administration and management positions, such as administrator, manager or superintendent. Another 15.9 percent work in operations and facility management, with titles including operations manager, facility manager, building manager or supervisor. Some 12.3 percent of respondents are in program and activity administration roles, such as activity or program director, manager, coordinator, specialist, coach and instructor. Some 6.1 percent of respondents said they are either the chairman, CEO, president, vice president or owner of their organization. Another 1.8 percent are faculty or teachers, while 0.6 percent are in services, such as planners, designers, architects and consultants. Finally, 7.6 percent of respondents said they hold "other" titles in their organization.
Considering that so many respondents hold high-level positions in the recreation, sports and fitness industry, it is not at all surprising that they have a lot of experience under their belts, both in their current positions, as well as in the industry. On average, respondents have been in their current jobs for 10.8 years, and have an average of 21.2 years of experience in the recreation, sports and fitness industry.
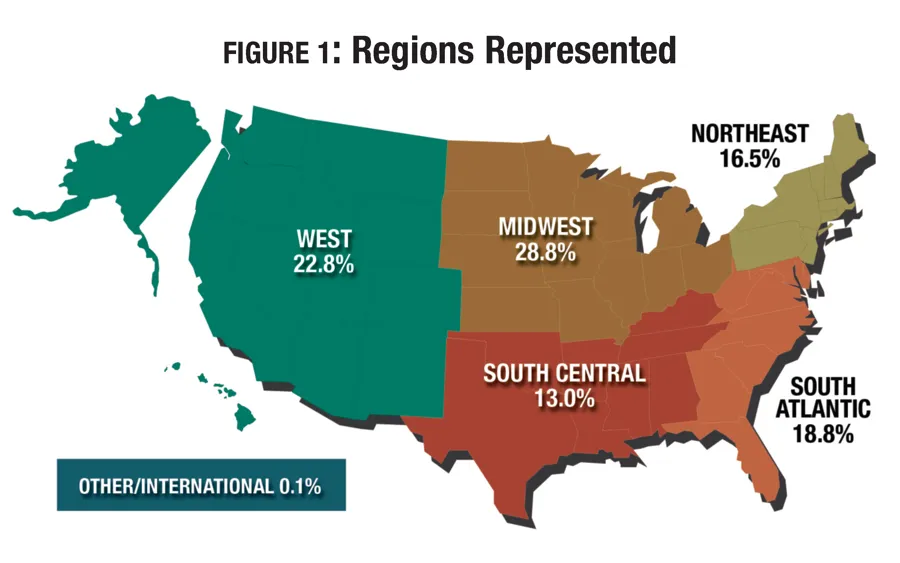
The largest number of respondents in 2019 were from the Midwest, with 28.8 percent of respondents indicating they were from Illinois, Indiana, Iowa, Kansas, Michigan, Minnesota, Missouri, Nebraska, North Dakota, Ohio, South Dakota or Wisconsin. (See Figure 1.)
The second largest region, in terms of survey representation, was the West, with 22.8 percent. This includes Alaska, Arizona, California, Colorado, Hawaii, Idaho, Montana, Nevada, New Mexico, Oregon, Utah, Washington and Wyoming.
The South Atlantic is home to 18.8 percent of survey respondents. This includes Delaware, Florida, Georgia, Maryland, North Carolina, South Carolina, Virginia, Washington, D.C., and West Virginia.
Some 16.5 percent of respondents said they are from the Northeast, including the states of Connecticut, Maine, Massachusetts, New Hampshire, New Jersey, New York, Pennsylvania, Rhode Island and Vermont.
Some 13 percent of respondents said they were from the South Central region, which includes Alabama, Arkansas, Kentucky, Louisiana, Mississippi, Oklahoma, Tennessee and Texas.
Finally, just 0.1 percent of survey respondents said they are from outside the United States.
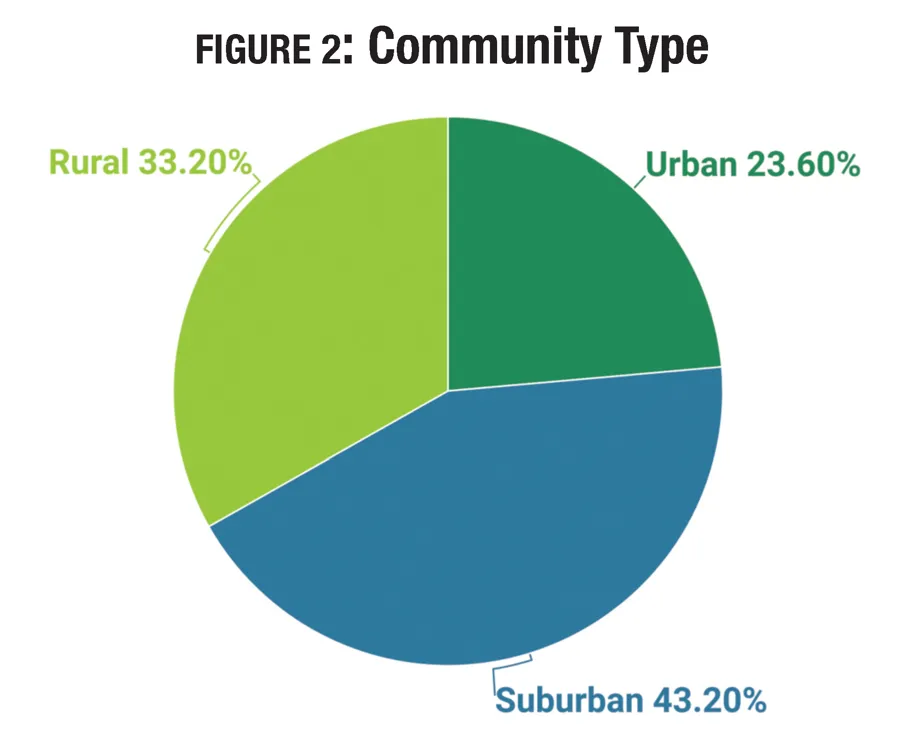
Similar to past years' surveys, the largest percentage of respondents in 2019 said they are from suburban communities. Some 43.2 percent of respondents call the suburbs home. Around one-third (33.2 percent) said they are from rural areas, and another 23.6 percent are from urban communities. (See Figure 2.)
On average, the departments, facilities and organizations represented in the Industry Report serve a population of 92,030 people. (See Figure 3.) Some 63.9 percent of respondents said their facilities reach an average population of 50,000 or fewer people, and more than three in 10 (30.9 percent) said they reach fewer than 10,000. Another 15.7 percent of respondents said they serve a population of 50,000 to 99,999 people. Some 9.9 percent said their facilities reach an average population of between 100,000 and 199,999 people. Finally, 10.5 percent of respondents said they reach a population of 200,000 or more.
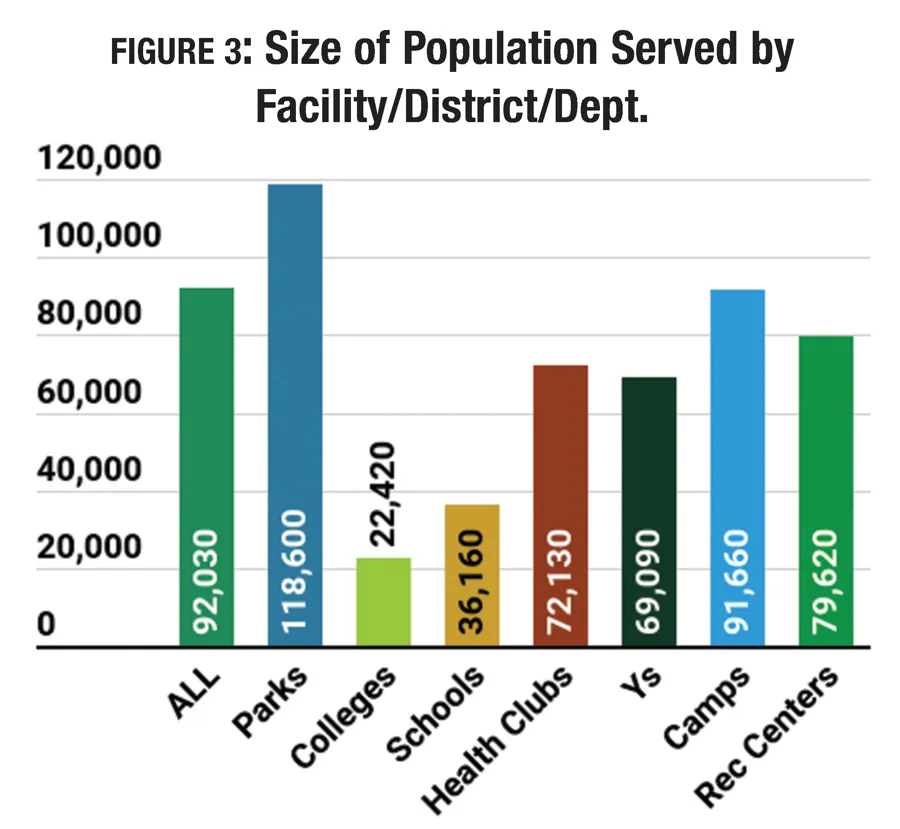
Respondents from parks and recreation districts and departments reach the largest population size, serving an average of 118,600. They were followed by camps, with an average population size of 91,660; recreation centers, with 79,620; and health clubs, with 72,130. The smallest populations were found among colleges and universities (22,420) and schools and school districts (36,160).
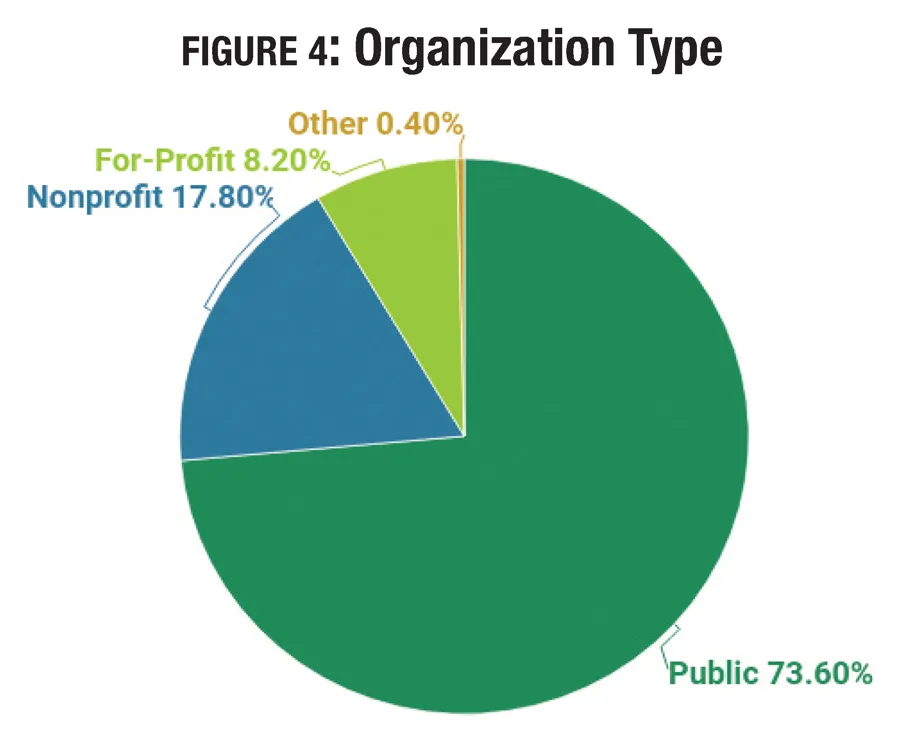
Respondents were most likely to report from public organizations, such as parks and recreation districts and departments, public universities and school districts. Nearly three-quarters (73.6 percent) of respondents said they were with public organizations. (See Figure 4.) They were followed by those working for private nonprofit organizations. Some 17.8 percent of respondents represent private nonprofits, such as Ys, Boys & Girls Clubs, JCCs and other similar facilities. Finally, 8.2 percent of respondents reported from private, for-profit organizations, which includes facilities like health clubs, resorts, waterparks and others.
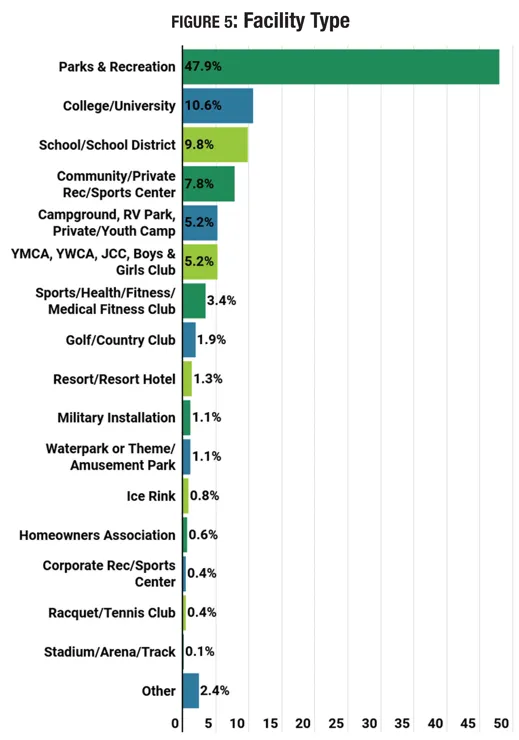
The largest percentage of respondents were from parks and recreation departments, park districts and similar organizations. Nearly half (47.9 percent) of respondents said they represented parks. (See Figure 5.) They were followed by respondents from colleges and universities (10.6 percent); schools and school districts (9.8 percent); community or private recreation and sports centers (7.8 percent); campgrounds, RV parks and private or youth camps (5.2 percent); YMCAs, YWCAs, JCCs and Boys & Girls Clubs (5.2 percent); and sports, health, fitness and medical fitness clubs (3.4 percent). Smaller numbers of respondents reported from other types of facilities, including: golf and country clubs (1.9 percent); resorts and resort hotels (1.3 percent); military installations (1.1 percent); waterparks, theme parks and amusement parks (1.1 percent); ice rinks (0.8 percent); homeowners associations (0.6 percent); corporate recreation and sports centers (0.4 percent); racquet and tennis clubs (0.4 percent); and stadiums, arenas and tracks (0.1 percent). Another 2.4 percent of respondents said they work for "other" types of facilities.
As you might expect, given the nature of their operations, some facility types are more likely to be found in certain types of communities. The most obvious example is camp facilities, 64.4 percent of which were located in rural communities. Schools and school districts were also more likely to be located in rural communities, with more than half (53.7 percent) indicating they were from rural areas.
Rec centers were most commonly found in the suburbs, with 47.3 percent indicating they were located in suburban communities. They were followed by respondents from parks, 45.8 percent of which were in suburban communities, and health clubs, with 45.6 percent located in the suburbs.
Colleges and universities were the only facility type that is more commonly found in urban areas than in other types of communities. Some 37.5 percent of college respondents said they were located in an urban community.
Likewise, when it comes to organizational structure, some types of facilities are more likely to be public or government-based organizations, while others are more likely to be nonprofit or for-profit organizations.
Nearly all (98.1 percent) park respondents indicated that they were with public organizations. They were followed by respondents from schools and school districts, 89.9 percent of whom represented public school districts. In addition, 64 percent of respondents from colleges and universities said they were with public schools.
Respondents from Ys were the most likely to report that they were a nonprofit organization, with 93.2 percent of Ys, and similar facilities like JCCs and Boys & Girls Clubs, indicating that they were private nonprofits. They were followed by camp facilities, more than half of which (52.1 percent) are operated as private nonprofits. In addition, 30.7 percent of college and university respondents said they worked for private schools.
Finally, private for-profit organizational structures were most commonly found among health clubs (45.8 percent of which operate as for-profit facilities), and camps (28.8 percent).
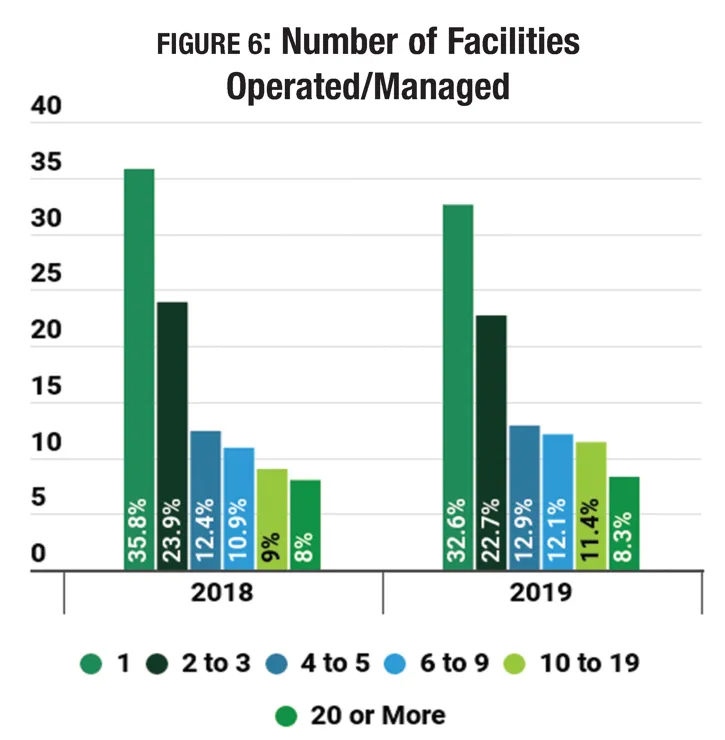
On average, survey respondents manage 7.9 facilities, slightly higher than in past years, when the average has ranged from 6.4 to 7.4. This is driven by a decrease in the percentage of respondents who indicate that they manage between one and three facilities, down from 59.7 percent in 2018 to 55.3 percent in 2019. Another quarter (25 percent) said they manage between four and nine facilities, up slightly from 23.3 percent in 2018. And another 19.7 percent said they manage 10 or more facilities, up from 17 percent in 2018. (See Figure 6.)
Respondents from urban and suburban communities were more likely than those from rural areas to report that they manage a larger number of facilities. Conversely, rural respondents were more likely to report that they manage a single facility. On average, urban respondents manage 9 facilities, suburban respondents manage 8.7 facilities, and rural respondents manage 6.1. Some 21.6 percent of urban respondents and 22.7 percent of suburban respondents said they manage 10 or more facilities, compared with 13.9 percent of rural respondents. On the other hand, 34.2 percent of rural respondents said they manage a single facility, compared with 32.8 percent of suburban and 29.9 percent of urban respondents.
Respondents from parks facilities were the most likely to report that they manage a larger number of facilities. On average, parks respondents manage 10.7 facilities, with 30.4 percent reporting that they manage 10 or more facilities. (See Figure 7.) They were followed by school respondents, who manage an average of 8.7 facilities, with 19.7 percent reporting that they manage 10 or more.
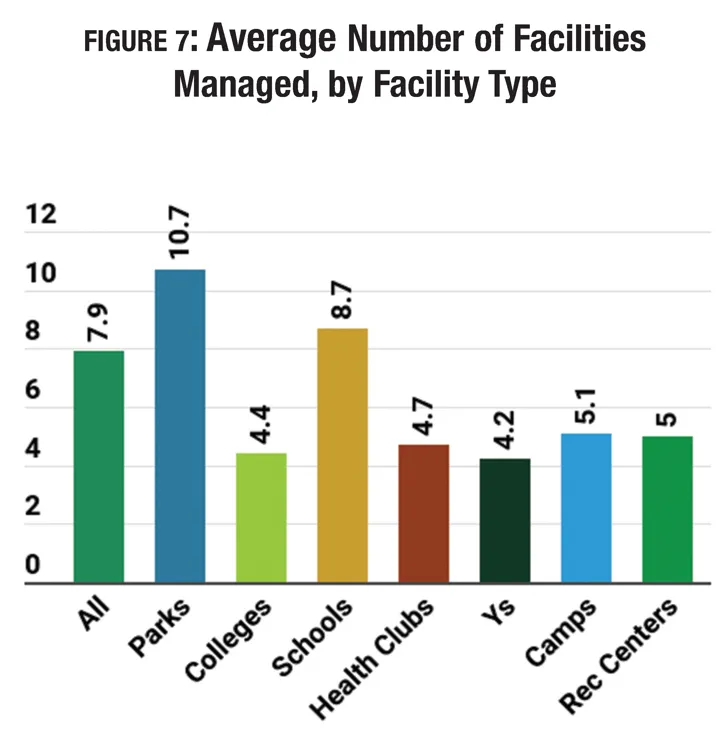
Respondents from health clubs, camps and recreation centers were the most likely to report that they manage just a single facility, with 64.6 percent of health club respondents, 54.8 percent of camp respondents and 50.9 percent of rec center respondents indicating that they manage just a single facility. However, respondents from Ys had the lowest average number of facilities managed, at 4.2 (compared with 4.7 for health clubs, 5 for rec centers and 5.1 for camps).
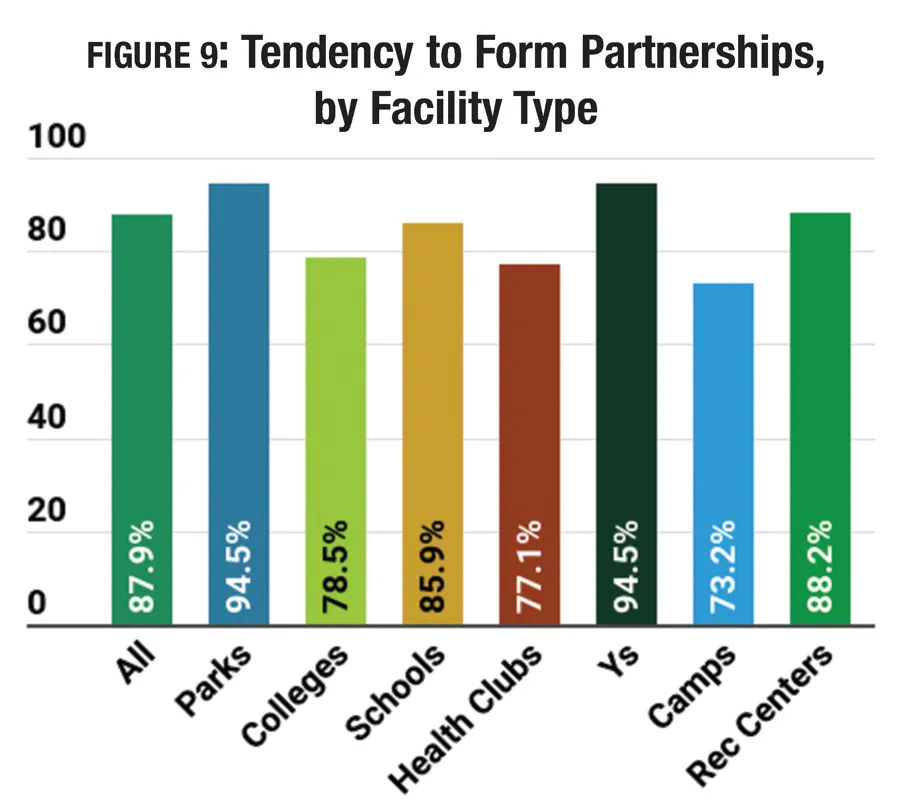
In order to expand programming capabilities and provide more opportunities for their participants, many recreation, sports and fitness facilities partner with other organizations. In fact, a substantial majority (87.9 percent) of respondents said they form these kinds of partnerships, a number that has held steady over time. (In 2018, 86.6 percent said they had formed partnerships, down slightly from 86.8 percent in 2017, and 87.2 percent in 2016.)
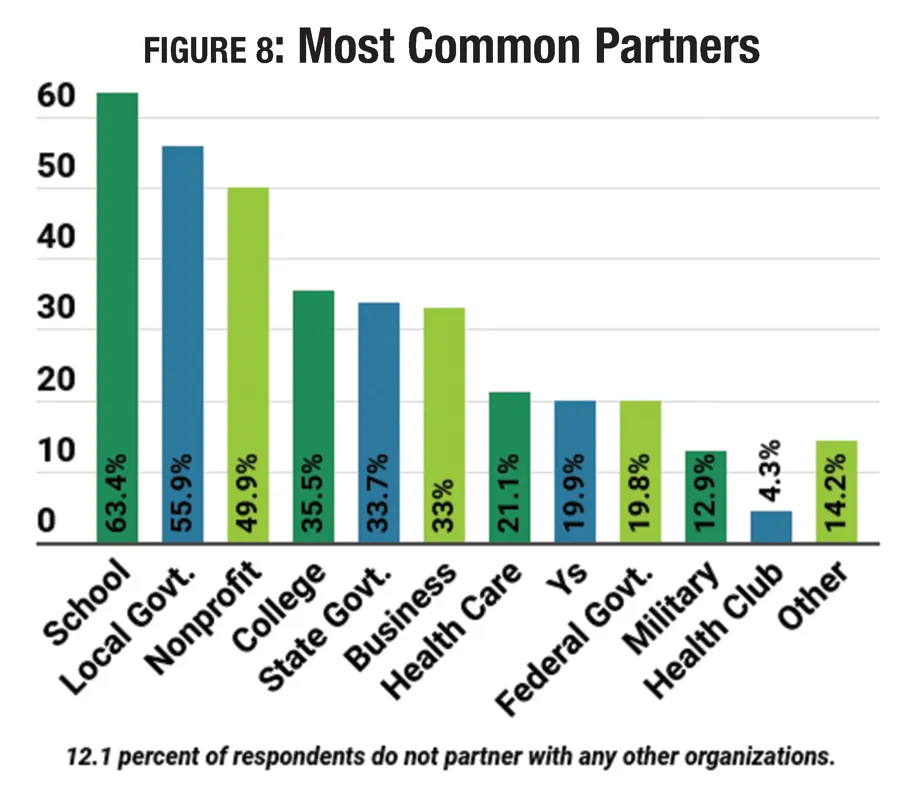
Local schools continue to hold the No. 1 spot as the most common type of partner for all facility types. More than six in 10 (63.4 percent) survey respondents said they had partnered with local schools. (See Figure 8.) They were followed by local government (55.9 percent), nonprofit organizations (49.9 percent), colleges and universities (35.5 percent), and state government (33.7 percent). Nearly one-third (33 percent) of respondents also said they partnered with corporations or local businesses.
Respondents from parks and Ys were the most likely to report that they had partnered with outside organizations, while those from camps were the least likely to form partnerships. Some 94.5 percent of parks respondents and the same percentage of respondents from Ys said they had partnered with other organizations, compared with just 73.2 percent of camps. (See Figure 9.)
While Ys and parks were the most likely to partner with any other organization, respondents from Ys were the most likely to report that they had partnered with many of the different types of organizations covered by the survey. Of the various respondent types, Ys were the most likely to indicate that they had formed partnerships with local schools (80.8 percent of Ys had partnered with local schools), nonprofit organizations (80.8 percent), health care facilities (60.3 percent), corporate or local businesses (57.5 percent), other Ys (50.7 percent), military (31.5 percent), and private health clubs (11 percent).
Respondents from parks were the most likely to report that they had partnered with local government, with nearly three-quarters (74.9 percent) of park respondents indicating they had formed such partnerships. Respondents from colleges and universities were the most likely to indicate that they had partnered with other colleges (62.4 percent). Those from schools were the most likely to have partnered with state government (45.2 percent). And finally, camp respondents were the most likely to report that they had partnered with the federal government (26.8 percent).
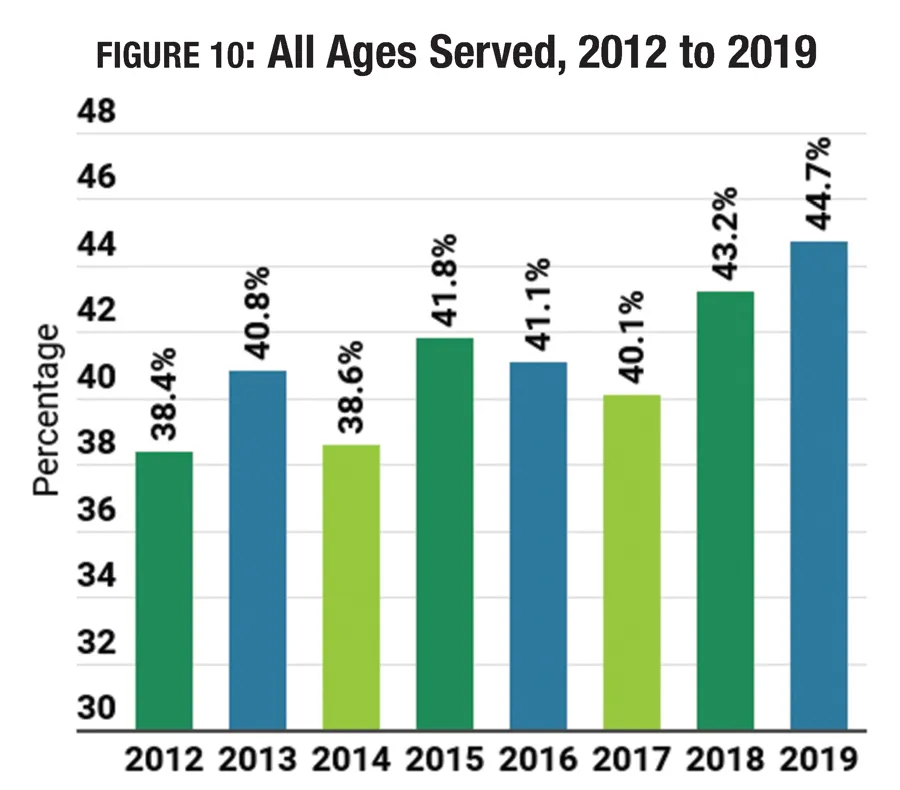
There has been a tendency over the past decade for more facilities to aim at multigenerational audiences, and this is reflected in the survey data. Since 2012, we have asked survey respondents to define the primary age group reached by their facilities and organizations. In that time, the percentage who said they serve all ages has grown from 38.4 percent to 44.7 percent. (See Figure 10.)
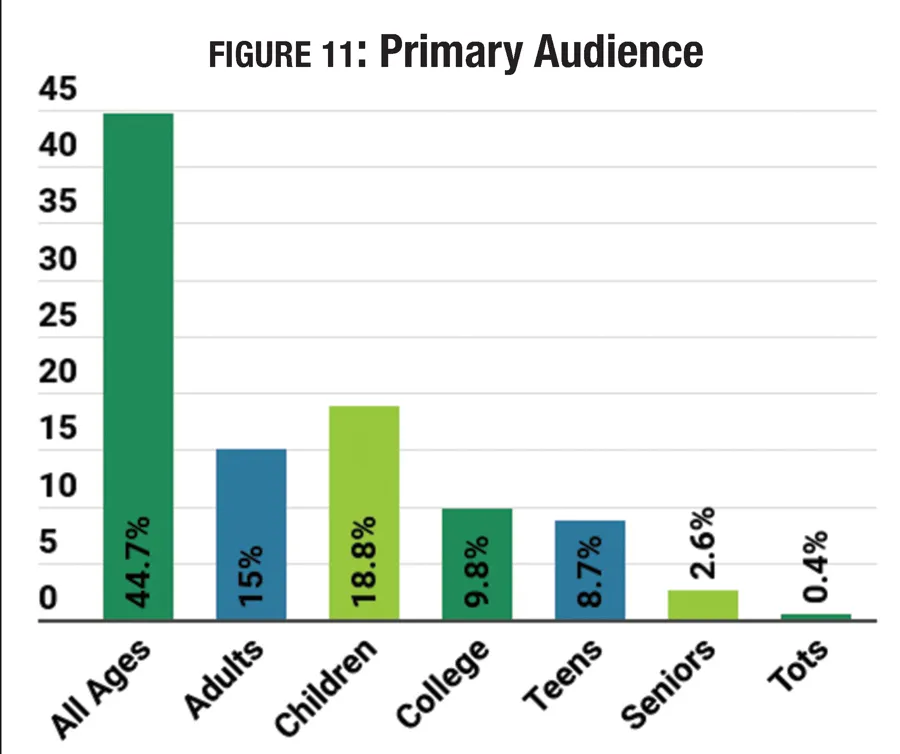
While the largest percentage of respondents in 2019 (44.7 percent) said their facilities serve all ages, the next largest group (18.8 percent) said they primarily serve children ages 4 to 12. Another 15 percent said they reach adults ages 19 and up. Smaller percentages said their primary audience was made up of college students (9.8 percent), teens ages 13 to 18 (8.7 percent), seniors 65 and older (2.6 percent), and infants and toddlers younger than 4 (0.4 percent). (See Figure 11 on page 17.)
Given the different nature of the programs and services offered by different facility types, it comes as no surprise to find that some are more likely to serve specific audiences (such as college students or adults) than others.
Respondents from parks were the most likely to report that they serve all ages, with 59 percent indicating that this is their primary audience. They were followed by Ys (56.2 percent) and recreation centers (45 percent).
Children ages 4 to 12 were most likely to be the primary audience for recreation centers, 25.7 percent of whom said they primarily reach children. They were followed by parks (25 percent) and camps (23.3 percent).
Adults from age 19 to 64 were most likely to be the primary audience for health club respondents, with 57.4 percent indicating this is the main audience they reach. They were followed by Ys, at 21.9 percent.
College students, obviously, were most likely to be the primary audience for college and university respondents, 90.7 percent of whom said this was their main audience. Teens were the predominant audience for schools and school districts (57.2 percent). And seniors were more likely to be the primary audience at recreation centers (6.4 percent) than other facility types.
Revenues & Expenditures
Since 2013, the percentage of respondents who report increasing revenues year-over-year has risen, from 39.5 percent to a projected 51.2 percent in 2020. At the same time, the number reporting that their revenues have fallen has dropped from 14.8 percent in 2013 to just 4.4 percent in 2020. (See Figure 12.) This represents a significant recovery from the lows reflecting the impact of the Great Recession, which occurred in 2011. In 2011, just 37 percent of respondents saw their revenues increase, while more than one-fifth (20.8 percent) reported a decrease in revenues.
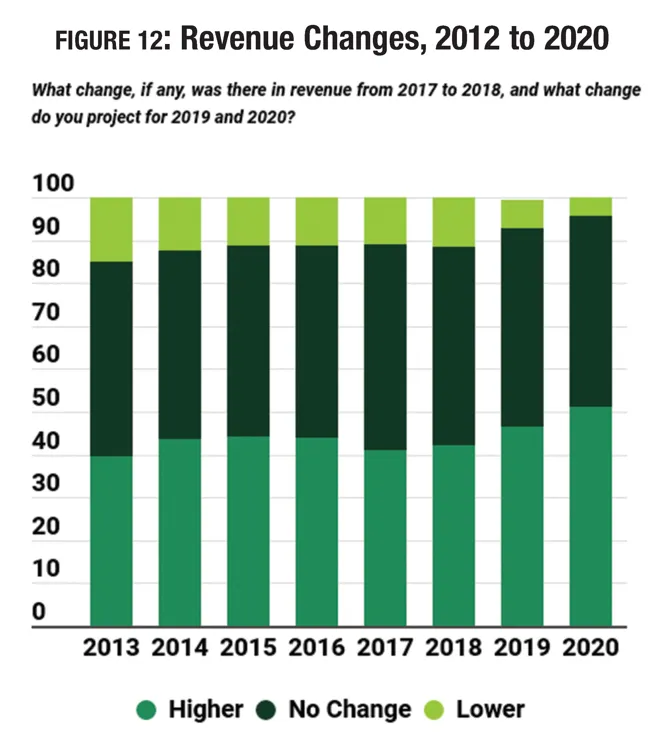
The year 2018 saw a slight jump in the number of respondents reporting lower revenues, with 11.8 percent indicating their revenues had fallen, up from 11.1 percent in 2017. At the same time, the percentage who reported an increase climbed from 41 percent to 42.3 percent.
Looking forward, respondents tend to be more positive. Some 46.6 percent are expecting revenues to increase in 2019 (with 6.7 percent projecting a decrease), and 51.2 percent expect an increase in 2020 (vs. 4.4 percent). However, it should be noted that in every year the survey has been taken, the percentage projecting increases has been slightly higher than the percentage who actually report an increase in that year. For example, when the survey was taken in 2018, 45.4 percent of respondents said they expected their revenues to increase in that year. This compares with 42.3 percent who actually reported an increase in that time frame in the 2019 survey.
Suburban respondents' revenues were more likely to change in 2018, compared with those from urban and rural areas. Some 45.2 percent of suburban respondents reported an increase in 2018, compared with 41.1 percent of urban respondents, and 39.5 percent of rural respondents. At the same time, while 12.6 percent of suburban respondents said their revenues decreased in 2018, 11.3 percent of urban respondents and 10.9 percent of rural respondents reported a decrease.
Respondents from facilities that were more likely to be private vs. public (i.e., camps, community centers, Ys and health clubs) were more likely than those that lean more toward public organizations (parks, colleges and schools) to report that their revenues had increased from 2017 to 2018. More than half of respondents from camps (54.2 percent), community centers (51.9 percent), Ys (51.5 percent) and health clubs (51.1 percent) said their revenues had increased from 2017 to 2018. This compares with 45.5 percent of parks, 28.5 percent of colleges, and 13 percent of schools. At the same time, respondents from Ys (25 percent), colleges (17.4 percent) and schools (11.5 percent) were more likely than others to report that their revenues had fallen from 2017 to 2018. Interestingly, among health club respondents, there was far less volatility in revenues than is usually seen, with just 6.4 percent reporting a decrease to revenues in 2018 (compared with 21.9 percent reporting a decrease in 2017), possibly reflecting the strengthening economy.
Similarly, looking forward, respondents from Ys, camps, community centers and health clubs were the most optimistic regarding revenue increases in 2019 and 2020, while colleges and schools continued to be more likely to expect revenues to either remain the same or decrease.
From 2018 to 2019, respondents from Ys (63.8 percent), camps (60 percent) and community centers (56.5 percent) were most likely to expect an increase in revenues, compared with just 30.5 percent of colleges and 17.7 percent of schools. From 2019 to 2020, increases in revenues are more likely for respondents from Ys (72.3 percent), camps (69.7 percent) and health clubs (62.5 percent).
After hitting an aberrant high of $2,044,000 in fiscal 2016, the average annual operating expenditure for respondents to the Industry Report survey has risen steadily over the past couple of years, and is expected to continue to increase more gradually. (See Figure 13.) In 2018, respondents saw a 1.1 percent increase to their average operating expenditures, from $1,800,000 in fiscal 2017 to $1,820,000. This represents a 25 percent increase since the average reported in 2012, of $1,456,000.
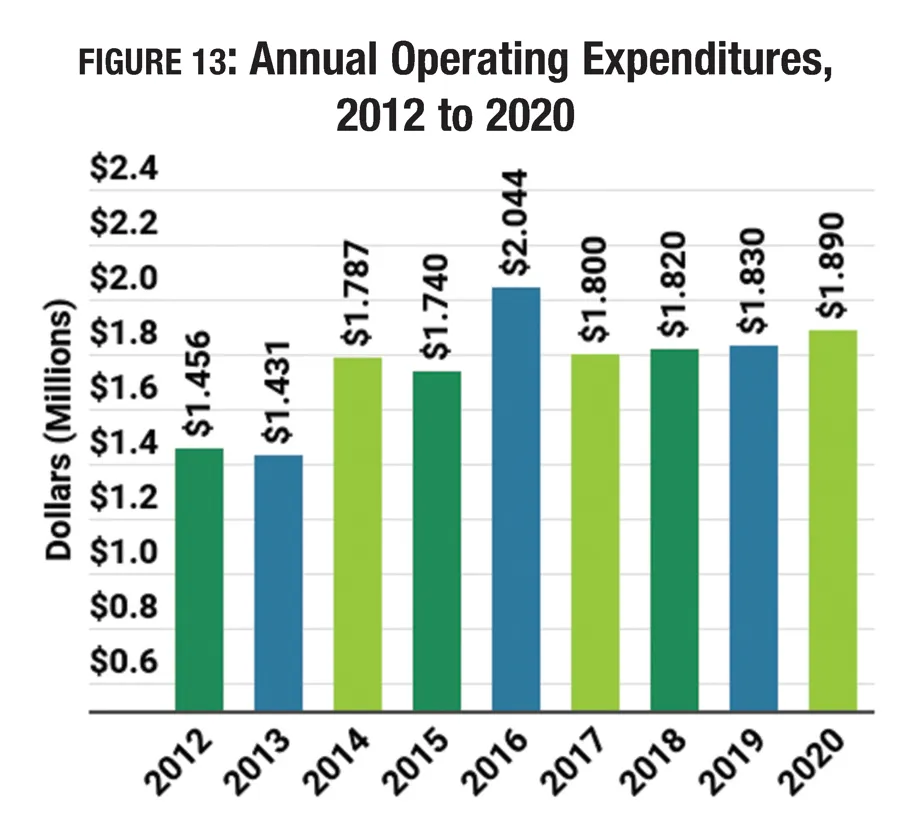
Looking forward, respondents are expecting their operating expenses to climb by 3.8 percent over the next two years, to an average of $1,830,000 in 2019 and $1,890,000 in 2020.
Respondents from urban communities reported a 13.8 percent increase in their average operating expenses, from $2,100,000 in 2017 to $2,390,000 in 2018. At the same time, rural respondents saw their average cost fall 1.9 percent, from $1,040,000 in 2017 to $1,020,000 in 2018; and suburban respondents reported a 4.9 percent drop, from $2,260,000 in 2017 to $2,150,000 in 2018.
Looking forward, rural respondents are expecting the greatest increase to their average operating expenses over the next two years. From 2018 to 2020, rural respondents said they expect their average operating expenses to grow 4.9 percent, to an average of $1,070,000. They were followed by suburban respondents, who projected a 4.2 percent increase, to $2,240,000. Urban respondents projected a 3.3 percent increase in average operating expenditures from 2018, to $2,470,000 in 2020.
From fiscal 2017 to fiscal 2018, only respondents from the Midwest reported an increase to their average operating expenditures, while all other regions saw a decrease. Among those in the Midwest, average operating expenses increased 33.6 percent, from $1,460,000 in 2017 to $1,950,000 in 2018. The greatest decrease was seen among respondents from the South Atlantic region, reporting a 29.5 percent drop from an average of $2,340,000 in 2017 to $1,650,000 in 2018. They were followed by the Northeast (a 6.7 percent decrease, from $1,350,000 to $1,260,000); the South Central region (a 3.3 percent decline, from $1,830,000 to $1,770,000); and the West (a 2.2 percent decrease, from $2,290,000 to $2,240,000).
Looking forward, every region except the West projected increases to their operating expenses from 2018 to 2020. In the West, respondents projected a 1.3 percent decrease in operating expenses, from an average of $2,240,000 in 2018 to $2,210,000 in 2020. The greatest increase is expected by those in the South Central region, who projected that their expenses would increase 8.5 percent, from $1,770,000 in 2018 to $1,920,000 in 2020. They were followed by those in the South Atlantic region (projecting a 7.3 percent increase, from $1,650,000 to $1,770,000); the Midwest (up 5.1 percent, from $1,950,000 to $2,050,000); and the Northeast (up 4.8 percent, from $1,260,000 to $1,320,000).
From fiscal 2017 to fiscal 2018, respondents from camps, colleges, health clubs and parks reported increases to their average operating expenditures, while other market segments reported decreases. The greatest increase was reported among camp respondents, who saw their average operating expense rise a dramatic 55.7 percent, from $880,000 in 2017 to $1,370,000 in 2018. They were followed by respondents from colleges (a 15.5 percent increase, from $1,930,000 to $2,230,000); health clubs (a 6.3 percent increase, from $1,580,000 to $1,680,000) and parks (a 0.5 percent increase, from $2,020,000 to $2,030,000). (See Figure 14.)
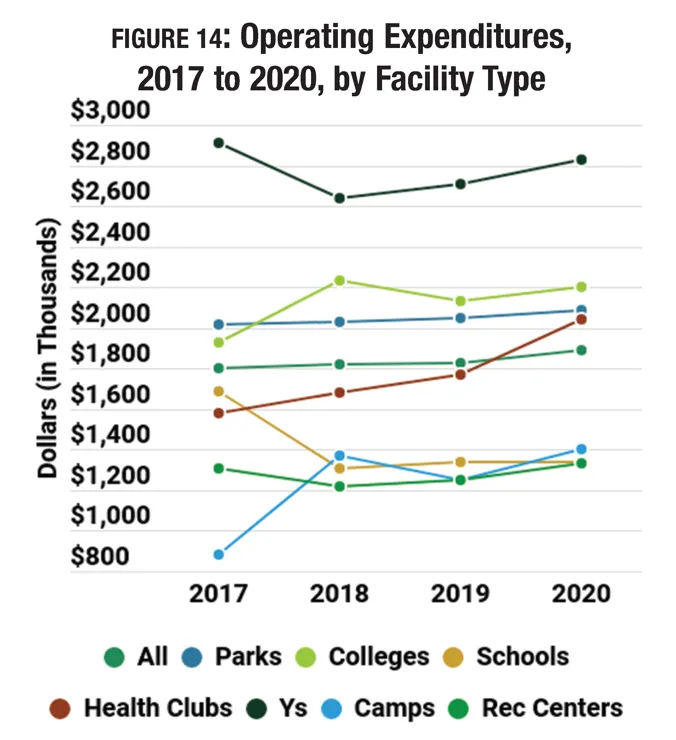
The sharpest decline in average operating expenses between 2017 and 2018 was reported by respondents from schools, who saw their average operating cost fall 22.5 percent, from $1,690,000 to $1,310,000. Decreases were also reported by respondents from Ys (down 9.3 percent, from $2,910,000 to $2,640,000), and rec centers (down 6.9 percent, from $1,310,000 to $1,220,000).
Looking forward, only college respondents expect their operating expenses to decrease between 2018 and 2020. They projected a 1.3 percent decrease, from an average of $2,230,000 in 2018 to $2,200,000 in 2020. The greatest increase in operating expenditures is expected among respondents from health clubs. Health clubs said they expect their operating expenses to climb 21.4 percent, from $1,680,000 in 2018 to $2,040,000 in 2020. They were followed by rec centers (a 9 percent increase, from $1,220,000 to $1,330,000); and Ys (a 7.2 percent increase, from $2,640,000 to $2,830,000). More modest increases are expected among respondents from parks (up 3 percent from $2,030,000 to $2,090,000); schools (up 2.3 percent, from $1,310,000 to $1,340,000); and camps (up 2.2 percent, from $1,370,000 to $1,400,000).
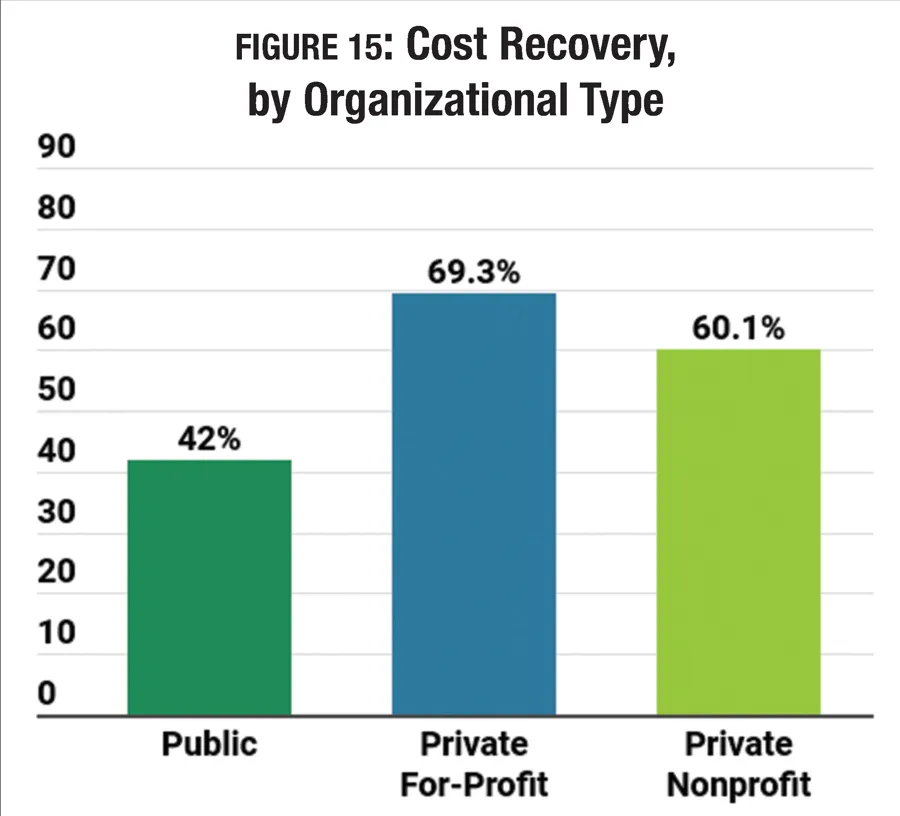
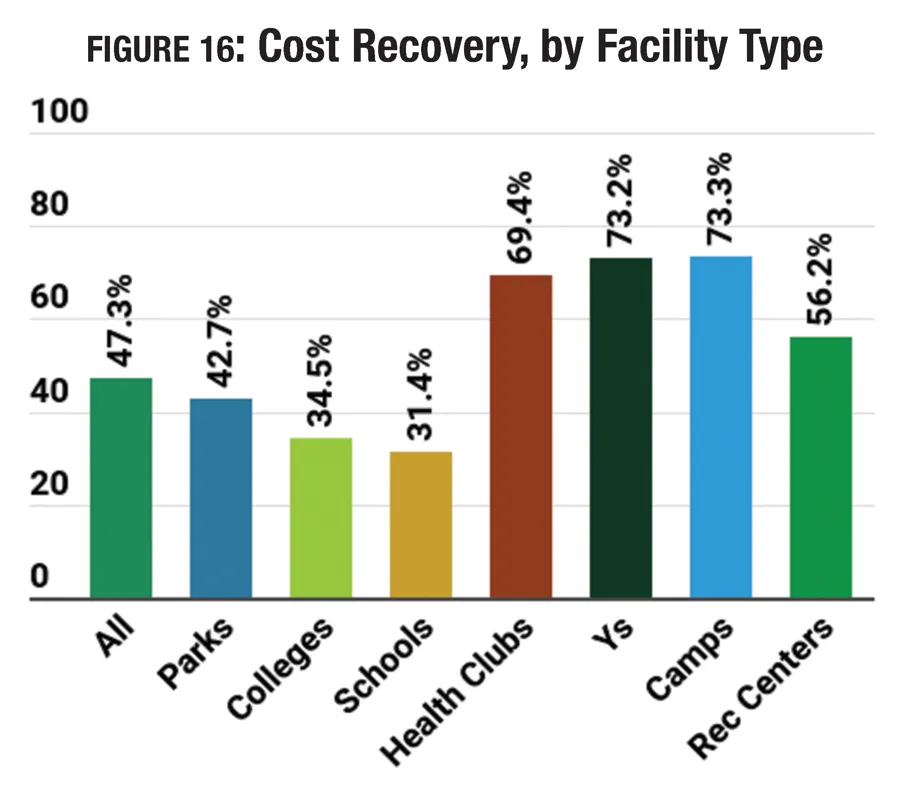
When it comes to costs and revenues, the percentage of costs recovered tends to depend on the type of organization represented. Obviously, private for-profit organizations will be more likely to cover a higher percentage of their operating expenditures via revenues than nonprofits and public organizations. On average, all respondents said they recover 47.3 percent of their operating costs via revenues, down slightly from 2018, when the average was 48.5 percent. For public organizations, 42 percent of costs are recovered. This compares with 60.1 percent for private nonprofits and 69.3 percent for for-profit organizations. (See Figure 15.)
There is a great deal of variance in the percentage of cost recovered via revenues, with some industry segments obviously relying more heavily on tax dollars, grants and other sources of income, while others receive little support outside of revenues. Respondents from camps, Ys and health clubs are the most effective at covering their operating costs with revenues. Camp respondents recover nearly three quarters (73.3 percent) of operating costs, while Ys earn back 73.2 percent and health clubs earn 69.4 percent. Respondents from schools and colleges recover the smallest percentage of their operating costs, with schools earning back 31.4 percent, and colleges earning 34.5 percent. (See Figure 16.)
While a majority of respondents (80.3 percent) reported that they had taken action to reduce their operating expenses in the past year, that number is down slightly from 2018, when 80.5 percent said they had taken such action, and 2017, when 83.3 percent had done so. In fact, the percentage of respondents who report that they have taken action to reduce their expenditures has consistently decreased since 2011, when 90.3 percent said they had done so, again reflecting a strengthening economy.
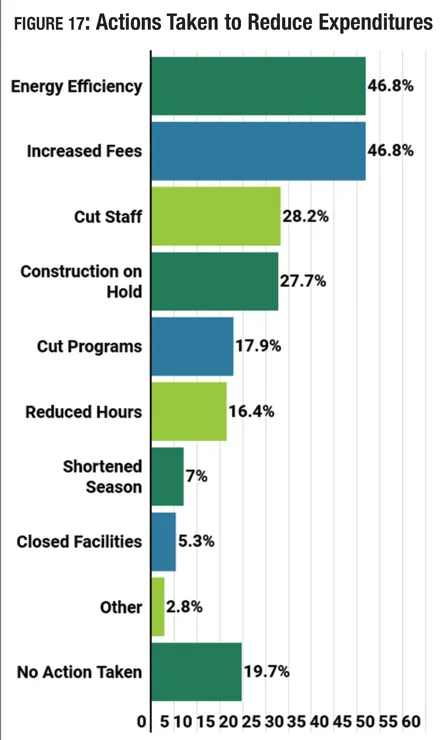
For the first time since this question was added to the Industry Report survey, improving energy efficiency does not hold the top spot as the most common action taken to reduce expenditures. Or at least, it is not alone at the top. Some 46.8 percent of respondents said they had improved energy efficiency to reduce their expenditures. (See Figure 17.) The same percentage said they had increased fees. Other common methods respondents turned to in order to reduce their operating costs include: reducing staff (28.2 percent) and putting construction or renovation plans on hold (27.7 percent). Smaller numbers of respondents said they had cut programming or services (17.9 percent), reduced their hours of operation (16.4 percent), shortened their season of operation (7 percent), closed facilities (5.3 percent) or taken some other action to reduce expenses (2.8 percent).
Respondents from Ys, camps, rec centers and parks were the most likely to report that they had taken action to reduce their expenditures. Some 93.2 percent of Ys, 91.7 percent of camps, 85.2 percent of rec centers and 81.4 percent of parks said they had taken such action. They were followed by respondents from colleges (79.1 percent) and health clubs (78.7 percent). Respondents from schools were the least likely to indicate that they had taken action to reduce their operating expenses, though two-thirds (66.7 percent) had done so.
Respondents from camps were the most likely to report that they had improved energy efficiency (63.9 percent) or put construction and renovation plans on hold (43.1 percent) in order to reduce their expenses.
Ys were more likely than those from other industry segments to indicate that they had increased their fees (71.2 percent) or reduced staff (43.8 percent).
Respondents from colleges were much more likely than others to report that they had reduced their hours of operation (28.4 percent) or closed facilities entirely (26.4 percent) in order to reduce their operating costs. They were also more likely than others to report that they had cut programs and services (23.6 percent).
Finally, park respondents were more likely than others to report that they had shortened their season of operation (9.3 percent).
Facility Usage & Membership
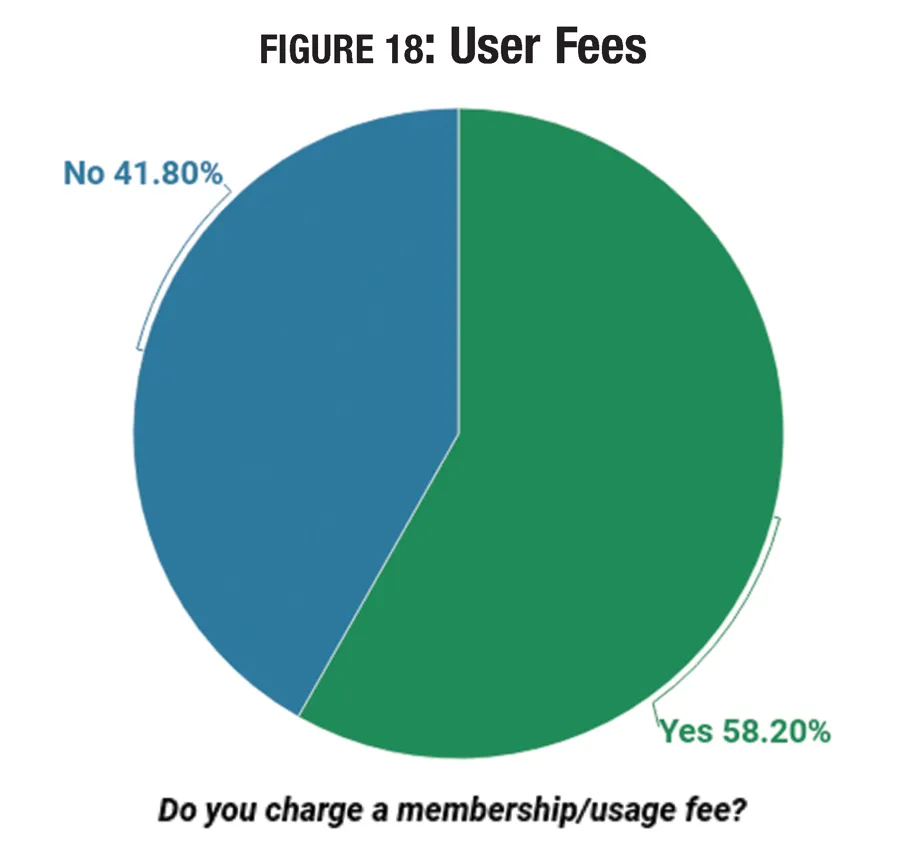
As is generally the case, around six in 10 respondents said they currently charge a fee for membership or for using their facilities. Some 58.2 percent said they charge a fee, down slightly from 59.5 percent in 2018, and 60.1 percent in 2017. (See Figure 18.)
Respondents from Ys, health clubs and colleges were the most likely to report that they charge a fee for membership or for using their facilities. Some 95.9 percent of Y respondents, 81.3 percent of health club respondents and 68 percent of college respondents said they charge a fee for membership or use.
Conversely, schools were the least likely to charge a fee. Only 18.7 percent of school respondents said they charge a fee for using their facilities.
Of those respondents who currently charge a fee for membership, the percentage who have increased their fees has grown slightly, from 30.2 percent raising their fees in 2016 to 41 percent who anticipate a fee increase by 2020. From 2017 to 2018, around one-third (33.5 percent) of respondents said they raised their fees, while 65.7 percent said fees remained the same, and 0.8 percent decreased fees. (See Figure 19.)
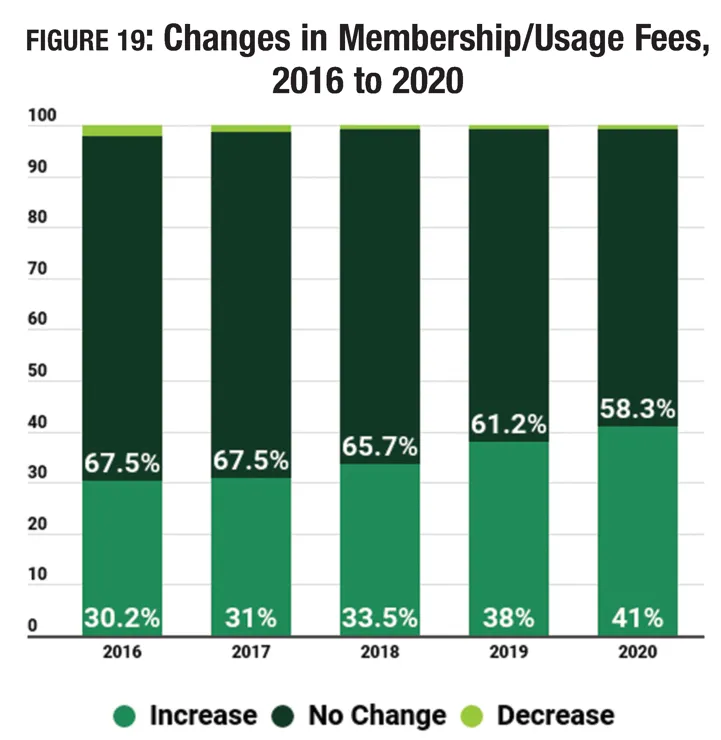
Looking forward, the percentage of respondents who expect fees to increase rises, to 38 percent in 2019 and 41 percent in 2020. At the same time, the percentage of respondents who expect their fees to remain the same falls to 61.2 percent in 2019 and 58.3 percent in 2020. Not surprisingly, very few respondents anticipate a decrease in fees.
Among facilities that charge a fee for membership or usage, camps, Ys and health clubs were the most likely to report that they had raised their fees from 2017 to 2018, while schools and colleges were the least likely to have raised fees. Some 57.9 percent of camp respondents who charge a fee said they had raised that fee in 2018, up from 47.9 percent who had raised fees in 2017. They were followed by Ys (44.9 percent) and health clubs (43.2 percent). Just 20.8 percent of college respondents and 20 percent of school respondents who charge a fee said the fee had increased from 2017 to 2018.
The trend holds over the next two years, with camps continuing to be the most likely to plan fee increases, and colleges the least likely to do so. From 2018 to 2019, 71.1 percent of camp respondents said fees will increase, and 53.8 percent of these respondents expect an increase in 2020. Among respondents from colleges and universities, 22.7 percent said they plan to increase fees in 2019, while 22.4 percent expect an increase in 2020.
Some 52.7 percent of respondents to the 2018 survey said they expected the number of people using their facilities to increase from 2017 to 2018. This year's survey showed slightly fewer (50.5 percent) respondents reporting that such an increase had taken place. Another 39.9 percent said usage of their facilities had remained the same, while 9.6 percent said usage had decreased. Interestingly, these figures are virtually unchanged from 2017. (See Figure 20.)
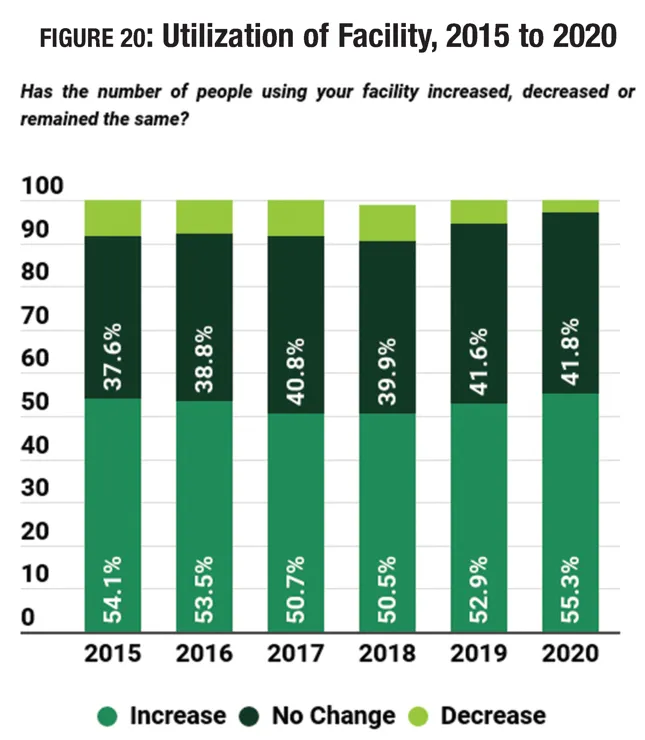
Looking forward, the percentage of respondents expecting to see further increases in the number of people using their facilities grows over the next two years, while the percentage expecting a drop in numbers falls. From 2018 to 2019, 52.9 percent of respondents expect an increase in the number of people using their facilities, while 5.5 percent are anticipating a decrease. And from 2019 to 2020, 55.3 percent of respondents said they expect an increase, while just 2.9 percent said they are anticipating a decline.
From 2017 to 2018, respondents from rec centers, parks and Ys were the most likely to report that the number of people using their facilities had increased, while those from schools were the least likely to report an increase. Some 60 percent of rec center respondents said the number of people using their facilities grew from 2017 to 2018. They were followed by parks (57.7 percent) and Ys (51.4 percent). Less than one-third of schools (30.3 percent) said the number of people using their facilities had increased in that time frame.
Looking forward, the same respondents who are most likely to have seen increases in the past continue to anticipate further increases. From 2018 to 2019, 67.9 percent of rec center respondents said they expect an increase. They were followed by parks (59.5 percent) and health clubs (57.4 percent). And from 2019 to 2020, 62.6 percent of rec center respondents are anticipating an increase in usage, followed by parks (61.1 percent) and Ys (58.5 percent).
Staffing
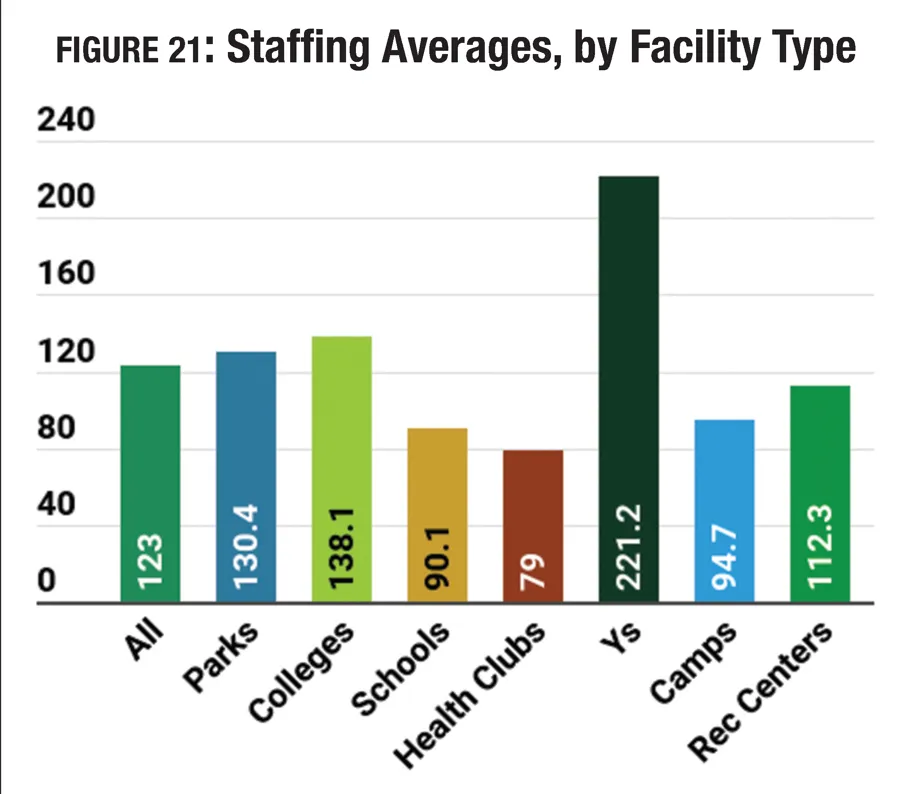
There was a slight increase in the average number of people employed at the organizations covered by the survey. After seeing a significant drop in average number of employees in the 2018 report, this year's respondents reported an increase of 6.4 percent, from 115.6 in 2018 to 123 in 2019. On average, this year's survey respondents employ 26.7 full-time workers, 47.9 part-time employees, 47.2 seasonal workers, 42 volunteers, and 12 employees of some other designation.
As is generally the case, Ys employ the highest number of employees, with an average of 221.2 total employees. They were followed by colleges, with an average of 138.1, and parks, with 130.4. Health clubs employ the smallest number of employees, with an average of 79. They were followed by schools, with 90.1. (See Figure 21.)
Schools have the largest number of full-time employees by far, with an average of 59.3, though this is significantly lower than the average of 67.5 reported in 2018. They were followed by colleges, with 26.8, and Ys, with 24.9. Camps had the smallest number of full-time employees, with an average of 15.1.
Ys employ the most part-time workers, with an average of 119. They were followed by colleges, with 93.3, and health clubs, with 44.3.
Seasonal employees were employed in greater numbers by Ys and parks. On average, Y respondents said they employ 57.5 seasonal workers, and park respondents employ 56.8. They were followed by camps, with 50.9.
Finally, as usual, volunteers were most common among Ys, where respondents make use of an average of 76.9 volunteers. They were followed by parks, with 50.3, and rec centers, with 48.7 volunteers, on average.
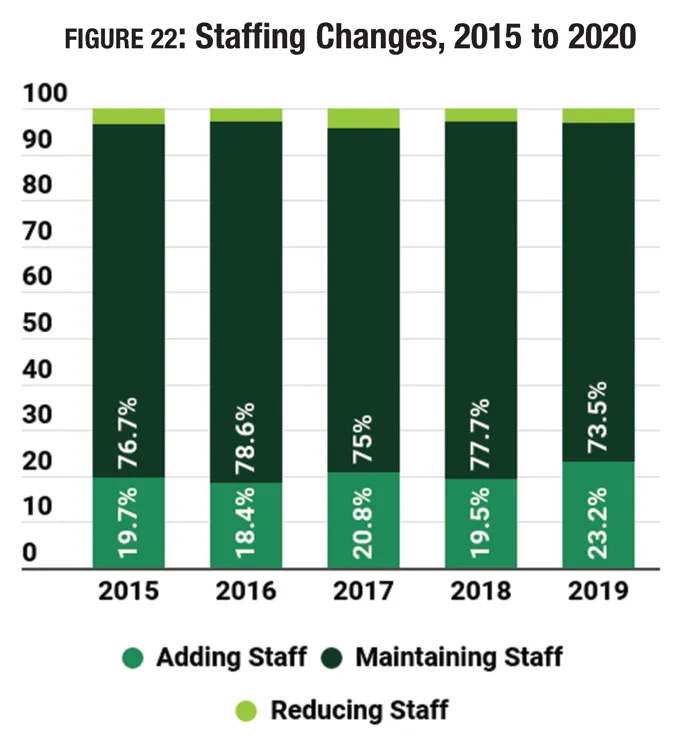
From 2015 to 2018, the percentage of respondents who report that they are planning to add staff at their facilities has hovered around 20 percent. In 2019, 23.2 percent of respondents said they were planning to add staff at their facilities, up from 19.5 percent in 2018. At the same time, the percentage of respondents who said they plan to maintain their current staff levels fell from 77.7 percent to 73.5 percent, and the percentage who plan to cut staff increased slightly, from 2.7 percent to 3.3 percent. (See Figure 22.)
On average, respondents who are planning to add staff at their facilities will be bringing on 23.4 employees in 2019, down slightly from 25.6 in 2018. Respondents in 2019 are planning to add 3.8 full-time employees, 11.5 part-time employees, 10 seasonal workers, and 15.9 volunteers.
Respondents from rec centers, parks, Ys and camps were the most likely to report that they have plans to add staff in 2019. More than one-quarter (27.3 percent) of rec centers said they had such plans. They were followed by parks (26.7 percent), Ys (26 percent) and camps (26 percent). Schools were the least likely to be planning to add staff, with just 11.5 percent indicating they would be adding staff in 2019.
Respondents from Ys and colleges were the most likely to have plans to reduce staff, though only a small minority said they will do so. Some 5.5 percent of Y respondents and 5.3 percent of college respondents said they would be cutting staff in 2019.
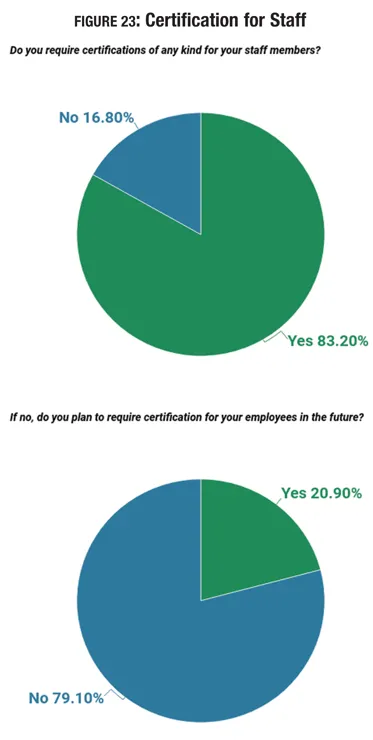
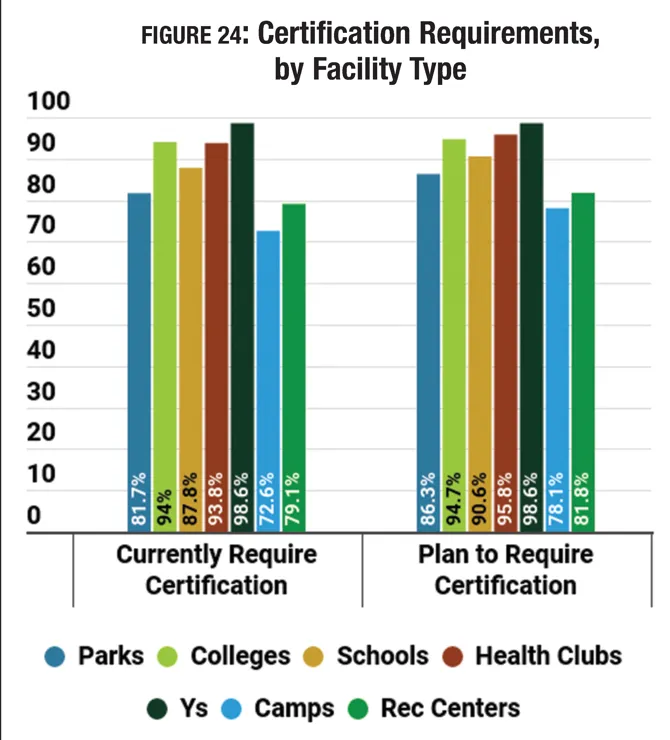
Certifications continue to be a powerful tool that organizations and their employees (and potential employees) alike rely on to encourage and measure ongoing professional development in the field. Some certifications help prove a certain level of skill and knowledge to maintain safety requirements (think lifeguard or foodservice certification), while others simply test and qualify other types of professional expertise. A majority of respondents (83.2 percent) said they require certifications for at least some of their staff members. This number is unchanged from 2018. Of the 16.8 percent who said they do not currently require certifications, 20.9 percent indicated that they plan to require them in the future. (See Figure 23.)
Respondents from Ys and health clubs are the most likely to require certification for some of their employees, both now and looking forward. Some 98.6 percent of Ys currently require certification, and the same number of Ys plan to require it in the future. And 93.8 percent of health club respondents said they currently require certification, while 95.8 percent plan to require it in the future. Respondents from camps were the least likely to report that they currently require certification, with 72.6 percent indicating it is a requirement. Looking forward, that number rises to 78.1 percent. (See Figure 24.)
Of those respondents that require certification, the most common types of certification required included CPR/AED/First Aid (required by 89.1 percent of those who said they require some staff members to be certified), background checks (85.4 percent), and lifeguard certification (60 percent). (See Figure 25.) More than one-quarter of respondents also require an aquatic management/pool operations certification (35.6 percent), personal training/fitness certification (30.1 percent), food service certification (27.4 percent) or pesticide application certification (26.5 percent). More than one in five require a coaching certification (22.4 percent).
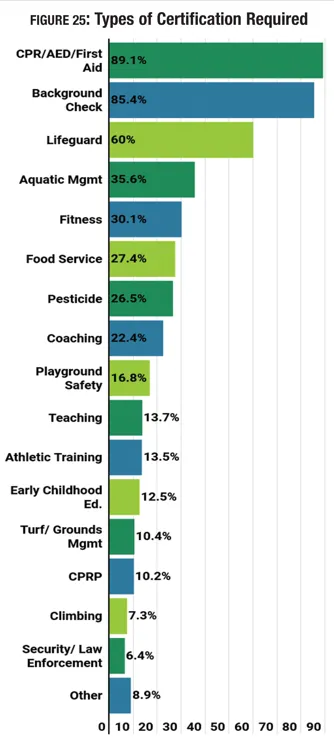
Respondents from facilities that include aquatic elements are obviously much more likely to require lifeguard and aquatic management or pool operations certifications for some of their staff members. While 60 percent of all respondents who require certification ask that some staff members achieve lifeguard certification, for those with aquatic facilities, that number jumps to 87.8 percent. And while 35.6 percent of all respondents require aquatic management and pool operations certification, 54.6 percent of those with aquatic facilities do so.
Given the varying nature of their operations and programming, it comes as no surprise that some industry segments are more likely to require certain types of certification than others. Respondents from parks were the most likely to report that they require pesticide application certification (40.4 percent), playground safety certification (31.3 percent), Certified Park and Recreation Professional (CPRP) certification (18.7 percent), turf and grounds management certification (14.5 percent), and security or law enforcement certification (13.6 percent). Ys were the most likely to require background checks (100 percent), CPR/first aid/AED training (98.6 percent), lifeguard certification (83.3 percent), aquatic management and pool operations certification (48.6 percent), and childcare/early childhood education certification (48.6 percent). Schools were the most likely to require coaching (66.1 percent) and teaching (57.9 percent) certifications. Camps were the most likely to require food service (54.7 percent) or climbing (32.1 percent) certifications. Health clubs were the most likely to require personal training or fitness certifications (84.4 percent). And finally, colleges were the most likely to require athletic trainer certifications (34 percent).
Facilities & Construction Plans
We've been asking survey participants how old their main facility is since 2013. In that time, facilities have aged from an average of 27.5 years in 2013. In 2019, respondents' facilities are, on average, 33.5 years old—a slight decrease from last year's 34.4 years. Slightly fewer respondents in 2019 than in 2018 said their facilities are more than 41 years old. Some 7.2 percent said their main facility is just 5 years old or newer, up from 6.2 percent in 2018. Another 21.9 percent said their facility is between 6 and 10 years old. Some 21.9 percent of respondents' main facilities are between 11 and 20 years old. Another 30.9 percent have main facilities that are between 21 and 40 years old. And just about one-third (33.2 percent) said their facilities are at least 41 years old, down from 34.3 percent in 2018. Of those, around half (16.5 percent of all respondents) said their facility is at least 50 years old, down from 17.6 percent in 2018.
The newest facilities are found among health clubs, colleges and rec centers. Respondents from health clubs said their main facility is 22 years old, on average. They were followed by colleges, with an average of 25 years, and rec centers, at 28.3 years. (See Figure 26.)
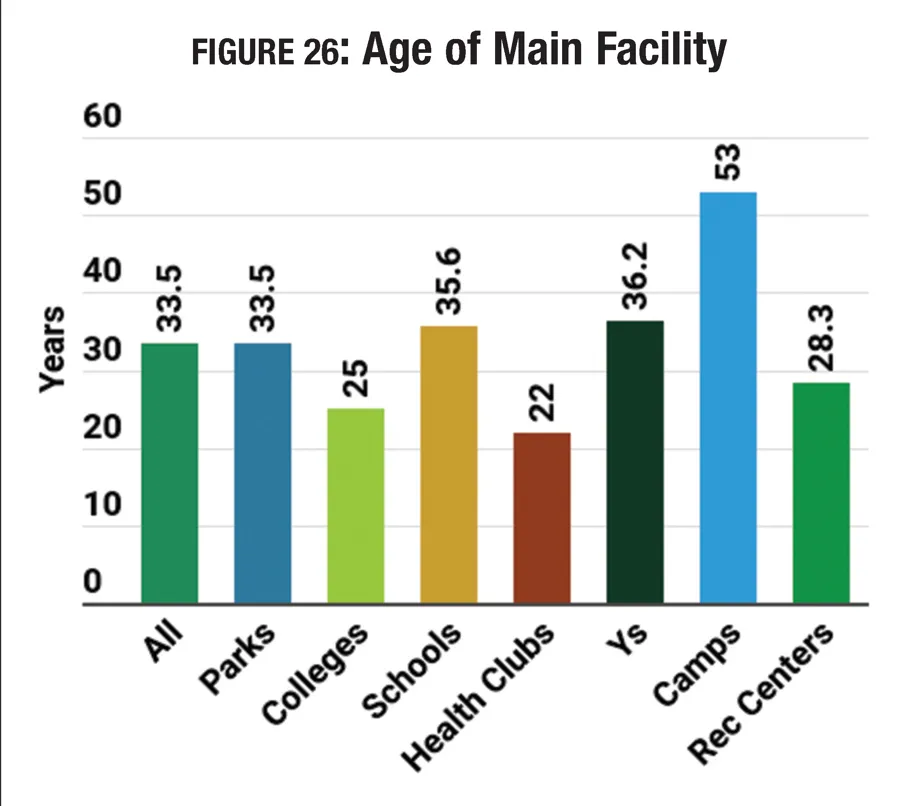
The oldest facilities are found among camps, Ys and schools. Camp respondents said their main facility is, on average, 53 years old, while Y respondents' main facilities average 36.2 years, and school respondents' facilities are 35.6 years old, on average.
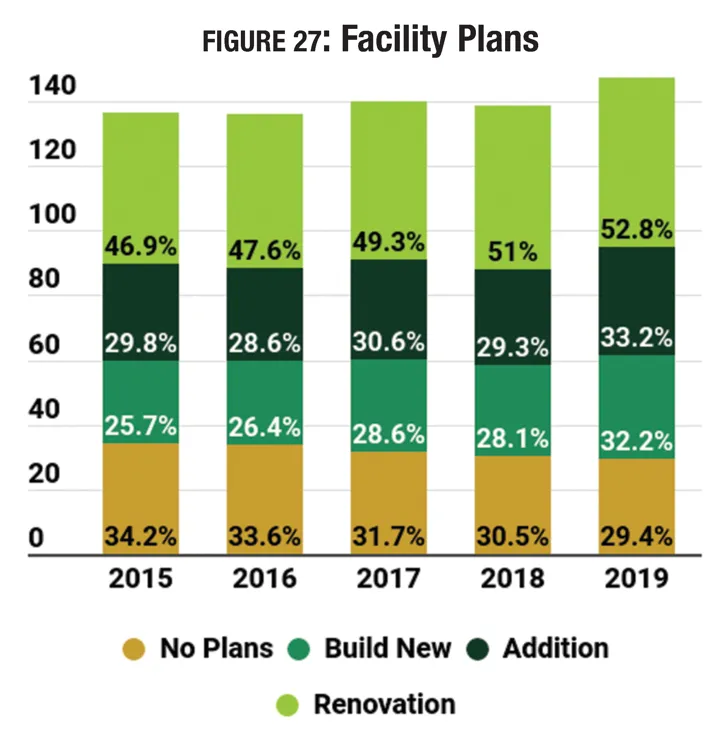
The percentage of respondents who are planning construction within the next several years has been climbing gradually, from a low of 62.7 percent in 2013 to 70.6 percent in 2019.
The number of respondents planning all kinds of construction grew this year. Those planning to build new facilities increased from 28.1 percent in 2018 to 32.2 percent in 2019. The percentage planning additions at their existing facilities increased from 29.3 percent in 2018 to 33.2 percent in 2019. And the number planning renovations to their existing facilities grew from 51 percent in 2018 to 52.8 percent in 2019. (See Figure 27.)
Camps generally have the oldest facilities, and also are the most likely to report that they have plans for construction of any kind. They were followed by parks and Ys. Some 83.6 percent of camp respondents said they have plans for construction (down from 85.9 percent in 2018), while 76.1 percent of parks and 74 percent of Ys are planning construction. Respondents from health clubs were the least likely to have construction plans, though more than half (56.3 percent) said they do plan construction within the next three years.
New construction, additions and renovations were all most commonly planned by camps. Some 69.9 percent of camp respondents were planning renovations, while 46.6 percent were planning new construction and 42.5 percent were planning additions. They were followed by parks respondents, 59.4 percent of whom are planning renovations, 35.6 percent additions and 38.8 percent new construction. Finally, 53.4 percent of respondents from Ys were planning renovations, while 39.7 planned additions and 24.7 percent planned new construction. (More information on construction plans for different industry segments can be found in the following sections.)
The average amount respondents are planning to spend on construction increased by 18.4 percent in 2019. On average, respondents are planning to spend $5,080,000 on construction. (See Figure 28.) Since 2011, the average budget for construction has been variable, but has gradually increased by 28.9 percent, from an average of $3,942,000.
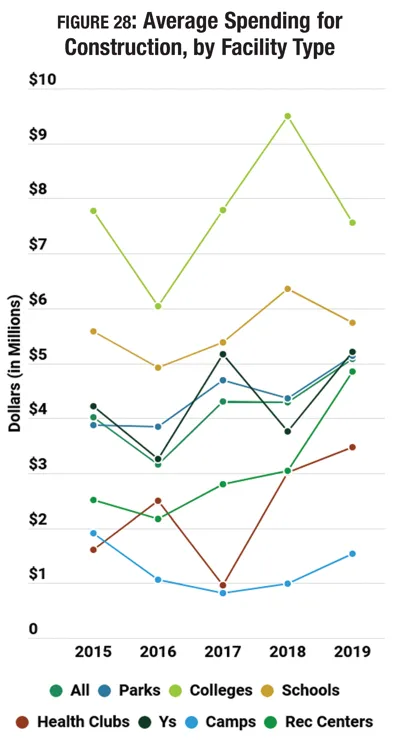
From 2018 to 2019, respondents from rec centers and camps reported the greatest increase to their average construction budgets. Among respondents from rec centers, the average budget for construction grew 59.5 percent, from $3,040,000 to $4,850,000. They were followed by camps, with a 55.6 percent increase, from $990,000 to $1,540,000; and Ys, with a 38.6 percent increase, from $3,760,000 to $5,210,000. More modest increases were reported by parks (up 17.7 percent, from $4,360,000 to $5,130,000) and health clubs (up 15.3 percent, from $3,010,000 to $3,470,000).
Respondents from colleges reported a decrease of 20.4 percent to their average construction budget, from $9,500,000 in 2018 to $7,560,000 in 2019. Schools also reported a drop, with construction budgets falling 9.7 percent, from $6,360,000 in 2018 to $5,740,000 in 2019. That said, the highest construction spending is still found among colleges and schools, with colleges in 2019 planning to spend 48.8 percent more than the average for all facility types, and schools spending 13 percent more.
The lowest construction costs were found among camps, who planned to spend 69.7 percent less than the average for all respondents. They were followed by health clubs, spending 31.7 percent less.
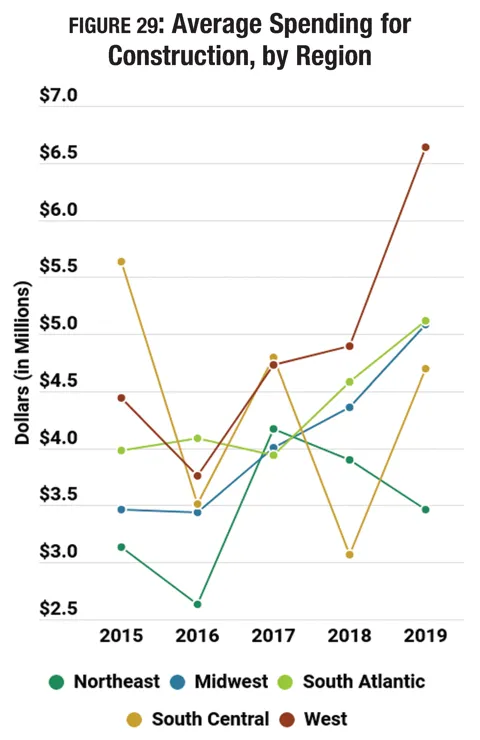
Respondents in the South Central region reported the highest overall increase in their average construction spending from 2018 to 2019. In this region, respondents' construction spending budgets increased 53.1 percent, from $3,070,000 in 2018 to $4,700,000 in 2019. They were followed by the West, where construction budgets rose 35.8 percent, from $4,890,000 in 2018 to $6,640,000 in 2019. Smaller increases were reported in the Midwest (up 16.5 percent, from $4,360,000 to $5,080,000) and the South Atlantic states (up 11.8 percent, from $4,580,000 to $5,120,000). In the Northeast, respondents saw an 11.3 percent decrease in the amount they plan to spend on construction, from $3,900,000 in 2018 to $3,460,000 in 2019. (See Figure 29.)
The top amenities included in respondents' facilities in 2019 include: bleachers and seating (62.5 percent of respondents include them in their facilities); playgrounds (60.9 percent); classrooms and meeting rooms (60.1 percent); outdoor sports courts (57.5 percent); concession areas (56.2 percent); natural turf sports fields (55.7 percent); park shelters (55.4 percent); locker rooms (55.3 percent); Wi-Fi services (55.3 percent); and open spaces like gardens and natural areas (54.1 percent). (See Figure 30.)
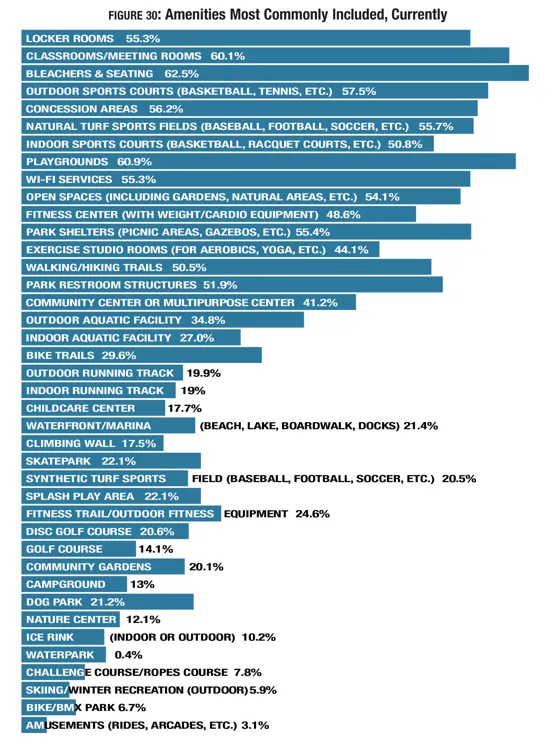
As is generally the case, there was not a great deal of change in the percentage of respondents whose facilities include various sorts of amenities from 2018 to 2019. However, certain types of amenities saw an increase of three percentage points or more in the past year: park restrooms (up 6 points); park shelters (up 5.3); fitness trails and outdoor fitness equipment (up 4.9); splash play areas (up 4.1); waterfronts and marinas (up 3.4); bleachers and seating (up 3.2); multipurpose centers (up 3.2); and synthetic turf sports fields (up 3.2).
Looking back five years to 2015, there has been an increase of at least four percentage points in the number of respondents whose facilities include: fitness trails and outdoor fitness equipment (up 7.4 points); park restrooms (up 6.3); dog parks (up 5.8); multipurpose centers and community centers (up 5.6); park shelters (up 5.5); playgrounds (up 4.9); splash play areas (up 4.9); and bleachers and seating (up 4.4).
Park respondents were more likely than other facility types to include: playgrounds (84.3 percent of park respondents had playgrounds); park shelters (82.5 percent); park restrooms (79.8 percent); walking and hiking trails (70.7 percent); outdoor sports courts (70.6 percent); open spaces such as gardens and natural areas (69.4 percent); bike trails (46.8 percent); skateparks (41.6 percent); dog parks (38.3 percent); fitness trails and outdoor fitness equipment (35.1 percent); splash play areas (33.3 percent); community gardens (31.1 percent); golf courses (20.6 percent); ice rinks (16.4 percent); waterparks (14.5 percent); and bike/BMX parks (11.4 percent).
Respondents from colleges and universities were more likely than other facility types to include: locker rooms (89 percent); indoor tracks (58.9 percent); synthetic turf sports fields (50.7 percent); and climbing walls (46.6 percent).
School respondents were more likely than others to include: bleachers and seating (78.8 percent); natural turf sports fields (78.1 percent); concession areas (75.2 percent); and outdoor tracks (63.5 percent).
Respondents from health clubs were more likely than others to have fitness centers (89.1 percent) and Wi-Fi services (73.9 percent).
Y respondents were more likely than others to include exercise studio spaces (88.7 percent); indoor sports courts (80.3 percent); classrooms and meeting rooms (73.2 percent); indoor aquatic centers (69 percent); and childcare centers (59.7 percent).
Camp respondents were more likely than others to include: campgrounds (67.6 percent); waterfronts and marinas (62 percent); outdoor aquatic facilities (53.5 percent); challenge courses and ropes courses (43.7 percent); disc golf courses (35.2 percent); nature centers (23.9 percent); skiing and winter recreation areas (11.3 percent); and amusements (4.2 percent).
The number of respondents who said they had plans to add features at their facilities over the next several years remained virtually unchanged in 2019, at 43 percent (down slightly from 43.1 percent in 2018). (See Figure 31.)
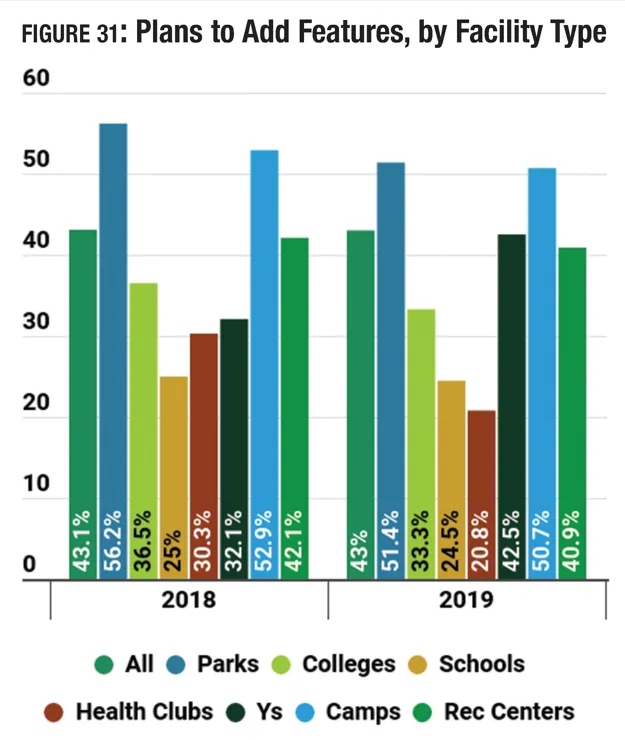
Respondents from parks and camps were once again the most likely to report that they had plans to add features. More than half of parks respondents (51.4 percent) and camp respondents (50.7 percent) said they had such plans. They were followed by Ys (42.5 percent) and rec centers (40.9 percent). One-third or fewer respondents from colleges (33.3 percent), schools (24.5 percent) and health clubs (20.8 percent) said they had plans to add features at their facilities over the next few years. The only facility type that saw an increase in the number who plan to add features from 2018 to 2019 was Ys.
The top 10 planned features for all facility types include:
- Splash play areas (21.1 percent of those with plans to add features will add splash play)
- Playgrounds (17.6 percent)
- Fitness trails and outdoor fitness equipment (17.1 percent)
- Synthetic turf sports fields (16.8 percent)
- Dog parks (15.7 percent)
- Park shelters (14.5 percent)
- Walking and hiking trails (13.8 percent)
- Park restrooms (13.8 percent)
- Bleachers and seating (12.9 percent)
- Fitness centers (12.5 percent)
Programming
There were only slight changes from 2018 in the types of programs commonly offered by survey respondents' facilities. The top 10 most commonly offered programs include: holiday events and other special events (provided by 65.3 percent of respondents); group exercise programs (60.2 percent); fitness programs such as cardio and strength (59.3 percent); youth sports teams (58.4 percent); educational programs (57 percent); day camps and summer camps (56.9 percent); mind-body balance programs such as yoga and tai chi (51.9 percent); adult sports teams (48.9 percent); arts and crafts (47 percent) and swimming programs (46.9 percent). (See Figure 32.)
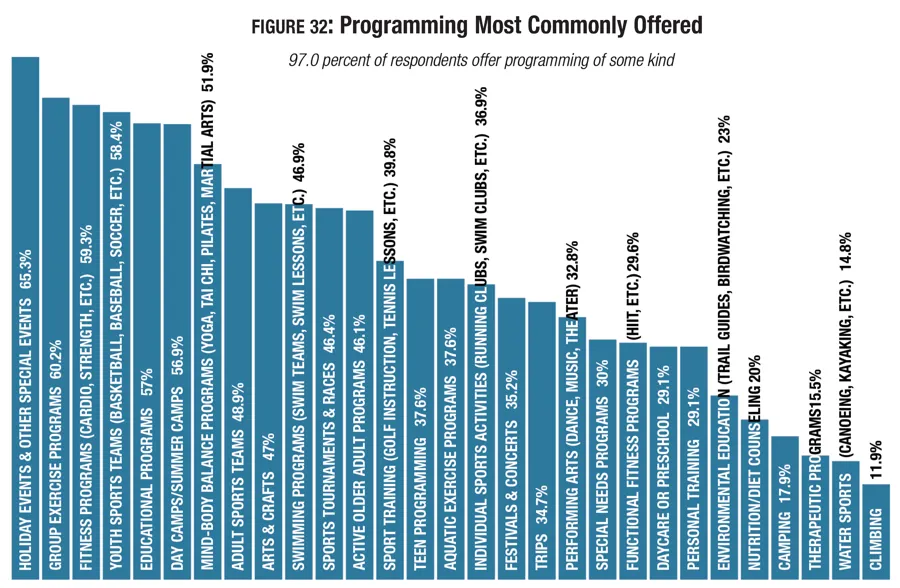
Most respondents—96.9 percent—said they offer programming of some kind. A full 100 percent of respondents from Ys, health clubs and rec centers said they offer programming of some kind at their facilities. They were followed by colleges (98 percent); parks (97.6 percent); schools (97 percent); and camps (95.8 percent).
As usual, respondents from Ys are the most likely to offer most sorts of programs. They were more likely than those from other types of facilities to provide: holidays and other special events; group exercise programs; youth sports teams; educational programs; day camps and summer camps; mind-body balance programs; swimming programs; programs for active older adults; teen programs; aquatic exercise; special needs programs; daycare or preschool; and therapeutic programs.
Respondents from parks were more likely than others to provide: adult sports teams; arts and crafts; sport-specific training; festivals and concerts; trips; and performing arts programs.
Respondents from health clubs were more likely than others to provide fitness programs; functional fitness programs; personal training; and nutrition and diet counseling.
College respondents were more likely than others to provide: sports tournaments and races; individual sports programs; and climbing.
Finally, camp respondents were more likely than others to provide environmental education and camping programs.
More than one in three (31.4 percent) respondents said they have plans to add more program offerings to their facilities over the next three years. This represents virtually no change from 2018, when 31.8 percent had such plans.
The 10 most commonly planned program additions in 2019 include:
- Group exercise programs (27.5 percent of those who have plans to add programs)
- Fitness programs (27 percent)
- Educational programs (26.6 percent)
- Programs for active older adults (25.9 percent)
- Mind-body balance programs (24.5 percent)
- Teen programs (23.4 percent)
- Day camps and summer camps (23 percent)
- Holidays and other special events (21.8 percent)
- Environmental education (21.8 percent)
- Special needs programs (21.6 percent)
This was the first year that group exercise programs were offered as a separate option from fitness programming in the survey. Other programs that are planned by more respondents in 2019 than in 2018 include: fitness programs (27 percent in 2019 vs. 25.9 percent in 2018); educational programs (26.6 percent vs. 25.7 percent); programs for active older adults (25.9 percent vs. 17.1 percent); mind-body balance programs (24.5 percent vs. 23.3 percent); teen programs (23.4 percent vs. 22.7 percent); day camps and summer camps (23 percent vs. 20.3 percent); holidays and other special events (21.8 percent vs. 18.3 percent); environmental education (21.8 percent vs. 20.7 percent); and special needs programs (21.6 percent vs. 18.9 percent).
Respondents from parks were the most likely to report that they had plans to add programs at their facilities over the next few years. Some 37.2 percent of parks respondents said they would be adding programs at their facilities in the next three years. They were followed by Ys (37 percent of whom plan to add programs), rec centers (35.5 percent), health clubs (27.1 percent), colleges (24.7 percent) and camps (21.9 percent). Just 12.2 percent of school respondents said they had plans to add programs at their facilities.
Challenges & Issues of Concern
Finding ways to pay for the programs, services and facilities they offer is generally the top concern for most survey respondents, but other issues also create unique challenges for facility managers.
Equipment and facility maintenance has been the top concern among respondents for a number of years, and continues to hold that place in 2019, though slightly fewer respondents named it a top concern this year than in 2018. In 2019, 55.8 percent of respondents said equipment and facility is a top concern, down from 57.9 percent in 2018. (See Figure 33.)
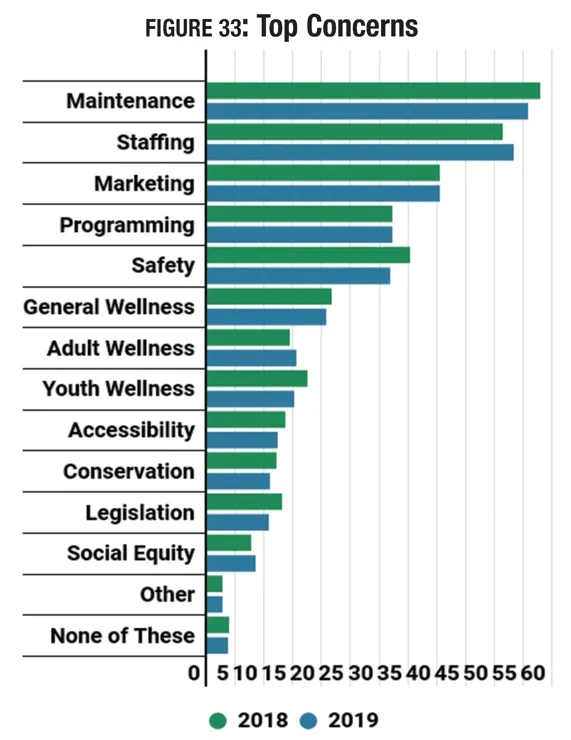
Staffing is the second most common concern, and one of the few areas cited by more respondents as a top concern in 2019. Some 53.2 percent of respondents said staffing is a top issue for them, compared to 51.3 percent in 2018. It was followed by: marketing and increasing participation (40.4 percent named this a top concern); creating new and innovative programming (32.2 percent); and safety and risk management (31.9 percent).
In addition to staffing, there was an increase in the number of respondents who listed the following as top concerns: fitness and wellness for older adults (15.6 percent in 2019 vs. 14.4 percent in 2018); and social equity and access (8.4 percent in 2019 vs. 7.7 percent in 2018).
For the first time in the 2019 Industry Report survey, we asked respondents about various initiatives their facilities and organizations might be involved in, from wellness initiatives to outreach to underserved populations, climate resilience and more. Here are the top initiatives respondents' organizations are involved in:
- Wellness initiatives (56.6 percent)
- Inclusion initiatives for those with physical disabilities (45 percent)
- Outreach to economically disadvantaged populations (42.1 percent)
- Outreach to underserved populations (41.4 percent)
- Inclusion initiatives for those with develop-mental disabilities (40.9 percent)
- Outreach to minority populations (36.2 percent)
- Resource conservation and green initiatives (32.8 percent)
- Initiatives to connect people with nature (32 percent)
- Initiatives to reduce hunger/improve nutrition (18.7 percent)
- Disaster recovery assistance (13.2 percent)