


A Look at Trends in Health, Fitness & Sports Clubs
According to the International Health, Racquet & Sportsclub Association (IHRSA), there were 39,570 health club facilities in the United States in 2018, a 2.8 percent increase over the previous year. More than 71.5 million consumers used those health clubs—a record high since IHRSA began tracking health club utilization in 1987. In 2018, IHRSA reports, U.S. health club industry revenue increased to $32.3 billion, up from $30 billion in 2017.
In this section, we'll take a closer look at trends reported by health club respondents, which includes health clubs, sports clubs, fitness clubs and medical fitness facilities. These respondents made up 3.4 percent of the survey population in 2019.
As with the general survey population, respondents from health clubs were most likely to be from the Midwest. Some 26.1 percent of health club respondents said they were located in the Midwest. They were followed by the South Central region (21.7 percent), the West (21.7 percent) and the Northeast (17.4 percent). Finally, 13 percent of health club respondents were located in the South Atlantic states.
Respondents from health clubs were most likely to be located in suburban communities. More than four in 10 (45.6 percent) said they were located in the suburbs. They were followed by rural areas, with 34.7 percent, and 19.6 percent were located in urban communities.
On average, health club respondents said they serve a population of 72,130 people. Nearly two-thirds (66 percent) of health club respondents said they reach a population of 20,000 or fewer people, compared with 43 percent of non-health-club respondents. Conversely, 19.1 percent of health club respondents reach a population of 100,000 or more, while 20.5 percent of non-health-club respondents reach a population of at least 100,000.
Some 45.8 percent of health club respondents were from private for-profit organizations. Nearly three in 10 (29.2 percent) were with private nonprofit organizations, and 22.9 percent were with public organizations. Another 2.1 percent said they are with "other" types of organizations.
Respondents from health clubs manage an average of 4.7 facilities. They were more likely than non-health-club respondents to report that they manage just a single facility. Some 64.6 percent of health club respondents said they manage just one facility, compared with 31.5 percent of non-health-club respondents. Conversely, while 20.2 percent of non-health-club respondents manage 10 or more facilities, just 6.3 percent of health club respondents said they have 10 or more facilities to manage.
Health club respondents were among the least likely to report that they form partnerships with other organizations, though a majority do so. Some 77.1 percent of health club respondents said they partner with outside organizations (up from 69.2 percent in 2018). This compares with 88.3 percent of non-health-club respondents. The most common partners for health club respondents include: local schools (41.7 percent of health club respondents partner with them); corporations and local businesses (41.7 percent); health care and medical facilities (39.6 percent); nonprofit organizations (29.2 percent); and colleges and universities (29.2 percent).
Respondents from health clubs were far more likely than others to report that their primary audience is made up of adults. Some 57.4 percent of health clubs said this was their primary audience, compared with just 13.5 percent of non-health-club respondents. Another 36.2 percent of health club respondents said they reach all ages, while 4.3 percent primarily serve seniors. The remainder are split between children and infants/toddlers.
Revenues & Expenditures
After a rough year revenue-wise in 2017, health club respondents saw much more positive results in 2018. In 2017, 46.9 percent reported an increase in revenue, while 21.9 percent reported a decrease. In 2018, more than half (51.1 percent) said revenues had increased, while only 6.4 percent reported decreasing revenues. (See Figure 51.)
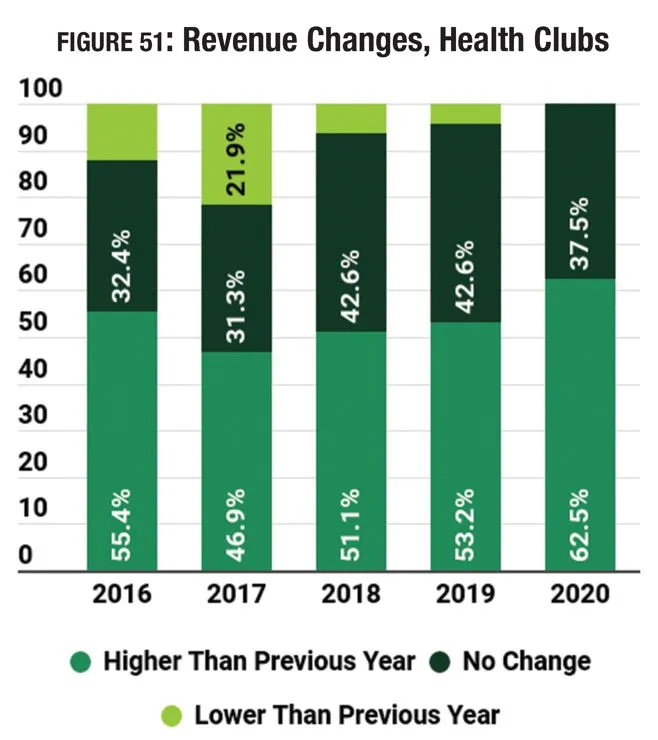
Health club respondents tend to be optimistic when considering future revenues, and they were more so in 2018 than in 2017. Looking forward, 53.2 percent of health club respondents expect revenues to increase in 2019, while 62.5 percent projected an increase for 2020.
From 2017 to 2018, health club respondents reported a 6.3 percent increase in operating costs, from an average of $1,580,000 to $1,680,000. Looking forward, they are expecting further increases, reaching $1,770,000 in 2019 and $2,040,000 in 2020.
On average, health club respondents report that they recover 69.4 percent of their operating costs via revenue, up from 65.1 percent in 2018. Health club respondents were far more likely to report that they recover at least 91 percent of their operating costs via revenues. Some 12.9 percent of non-health-club respondents said they earn back at least 91 percent of their operating costs, while 35.6 percent of health club respondents do so. Some 13.3 percent of health club respondents said they earn less than 30 percent of their operating costs back via revenues. Another 6.7 percent earn between 31 percent and 50 percent of revenues, and 8.9 percent earn back between 51 percent and 70 percent. Nearly half (48.9 percent) of health club respondents said they earn back at least 71 percent of their operating costs via revenues.
Health club respondents were somewhat less likely than their counterparts to report that they had taken action to reduce their operating expenses. Some 78.7 percent of health club respondents said they had taken such measures (down from 86.4 percent in 2018), compared with 80.4 percent of non-health-club respondents. The most common actions taken by health club respondents to reduce expenses include: increasing fees (40.4 percent); improving energy efficiency (38.3 percent); and reducing staff (34 percent). Another 17 percent said they had put construction plans on hold, reduced their hours of operation or cut programs and services.
Health Club Facilities
As with revenues, 2018 was a better year for health club respondents in terms of memberships, or the number of people using their facilities. After falling from 55.3 percent to 48.5 percent from 2016 to 2017, half (50 percent) of health club respondents said the number of people using their facilities had increased in 2018. And while 16.7 percent said usage had fallen in 2017, in 2018, 12.5 percent saw a decrease. (See Figure 52.)
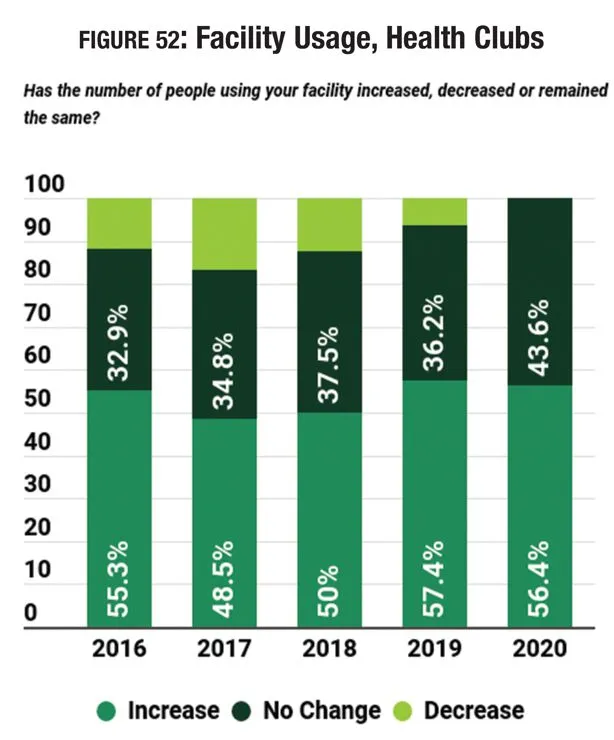
Looking forward, health club respondents are optimistic as always about membership increases. Some 57.4 percent expect to see utilization of their facilities increase in 2019, and 56.4 percent expect an increase in 2020.
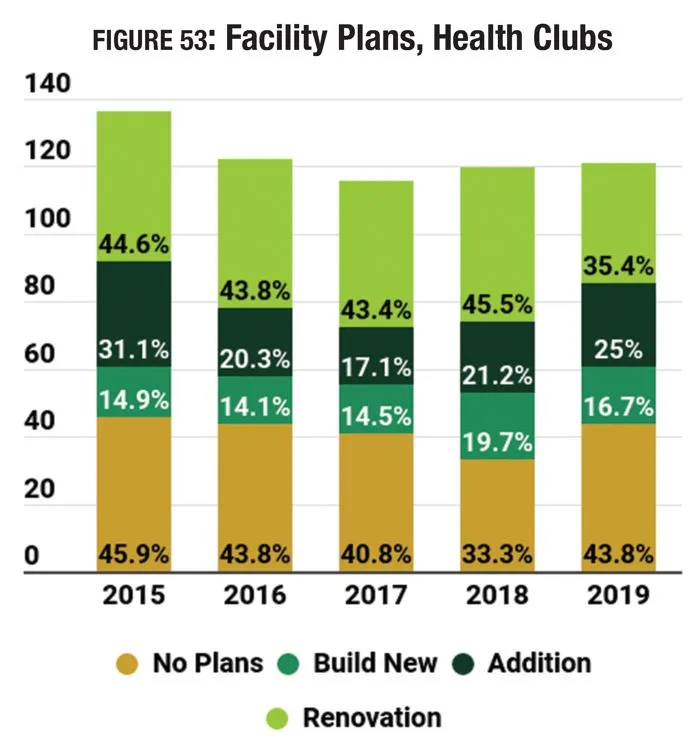
Health clubs were one of the few facility types where fewer respondents in 2019 are planning construction than in 2018. Some 56.2 percent of health club respondents in 2019 said they are planning construction over the next few years, compared with 66.7 percent in 2018. Some 16.7 percent of health club respondents said they are planning new construction, while 25 percent are planning additions, and 35.4 percent are planning renovations. (See Figure 53.)
Health club respondents in 2019 are planning to spend an average of $3,470,000 on their construction plans. This is a 15.3 percent increase from 2017, when these respondents had budgeted $3,010,000 on average for construction.
The features most commonly included among health club respondents' facilities in 2019 include: fitness centers; exercise studio rooms; locker rooms; Wi-Fi services; indoor aquatic facilities; childcare centers; classrooms and meeting rooms; indoor courts for sports like basketball and volleyball; indoor running/walking tracks; and concession areas.
Health club respondents were much less likely than their counterparts to report that they had plans to add features at their facilities over the next three years. While 43.7 percent of non-health-club respondents had such plans, just 20.8 percent of health club respondents are planning to add features. This compares with 30.3 percent in 2018.
The most commonly planned additions among health club respondents include: synthetic turf sports fields; bleachers and seating; exercise studios; locker rooms; and indoor aquatic facilities.
Programming
Offering innovative and effective programs is crucial to the health club business, helping drive new memberships while keeping existing members engaged.
The top 10 programs currently offered among health club respondents' facilities include: fitness programs (provided by 93.8 percent of health club respondents); group exercise programs (83.3 percent); personal training (81.3 percent); mind-body balance programs such as yoga and tai chi (79.2 percent); functional fitness programs (75 percent); programs for active older adults (62.5 percent); holidays and other special events (58.3 percent); nutrition and diet counseling (52.1 percent); aquatic exercise programs (43.8 percent); and swimming programs (39.6 percent).
Programming types that saw growth from 2018 to 2019 include: programs for active older adults (up from 60 percent); and holidays and other special events (up from 43.1 percent). Group exercise and functional fitness programs were new to the survey in 2019.
The percentage of health club respondents who plan to add programs at their facilities fell from 30.3 percent in 2018 to 27.1 percent in 2019. This compares with 31.6 percent of non-health-club respondents who are planning to add programs at their facilities.
The most commonly planned program additions among health club respondents include:
- Holidays and other special events (did not appear in 2018)
- Nutrition and diet counseling (up from No. 3)
- Programs for active older adults (down from No. 1)
- Group exercise programs (did not appear in 2018)
- Fitness programs (down from No. 4)
- Day camps and summer camps (did not appear in 2018)
- Sports tournaments and races (did not appear in 2018)
- Aquatic exercise programs (did not appear in 2018)
- Youth sports teams (did not appear in 2018)
- Personal training (down from No. 7)
New to the list in 2018 are holidays and special events; group exercise; day camps and summer camps; sports tournaments and races; aquatic exercise programs; and youth sports teams. These programs replaced teen programming; mind-body balance programs; sport-specific training; educational programs; adult sports teams; and individual sports activities such as running clubs or swim clubs.