


A Look at Trends in Aquatic Facilities
Aquatic facilities, with all their complex equipment, staffing requirements and budgetary challenges, are a crucial cornerstone of the recreation, sports and fitness industry. From the smallest hotel pool to a large waterpark with all its features and fun, aquatic facilities require special expertise and a whole catalog of specialized equipment. Innovations in the field abound, from manufacturers who create products that make it easier to maintain safe water and run pools consistently and efficiently, to creative operators who invent new programming to draw more swimmers to the water.
In the following pages, we'll examine the results from Industry Report Survey respondents whose facilities include aquatic elements: indoor or outdoor swimming pools, splash play areas, waterparks and hot tubs. For even more research and trends covering aquatic facilities and operations, be sure to check out our Aquatic Trends Report (February 2020), which dives even deeper into aquatics-specific research.
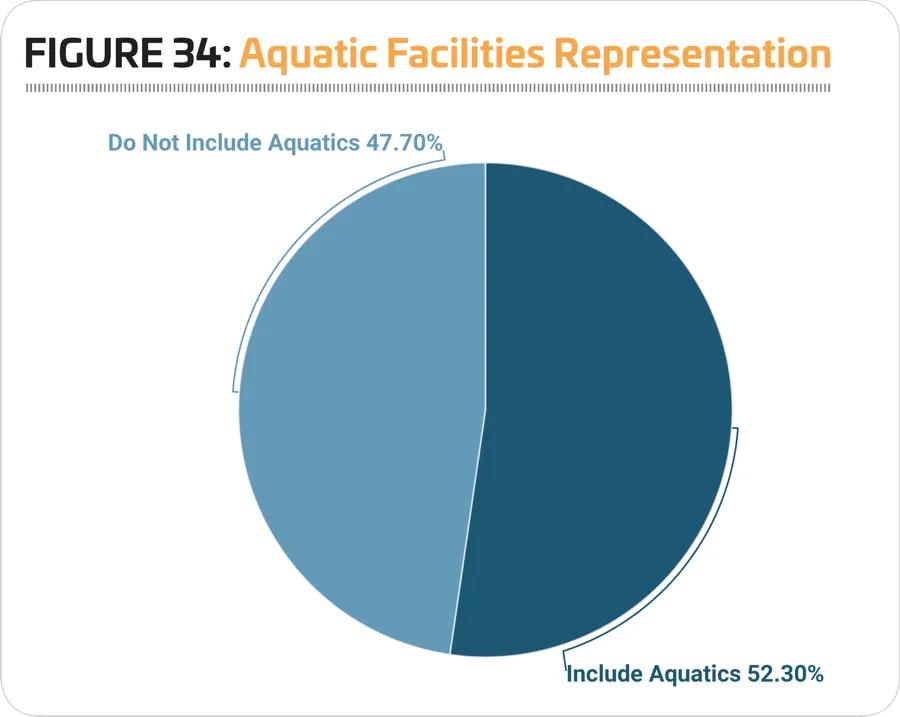
In 2020, 52.3% of respondents to the Industry Report Survey said their facilities include aquatics, down from 56.1% in 2019. (See Figure 34.)
Aquatic Facilities
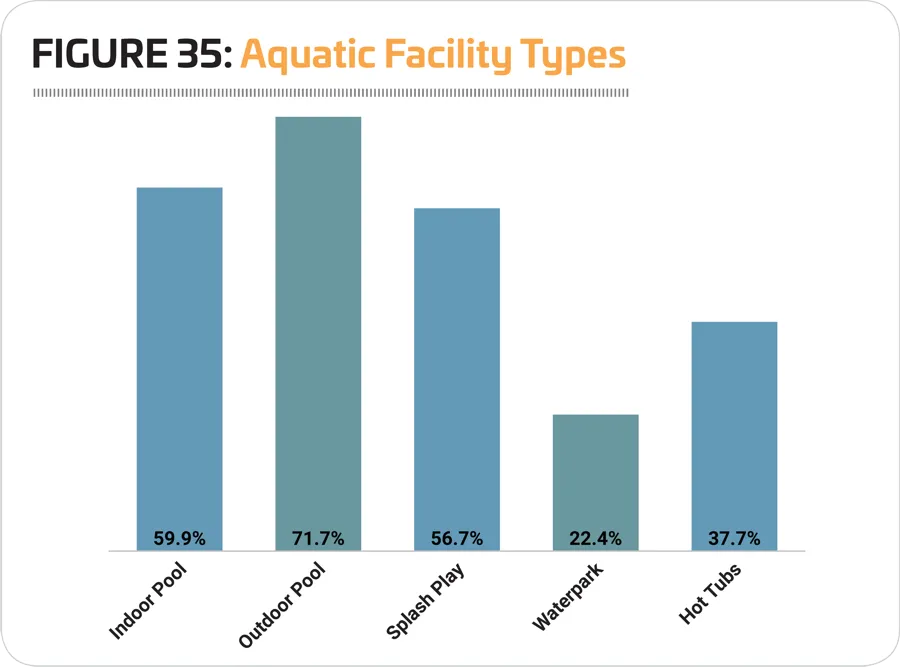
As usual, the most common type of aquatic feature found among aquatic respondents' facilities in 2019 was outdoor swimming pools. More than seven in 10 (71.7%) aquatic respondents said they had at least one outdoor pool, down slightly from 73.1% in 2019. Nearly six in 10 (59.9%) aquatic respondents had at least one indoor pool, up from 58.1%. Splash play areas continue to show growth, with 56.7% of aquatic respondents indicating they have one, up from 54.2% in 2019 and 49.7% in 2018. Well over a third (37.7%) of aquatic respondents said they have hot tubs, spas or whirlpools (up from 33.3%0, while 22.4% said they have waterparks (up slightly, from 21.9%). (See Figure 35.)
Outdoor swimming pools were most commonly found among aquatic facilities in the South Central and Western regions. Some 78% of South Central respondents and 76.1% of Western respondents said they currently have outdoor pools. Aquatic respondents from the Northeast were the least likely to include outdoor pools, though a majority (61.2%) said they have at least one outdoor pool.
Indoor swimming pools were most commonly found in the Northeast and South Central regions, with 66.4% of Northeastern respondents and 64.5% of South Central respondents reporting that they include indoor pools. Indoor pools were least common in the South Atlantic region, though 53.6% of aquatic respondents there said they have at least one indoor pool.
Splash play areas were most commonly found in the South Central and South Atlantic regions. Some 75.7% of South Central region respondents and 61.4% of South Atlantic respondents said they include splash play among their facilities. Splash play continued to be least common in the Northeast, though the percentage of aquatic respondents there with splash play areas grew from 39.5% in 2019 to 47.4% in 2020.
Waterparks were most common among facilities in the Midwest and in the South Central region. Some 33.1% of respondents in the Midwest and 24.2% in the South Central region said they currently include waterparks. They were least common in 2020 in the South Atlantic region, where 9.5% said they currently have waterparks.
Hot tubs, spas and whirlpools were most common among respondents from the West; some 46.3% of Western aquatic respondents said they currently include hot tubs. They were followed by the South Atlantic, where 38.7% feature hot tubs. The South Central region was least likely to be home to hot tubs, with 27.7% of aquatic respondents there indicating that they have at least one.
Some types of aquatic operations are more likely to be found in some industry segments vs. others. For example, splash play areas are more typically found among park operations than in health clubs, while hot tubs are far more common in health clubs than at camps.
Outdoor swimming pools were most commonly found at camp respondents' facilities. Some 93.9% of aquatic respondents from camps said they have at least one outdoor pool. They were followed by parks (80.5%) and recreation centers (68.4%).
Indoor swimming pools were most common at health clubs, where 100% of aquatic respondents said they currently have at least one indoor pool. They were followed by colleges and universities (96.8%) and Ys (91.4%).
Aquatic respondents from parks were the most likely to report that they currently have at least one splash play area. Some 70.8% of aquatic respondents from parks said they have a splash play area. They were followed by Ys (49.1% of which have splash play) and rec centers (48.5%).
Waterparks are much less common for most facility types, but some 28.4% of aquatic respondents from parks said they currently include a waterpark, and 28% of those from Ys said they have a waterpark.
"We are a community outdoor aquatics facility operated by a nonprofit organization, and are using revenues from memberships and PPP program to open to the fullest extent allowable during the 2020 season." (Aquatic Facility)
Hot tubs, spas and whirlpools were most commonly found in the facilities of aquatic respondents from health clubs. In fact, 100% of health club respondents with aquatic elements at their facilities said they have a hot tub. They were followed by respondents from Ys (76.7%).
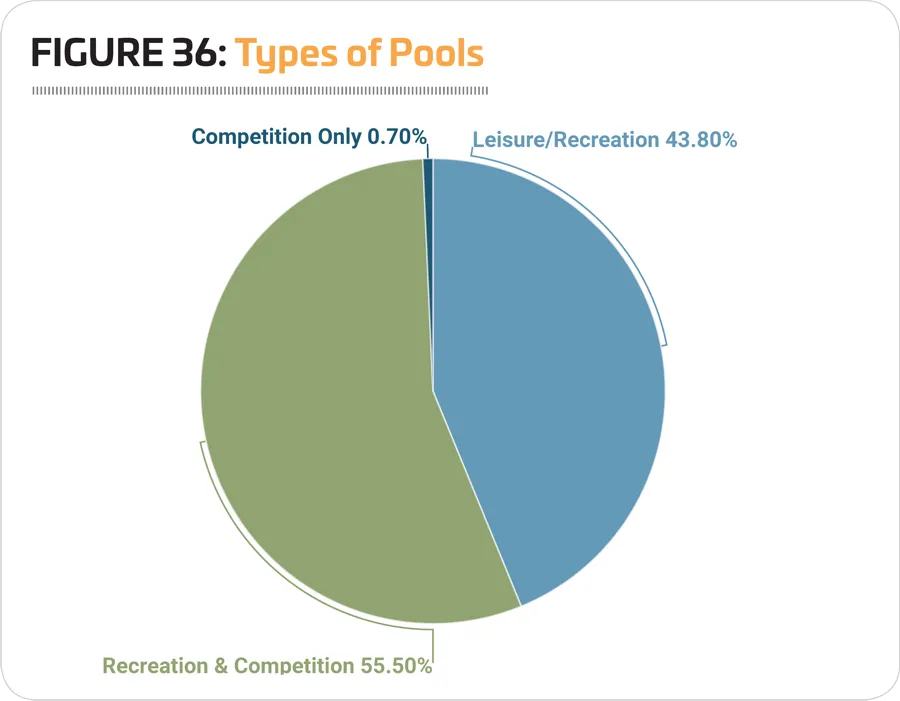
As usual, the vast majority of aquatic facilities covered in the report are used either for leisure and recreation, or for a combination of recreational and competitive activities. Just 0.7% of aquatic respondents said their pools are used for competition only. More than half (55.5%) said their aquatic facilities host both recreational and competitive activities, and 44.8% said their pools are used only for recreation. (See Figure 36.)
As is usually the case, pools used only for leisure and recreation are most commonly found among camp facilities. Some 94.6% of camp respondents with aquatics said their pools are used only for recreation. They were followed by health clubs (73.3%) and colleges (48.5%).
Combined-used pools that offer both recreational and competitive programming are most commonly found among schools, where 75% of aquatic respondents said their pools are used for both purposes. They were followed by Ys (71.8%) and rec centers (59.5%).
Competition-only pools are rare. In 2020, just 7.1% of aquatic respondents from schools and 1.5% of those from colleges, plus a single park respondent said their pools are used for competition only.
Pools & Budgets
Aquatic respondents report much higher overall operating expenses than non-aquatic respondents. However, from 2018 to 2019, non-aquatic respondents' overall operating expenditures increased at a greater clip. From 2018 to 2019, aquatic respondents saw their overall operating expense grow 10.7%, from an average of $2,420,000 to $2,680,000. For non-aquatic respondents, expenses increased by more than half, with a 51.4% increase from $1,070,000 in 2018 to an average of $1,620,000 in 2019.
Looking forward, however, aquatic respondents were expecting to see their operating expenditures increase faster than non-aquatic respondents. From 2019 to 2021, non-aquatic respondents projected that their operating expenses would grow 4.3%, from $1,620,000 to $1,690,000. Aquatic respondents, on the other hand, projected a 6.7% increase to operating expenses, from $2,680,000 in 2019 to $2,860,000 in 2021.
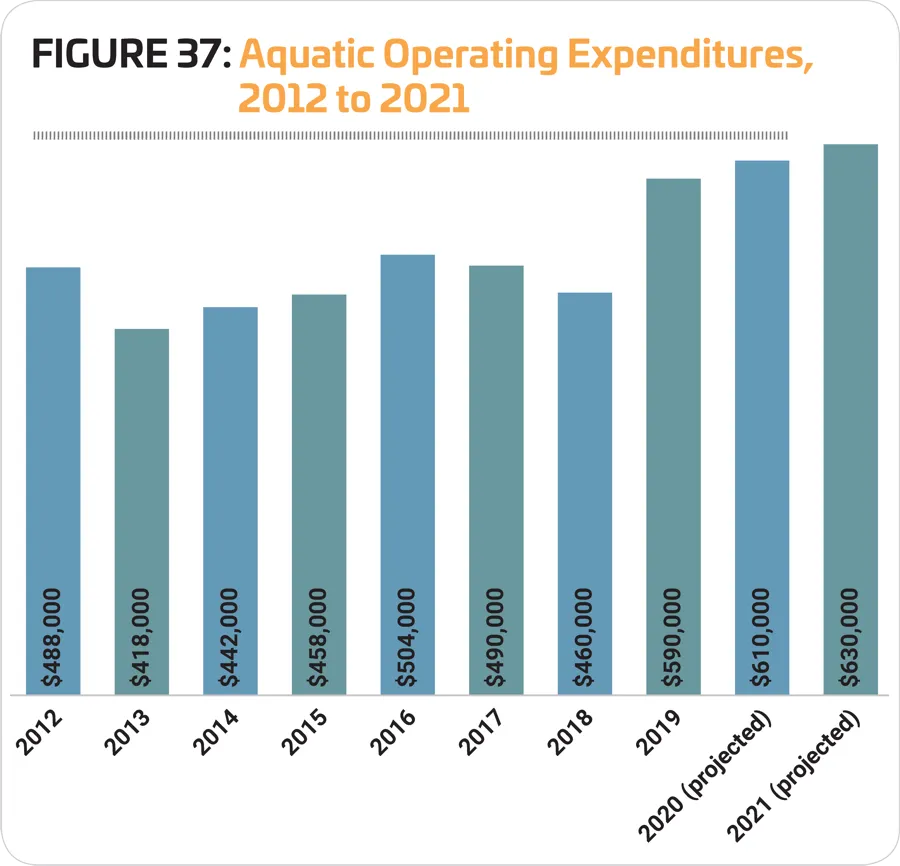
While aquatic respondents reported a 10.7% increase in their overall operating budget from 2018 to 2019, their operating budget for aquatics only grew faster. Aquatic operating budgets increased 28.3% in that time frame, from an average of $460,000 in 2018 to $590,000 in 2019. Looking forward, aquatic respondents were expecting aquatic operating expenses to increase a further 6.8% by 2021, reaching an average of $630,000. (See Figure 37.)
Respondents from Ys reported the highest average aquatic operating expense for 2019, at $740,000. They were followed by parks ($670,000) and rec centers ($630,000). Respondents from health clubs had the lowest average aquatic operating expense in 2019, at $210,000.
From 2019 to 2021, respondents from schools were expecting the greatest growth in their aquatic operating expenses. School respondents with aquatics reported that they expected their average operating cost for aquatics to grow by 40%, from an average of $350,000 in 2019 to $490,000 in 2021. Others who were expecting aquatic operating costs to grow by at least 10% from 2019 to 2021 include camps (up 17.1%, from $350,000 to $410,000) and Ys (up 14.9%, from $740,000 to $850,000). More modest increases were expected among other facility types, with colleges projecting a 6.9% increase from $290,000 in 2019 to $310,000 in 2021; parks expecting a 6% increase from $670,000 to $710,000; and rec centers projecting a 3.2% increase from $630,000 to $650,000. Health club respondents with aquatics reported that they expect no change to their average aquatic operating cost from 2019 to 2021.
One-third (33.3%) of aquatic respondents said their aquatic revenues increased from 2018 to 2019, up from 31.5% who reported an increase in 2018 and 27.1% who saw an increase in 2017. At the same time, the percentage of aquatic respondents who saw their revenues decrease fell slightly, from 11.6% reporting a decrease in 2018 to 10.3% who saw a decrease in 2019.
"As an aquatics manager, I am having to plan to retrain staff on new protocols, adjust potential schedules, cancel programs, issue refunds and purchase new equipment to find ways to continue to train staff without contact." (Parks & Recreation)
Looking forward, a slightly growing number of aquatic respondents were expecting their aquatic revenues to increase further in 2020 (34.4% were expecting an increase) and in 2021 (35.1%), while a declining number expected their revenues to drop in 2020 (5.6%) and 2021 (4.1%). These numbers, of course, will be very different when we take the next Industry Report Survey in early 2021.
From 2018 to 2019, aquatic respondents from health clubs were the most likely to report that their aquatic revenues had increased. Some 46.7% of health club respondents with aquatics said aquatic revenues were up in 2019. They were followed by those from rec centers (with 38.5% reporting an increase) and parks (with 35.2% reporting an increase).
Aquatic respondents from Ys were the most likely to report that their revenues had decreased from 2018 to 2019, with 13.2% reporting that aquatic revenues had fallen in that time. They were followed by schools and parks—11.5% of each reported a decrease in aquatic revenues from 2018 to 2019.
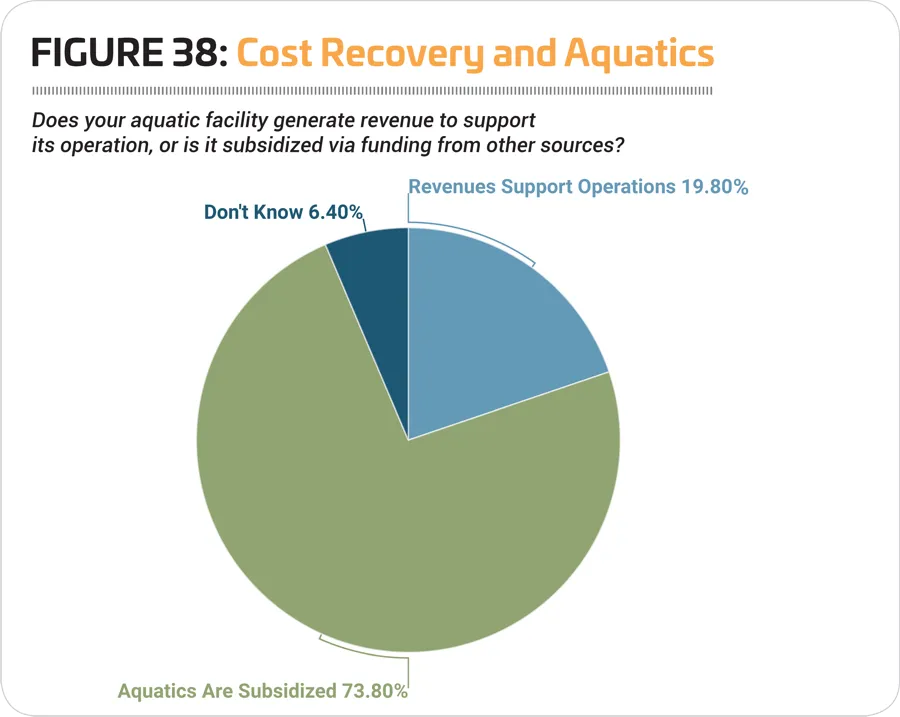
The number of aquatic respondents who report that their aquatic revenues support their aquatic operations fell slightly in 2020. Some 19.8% of aquatic respondents said their aquatic facilities generate the revenues to support their operations, down from 21.7% in 2019. Another 73.8% said their aquatic facilities are subsidized via funding from other sources. (See Figure 38.)
As was the case in 2019, respondents from health clubs were the most likely to report that they earn their aquatic operating costs back via aquatic revenues. Some 26.7% of health club respondents with aquatics said they cover their aquatic operating costs with revenues. They were followed by Ys, where 23.6% said their aquatic costs are covered by revenues.
Respondents from camps were the most likely to indicate that they subsidize their aquatic operations with funding from other sources. Some 86.5% of camp respondents said their aquatic operations are subsidized. They were followed by parks (76.5%) and colleges (75.4%).
Programming
The majority of aquatic respondents reported that they currently provide programming at their aquatic facilities—everything from swim lessons to lap swimming, lifeguard training and beyond. Some 94.1% of aquatic respondents said they offer aquatic programming. This includes 100% of aquatic respondents from colleges, schools, health clubs and rec centers. Nearly all respondents from Ys (98.6%) said they offer aquatic programming. Slightly fewer parks (92%) and camps (88.9%) said there was aquatic programming at their facilities.
The top 10 most common aquatic programs offered at aquatic facilities in 2020 include:
- Leisure swim (85.1% of aquatic facilities host leisure swim)
- Learn-to-swim for children (81.9%)
- Lap swim (75.9%)
- Lifeguard training (74.5%)
- Aquatic exercise programs (68.4%)
- Learn-to-swim for adults (62.2%)
- Youth swim teams (61%)
- Water safety programs (58.5%)
- Swim meets and competitions (52.3%)
- Special needs aquatic programs (34.6%)
Areas that saw growth from 2019 to 2020 include: youth swim teams (up 6.5 points, from 54.5%); aquatic exercise programs (up 3.9 points, from 64.5%); swim meets and competitions (up 2.8 points, from 49.5%); lap swimming (up 2 points, from 73.9%); learn-to-swim for children (up 1.9 points, from 80%); special needs aquatic programs (up 1, from 33.6%); and lifeguard training (up 0.3 points, from 74.2%).
Aquatic respondents from Ys were more likely than others to provide: learn-to-swim for children; learn-to-swim for adults; youth swim teams, lap swimming, water safety programs; and lifeguard training.
Aquatic respondents from schools and school districts were more likely than others to provide: adult swim teams; school or collegiate swim teams; special needs aquatic programs; swim meets and competitions; and diving and diving teams.
Aquatic respondents from health clubs were more likely than others to provide: aquatic exercise programs; leisure swim; and aqua-therapy programs.
Finally, aquatic respondents from colleges were more likely than others to provide water polo programs.
The percentage of aquatic respondents who said they were planning to add additional aquatic programs at their facilities over the next few years was up slightly in 2020. Some 23% of aquatic respondents said they had such plans, up from 19.8% in 2019.
Aquatic respondents from Ys were the most likely to be planning to add aquatic programs at their facilities. More than three in 10 (31.9%) Y respondents said they had such plans. They were followed by rec centers (27.9%) and parks (24.5%). Fewer respondents from schools (17.2%), colleges (16.7%), health clubs (13.3%) and camps (7.9%) said they had plans to add aquatic programs.
The 10 most commonly planned aquatic program additions include:
- Special needs aquatic programs (planned by 28.7% of those who will be adding programs)
- Learn-to-swim for adults (22.9%)
- Aquatic exercise programs (19.7%)
- Aqua-therapy programs (19.7%)
- Adult swim teams (14%)
- Learn-to-swim for children (13.4%)
- Water safety programs (13.4%)
- Water polo (12.1%)
- Lifeguard training (12.1%)
- Youth swim teams (10.2%)
In a departure from the norm, aquatic respondents from rec centers were the most likely to be planning to add most types of programs, including: learn-to-swim for children; youth swim teams; aquatic exercise programs; leisure swim; aqua-therapy programs; swim meets and competitions; water safety programs; diving and diving teams; and lifeguard training.
Aquatic respondents from schools were more likely than others to be planning to add learn-to-swim for adults or water polo programs.
Aquatic respondents from Ys were more likely than others to be planning to add adult swim teams and special needs aquatic programs.
Aquatic respondents from health clubs were more likely than others to be planning to add school or collegiate swim teams, while those from camps were the most likely to be planning to add lap swimming.
"As an aquatic facility we are struggling to find the compromise between safety and the need for people to recreate. Safety for staff members had also been a top priority." (Parks & Recreation)
Facility Enhancements
When the Industry Report Survey was taken in January, aquatic respondents, like all respondents, were more likely to be planning construction than in past years. In fact, more than three-quarters (76.2%) of aquatic respondents said they were planning construction (up from 72.3% in 2019). This compares with 69.3% of non-aquatic respondents to the 2020 survey who said they were planning construction.
Splash Play Continues Its Growth
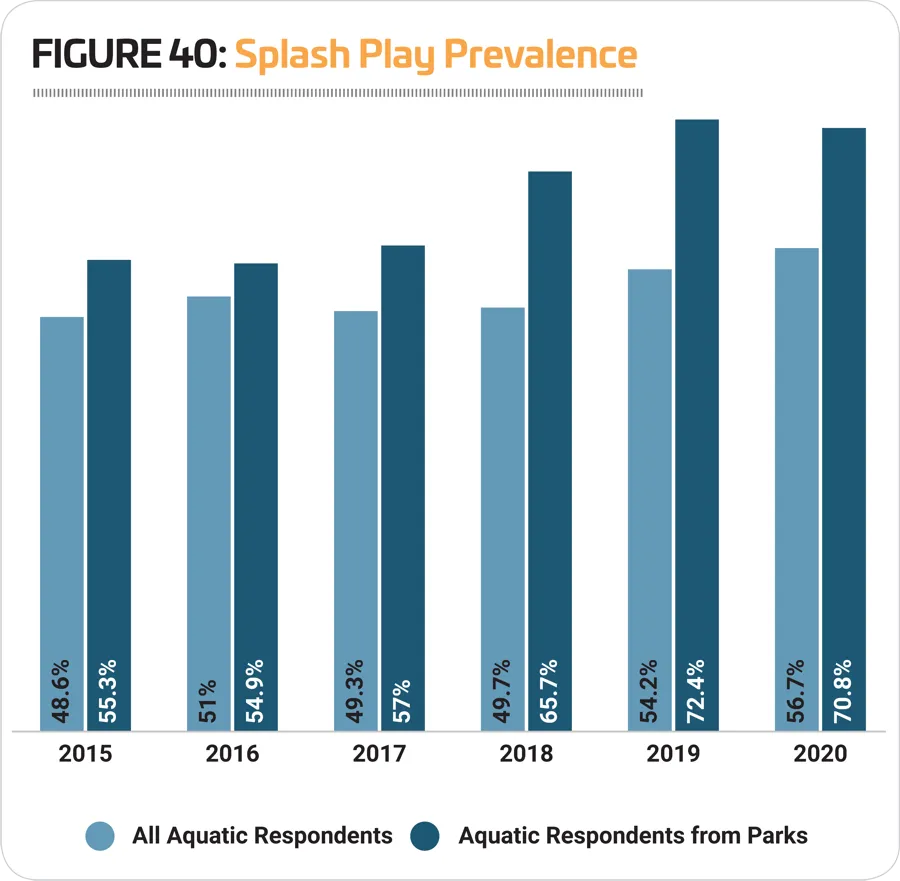
Splash play areas have seen a great deal of growth over the past decade. Just since 2015, the percentage of aquatic respondents whose facilities include splash play areas has grown from 48.6% to 56.7%.
This growth has been dominated by respondents from parks. In 2015, 55.3% of aquatic respondents from parks said they included at least one splash play area among their facilities. In 2020, 70.8% said they have at least one splash play area. (See Figure 40.)
Aquatic respondents were more likely than those without aquatics to indicate that they have plans for renovations to their existing facilities or new construction, while those without aquatics were more likely to be planning additions. Some 61.8% of aquatic respondents said they would be making renovations to existing facilities, compared with 52.3% of those without aquatics. Nearly a third (32%) of aquatic respondents said they were planning new construction, compared with 30.2% of those without aquatics. And finally, 32.7% of aquatic respondents were planning additions, compared with 36.6% of those without aquatics.
Aquatic respondents' average planned budget for construction grew by 13.6% from 2019 to 2020, from $5,730,000 to $6,510,000. This compares with an 8.8% increase reported by respondents without aquatics (from $4,200,000 to $4,570,000).
The top 10 features covered by the survey that are most commonly found among aquatic respondents' facilities include:
- Automatic chemical feeders (found among 75.2% of aquatic respondents' facilities, up from 72% in 2019)
- Pool lifts and accessibility equipment (71.8%, no change)
- Zero-depth entry (45.5%, up from 41.8%)
- Diving boards (43.8%, down from 46.6%)
- Waterslides (40.6%, down from 41.6%)
- Water play structures (39.2%, up from 37.6%)
- Splash pads (32.2%, up from 29.5%)
- UV disinfection systems (27.2%, up from 22.4%)
- Variable speed pumps (21.4%, up from 18%)
- Variable frequency drives (18.7%, up from 15.1%)
Aquatic respondents from park facilities were more likely than others to include: lazy rivers, waterslides, water play structures, poolside cabanas, and splash pads.
Aquatic respondents from schools were more likely than others to have diving boards, ozone systems, variable speed pumps, and variable frequency drives.
Those from health clubs were more likely than others to have automatic chemical feeders and saline chlorination systems.
Aquatic respondents from rec centers were most likely to have zero-depth entry. Those from Ys were most likely to have pool lifts and accessibility equipment. College respondents were most likely to have UV disinfection systems, and those from camps were most likely to have solar pool heating.
More than one-quarter (26.8%) of aquatic respondents said they had plans to add features to their aquatic facilities over the next few years, up from 23.5% in 2019. Aquatic respondents from camps and rec centers were the most likely to be planning such additions. Some 44.7% of camp respondents and 34.9% of rec center respondents said they would be adding features. They were followed by parks (27.6%) and Ys (26.4%). Fewer respondents from colleges (15.2%), health clubs (6.7%) and schools were planning to add any of these features at their facilities.
The most commonly planned addition in 2020 was splash pads. One-third (33.3%) of aquatic respondents with plans to add features said they would be adding splash pads, up from 25.3% in 2019. More than one-quarter (26.8%) were planning to add UV disinfection, up from 21.5% in 2019. (See Figure 39.)
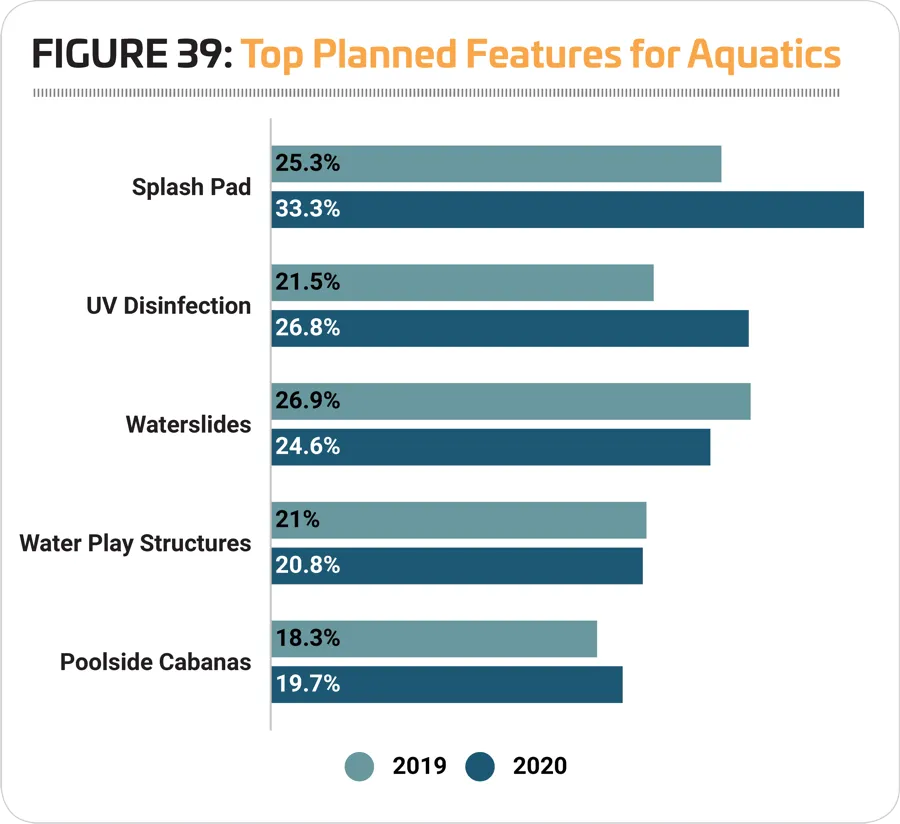
More respondents in 2020 than in 2019 were also planning to add: poolside cabanas (19.7% vs. 18.3%), and automatic chemical feeders (12% vs. 9.7%).
Aquatic respondents from Ys were the most likely to be planning to add: zero-depth entry, UV disinfection systems, waterslides, water play structures, diving boards, and ozone systems.
Aquatic respondents from camps were the most likely to be planning to add: automatic chemical feeders, solar pool heating, saline chlorination systems, pool lifts and accessibility equipment, wave pools, and variable speed pumps.
Aquatic respondents from parks were the most likely to be planning to add poolside cabanas, splash pads, and surf machines.
Finally, aquatic respondents from rec centers were the most likely to be planning to add lazy rivers and variable frequency drives. RM