


A Look at Trends in Parks & Recreation

In this section, we take a look at the latest trends among respondents from parks agencies. The largest cohort covered in the survey, these respondents made up 42.7% of the survey population, down from 47.1% in 2020.
Park respondents were most likely to be located in the Midwest or the West. Some 28.9% of park respondents were from the Midwest, while 25.2% were from the West. Just over one-fifth (20.6%) were from the South Atlantic region, and smaller numbers were from the Northeast (15.7%) and the South Central states (9.6%).
Park respondents were most likely to be from suburban communities, with 45.3% indicating they call the suburbs home. Another third (33.3%) were from rural communities, and just over a fifth (21.5%) were from urban areas.
Park respondents were more likely to serve larger populations of people than most other respondents. On average, park respondents said they reach an average population of 127,000 people, down from 142,000 in 2020.
Park respondents were more likely than non-park respondents to report that they reach an audience of 100,000 or more, while they were far less likely to serve an audience of 20,000 or fewer. Some 26.9% of park respondents said they serve a population of at least 100,000 people, compared with just 16.4% of non-park respondents. On the other hand, while 33.6% of park respondents said they reach 20,000 or fewer, 59.7% of non-park respondents reach an audience of 20,000 or fewer.
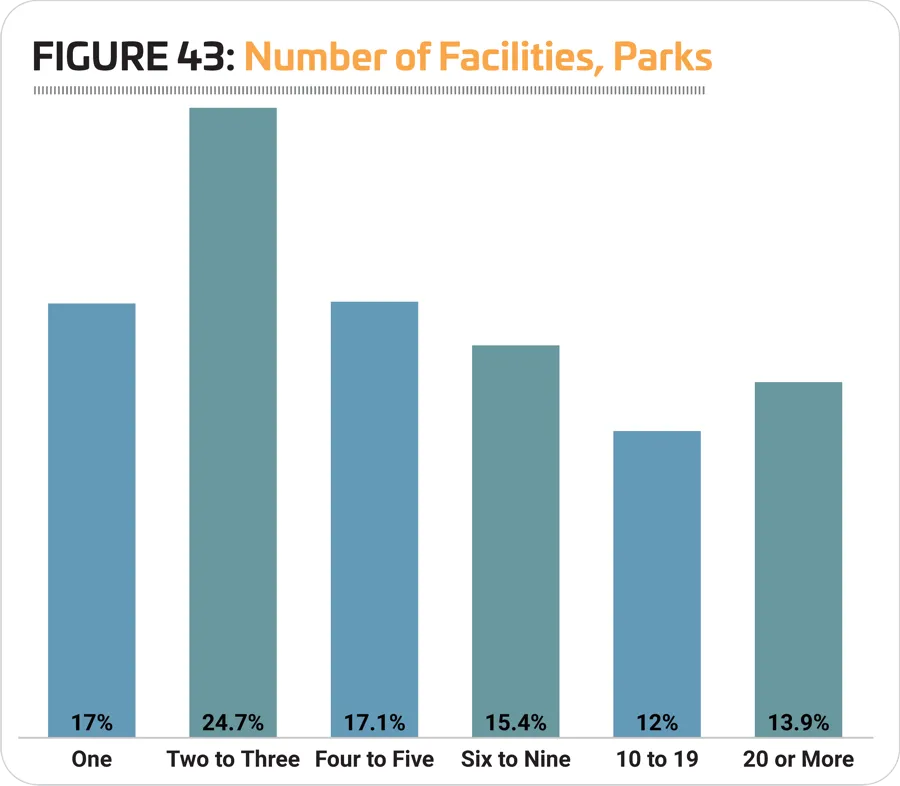
On average, park respondents said they manage 11.1 facilities, down slightly from 12 in 2020. More than a quarter (25.9%) of park respondents said they manage 10 or more facilities, down from 30.5% in 2020. This compares with just 8.1% of non-park respondents. Conversely, while just 17% of park respondents said they manage only a single facility, nearly half (47.9%) of non-park respondents said they have just one facility to manage. Nearly six out of 10 (58.8%) park respondents said they manage between one and five facilities. (See Figure 43.)
Park respondents were much more likely than non-park respondents to report that they reach either an all-ages audience, or children from 4 to 12 years old. While 53.6% of park respondents said they primarily reach all ages, just 30.8% of non-park respondents said this was their primary audience. And while 27.2% of park respondents said they primarily reach children ages 4 to 12, just 12.6% of non-park respondents do so. Other audiences served by park respondents include: adults 19 and up (12.2% of park respondents said they primarily reach adults); teens (4.1%); seniors 65 and older (2.7%); and infants and toddlers (0.2%).
On average, park respondents report that they recover 43.3% of their operating costs via revenues, representing virtually no change from 2020, when they recovered an average of 43.8% of their operating costs via revenue. This number fluctuates over time, and reached a high of 45.1% in 2016.
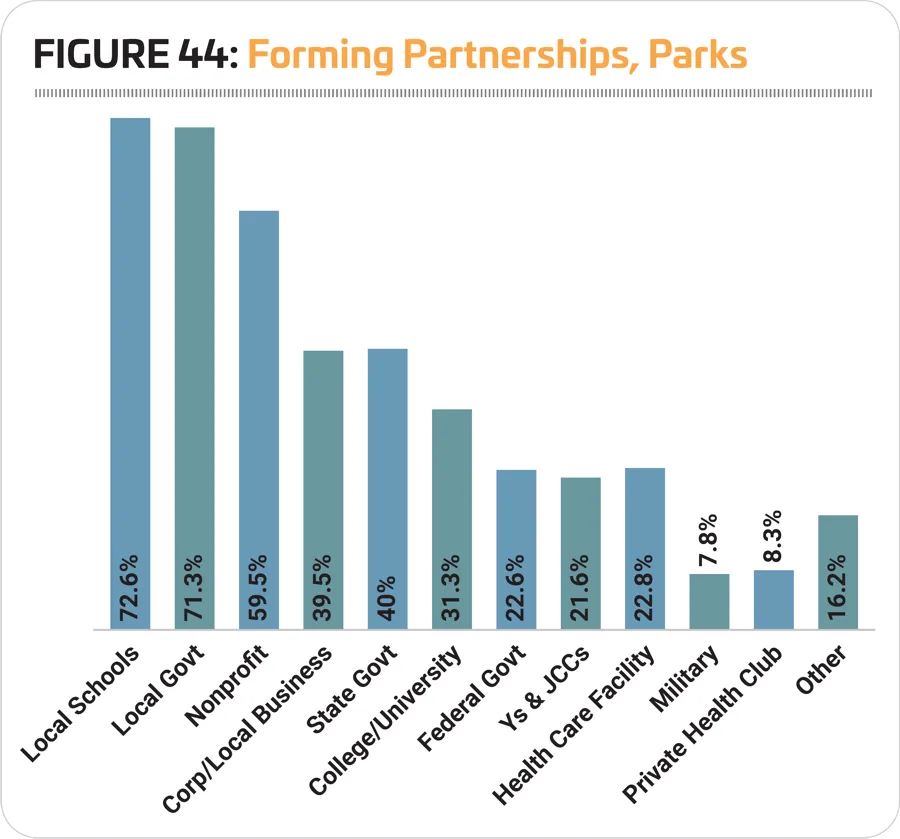
A majority of park respondents (94.7%) said that they form partnerships with outside organizations, representing virtually no change from 2020, when 94.9% formed such partnerships. This compares with just 82.9% of non-park respondents who said they partner with other organizations. More than seven in 10 park respondents said they partner with local schools (72.6%) and local government (71.3%). Other more common partners for parks include: nonprofit organizations (59.5%); state government (40%); and corporate or local businesses (39.5%). (See Figure 44.)
Revenues & Expenditures
Obviously, the COVID-19 pandemic had a dramatic impact on revenues for almost everyone. Parks are no exception, with nearly two-thirds (65.5%) reporting that their revenues in 2020 had fallen. Another 19.5% said there had been no change to revenues, and just 15% reported an increase. (See Figure 45.)
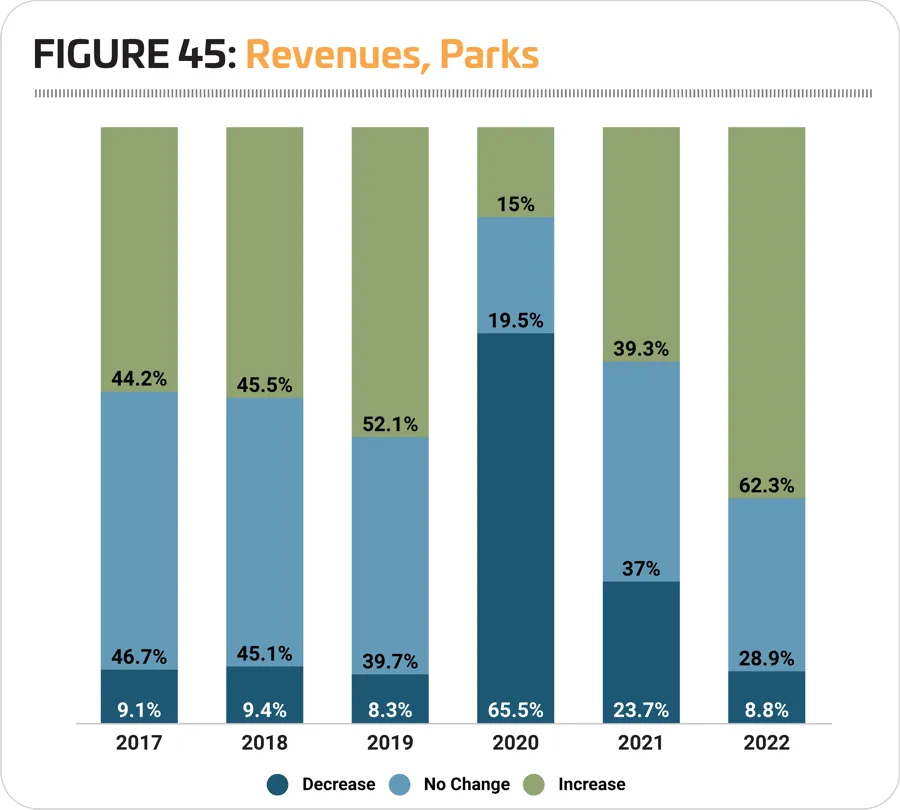
In 2021, park respondents were much more likely to expect revenues to be on the rise. Some 39.3% said they expect revenues to be up this year, while 37% expect no change, and 23.7% still expect revenues to fall. Looking forward, 2022 shows dramatic improvement in expectations, with a full 62.3% of park respondents expecting increasing revenues, 28.9% expecting no change, and just 8.8% expecting a decrease—much more in line with the typical experience around revenues in pre-pandemic years, though with an obvious and expected boost in those who believe revenues will be on the rise.
Park respondents reported a 19.5% decrease to their average operating expenditure from 2019 to 2020. In 2019, park respondents spent an average of $2,310,000 on their operations, while in 2020 they spent $1,860,000. Looking forward, these respondents projected no change in 2021, but in 2022 they are expecting their operating costs to rise 4.8%, to an average of $1,950,000.
On average, park respondents report that they recover 43.3% of their operating costs via revenues, representing virtually no change from 2020, when they recovered an average of 43.8% of their operating costs via revenue. This number fluctuates over time, and reached a high of 45.1% in 2016. Well over a third (35.8%) of park respondents said that their revenues cover 30% or less of their operating costs (compared with 22.7% of non-park respondents). Another 18.8% recover 31% to 50%, and 18.2% recover 51% to 70% of their operating costs via revenues. Less than one-fifth (17.1%) of park respondents said they recover 71% or more of their operating costs via revenues. This compares with 40.6% of non-park respondents.
Park respondents were slightly more likely than non-park respondents to report that they had taken action to reduce their operating expenses. Some 91.2% of park respondents said they had done so, up from 80.6% in 2020. This compares with 89.3% of non-park respondents (up from 81.8%). The most common actions park respondents had taken to try to reduce their operating costs included: cutting programs and services (59.7%, compared with 52.6% of non-park respondents); temporarily closing facilities (56.9% vs. 43.9%); reducing staff (55.9% vs. 57%); reducing hours of operation (52.9% vs. 52.6%); and improving energy efficiency (36.7% vs. 34.9%).
Take It Outside
Providing an outlet in the great outdoors for people to exercise or socialize has long been the provenance of our local and regional parks, and the pandemic seemingly only boosted people's use of these spaces.
The Outdoor Industry Association recently delivered its own insights about how Americans had increasingly turned to the outdoor activities, focusing on demographics of those who participated in outdoor activities for the first time during the pandemic or after a significant lapse. These participants were more likely to be female, younger, living in urban areas and slightly more ethnically diverse. They primarily looked for socially distanced outdoor activities that allowed them to safely gather with loved ones, to exercise and stay healthy, or to reduce screen-time fatigue. They were most motivated by activities close to home and with low barriers to entry, such as walking, running and biking.
"Initial findings of the special new participant report show strong overall increases in outdoor recreation by a slightly more demographically and socioeconomically diverse participant base. This highlights the need to ensure equitable access to the outdoors for all. We can do this by helping to create programming, policy and content around close-to-home recreation and geared toward this broader, more diverse audience of new outdoor participants," said Stephanie Maez, managing director at the Outdoor Foundation.
With so many more people turning to parks and trails over the past year, it's no surprise that park respondents were most likely to be planning to add more outdoor outlets for activities, with outdoor fitness areas and fitness trails topping the list of planned additions, and with splash play, walking and hiking trails, dog parks and playgrounds rounding out the top five.
Park Facilities
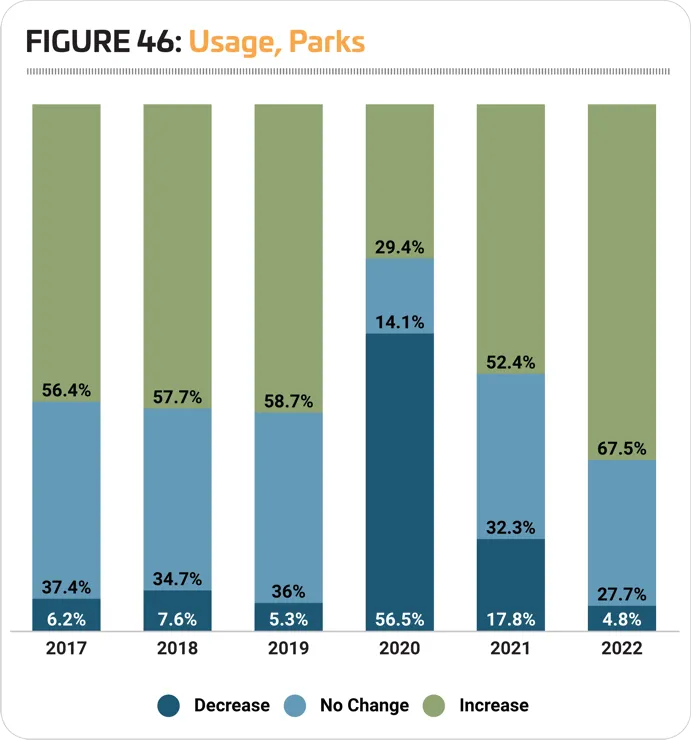
Although more than half of park respondents reported that the number of people using their facilities fell in 2020, they were less likely to report such a decrease than non-park respondents. In addition, they were nearly twice as likely to report an increase in the number of people using their facilities. Some 56.5% of park respondents reported a decrease in usage in 2020, compared with 63.5% of non-park respondents. Another 29.4% of park respondents actually reported an increase in usage, compared with just 15.5% of non-park respondents.
Looking forward, park respondents expect usage of their facilities to begin picking up again in 2021, before taking off in 2022. In 2021, more than half (52.4%) of park respondents said they expect usage of their facilities to increase, while 32.3% expect no change and 17.8% expect a decrease. And in 2022, more than two-thirds (67.5%) of park respondents are expecting an increase, while 27.7% expect no change and just 4.8% expect a decrease. (See Figure 46.)
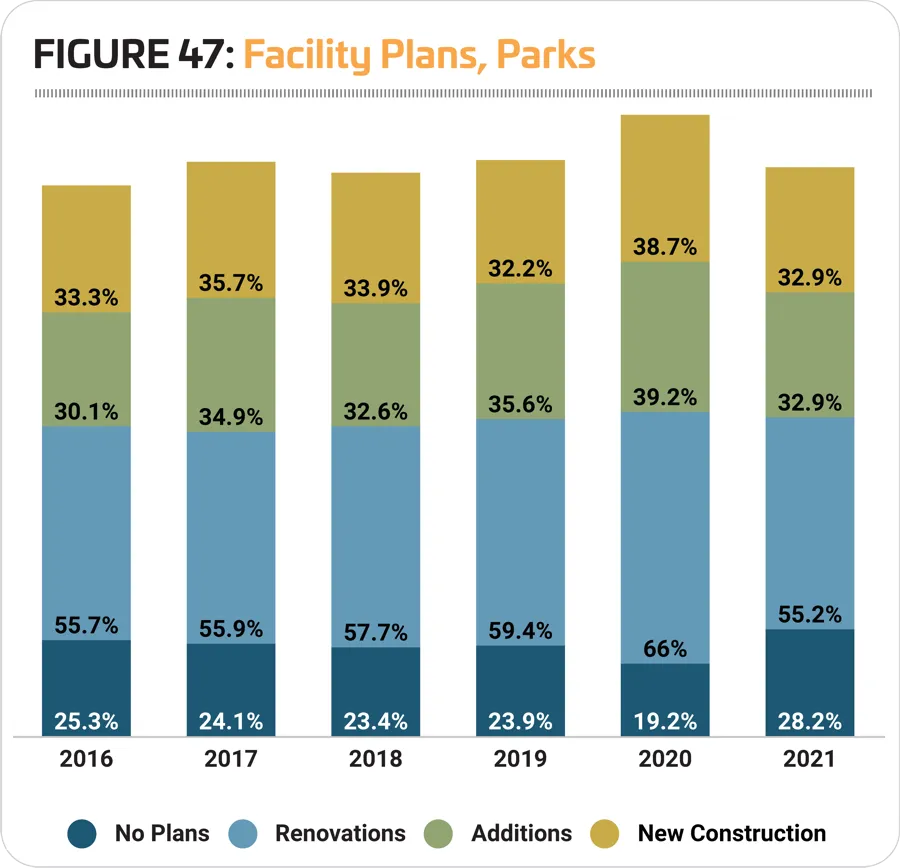
While the number of park respondents who reported plans for construction fell in 2021, they were still far more likely than non-park respondents to indicate that they had such plans. Some 71.8% of park respondents said they were planning construction, down from 80.8% in early 2020. This compares with just 59.7% of non-park respondents who said they have construction plans in 2021. Park respondents were most likely to be planning renovations at their facilities (55.2%), while 32.9% were planning new construction, and 32.9% were planning to make additions to their existing facilities. (See Figure 47.)
Like most respondents, parks reported a decrease to their construction budgets from 2020 to 2021. Park respondents in 2021 were planning to spend $5,160,000 on their construction, down 7.4% from $5,570,000 in 2020. That said, the average construction budget for 2021 is still 0.6% higher than the average for 2019 ($5,130,000).
Looking forward, park respondents expect usage of their facilities to begin picking up again in 2021, before taking off in 2022. In 2021, more than half (52.4%) of park respondents said they expect usage of their facilities to increase, while 32.3% expect no change and 17.8% expect a decrease. And in 2022, more than two-thirds (67.5%) of park respondents are expecting an increase, while 27.7% expect no change and just 4.8% expect a decrease.
Once again there is little to no change in the features most commonly found among park respondents' facilities in 2020, with the 10 most common features trading some places but not changing, overall. The 10 most common features found among park respondents' facilities include: playgrounds; park shelters such as gazebos and picnic shelters; park restroom structures; walking and hiking trails; open spaces such as gardens and natural areas; outdoor sports courts for sports like basketball or tennis; bleachers and seating; natural turf sports fields; classrooms and meeting rooms; and concession areas.
As with construction plans, the number of park respondents who said they had plans to add more features at their facilities over the next several years was down in 2021, but they were still much more likely than non-park respondents to have such plans. Some 46.8% of park respondents in 2021 said they would be adding features at their facilities, down from 53.7% in 2020. This compares with just 29.8% of non-park respondents who had plans to add features at their facilities.
The most commonly planned additions for park respondents were:
- Outdoor fitness areas and fitness trails (planned by 26% of park respondents who will be adding features)
- Splash play areas (24.9%)
- Walking and hiking trails (21.7%)
- Dog parks (20.6%)
- Playgrounds (19.9%)
- Park shelters (18.4%)
- Disc golf courses (18.4%)
- Bike trails (18.4%)
- Park restroom structures (16.6%)
- Open spaces and natural areas (13.7%)
Features that were more likely to be in the works in 2021 than in 2020 include: outdoor fitness areas and fitness trails (up from 18.5%); walking and hiking trails (up from 20%); bike trails (up from 14.5%); and open spaces and natural areas (up from 10%). Note that all of these features are among the types of amenities that have become much more popular over the past year as the coronavirus pandemic forced people to seek their fitness and socialization in the great outdoors.
The Pandemic Impact
At this point, it is undeniable that parks and recreation organizations have served an important role in the pandemic. If nothing else, parks and trails have provided one of the only places where people can gather socially or for exercise and wellness activities. But more than that, many parks and rec organizations provided essential services such as childcare for essential workers and programs to address food insecurity.
When it comes to closures, 68% of park respondents said they had closed indoor facilities, and 35.1% said they had closed outdoor facilities as a result of the pandemic. In addition, 63.2% said they had opened facilities with physical distancing requirements in place. More than one out of 10 (10.2%) said they had converted some of their existing facility space for health care use.
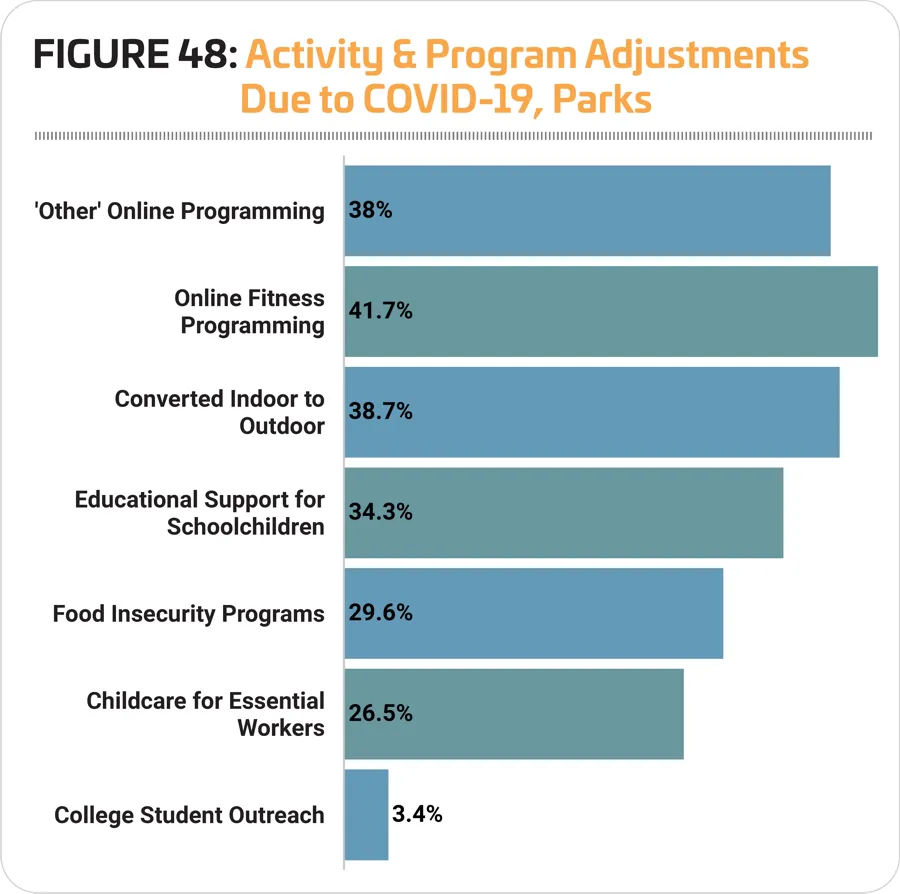
When it comes to programming, 41.7% of park respondents said they had introduced new online fitness and wellness programming, while 38% had introduced other types of online programs. Another 38.7% said they had converted some of their indoor programming to take place outdoors. More than one-third (34.3%) said they had provided educational support to children who were out of school. Nearly three in 10 (29.6%) had introduced programs to address food insecurity, and 26.5% said they had provided childcare for essential workers. (See Figure 48.)
Programming
Park respondents were slightly more likely than non-park respondents to indicate that they provide programming of any kind at their facilities. While 96.4% of non-park respondents offer programming, some 99.1% of park respondents do so, up from 98.7% in 2020.
The most common programs found in park respondents' facilities include: holiday events and other special events (82.8% of park respondents include them); youth sports teams (73%); day camps and summer camps (67.9%); educational programs (62.2%); group exercise programs (61.9%); arts and crafts programs (61.2%); programs for active older adults (60.8%); adult sports teams (59.1%); fitness programs (55.8%); and festivals and concerts (53.3%).
As with the most commonly planned feature additions, the most commonly planned program additions in 2021 for parks seem to reflect the demand over the past year for programs addressing fitness and wellness, as well as outreach to teens—always a popular planned program among parks but perhaps even more vital in the wake of a year of remote or hybrid learning and social distancing.
Programs that saw an increase for park respondents in 2021 include: holidays and other special events (up from 81.6%); youth sports teams (up from 70.2%); day camps and summer camps (up from 65%); arts and crafts (up from 59.2%); and programs for active older adults (up from 58.6%).
Park respondents were more likely than non-park respondents to report that they had plans to add more programming options at their facilities over the next several years. Some 44.8% of park respondents said they had such plans (up from 40.8% in 2020), compared with just 29.7% of non-park respondents (down slightly from 30.1% in 2020).
As with the most commonly planned feature additions, the most commonly planned program additions in 2021 for parks seem to reflect the demand over the past year for programs addressing fitness and wellness, as well as outreach to teens—always a popular planned program among parks but perhaps even more vital in the wake of a year of remote or hybrid learning and social distancing.
The most commonly planned program additions in 2021 for parks include:
- Group exercise programs (up from No. 4)
- Teen programming (no change)
- Fitness programs (no change)
- Mind-body balance programs such as yoga (up from No. 6)
- Programs for active older adults (up from No. 7)
- Educational programs (did not appear in the top 10 for parks in 2020)
- Environmental education programs (down from No. 1)
- Holidays and other special events (did not appear in 2020)
- Adult sports teams (did not appear in 2020)
- Special needs programs (down from No. 9)
Educational programs, holidays and special events, and adult sports teams replaced day camps and summer camps, arts and crafts programs, and performing arts programs. RM