A Look at Trends in Colleges & Universities
In this section, we'll examine the trends reported by college and university respondents to the Industry Report survey, who made up 13.6% of respondents, up from 9.5% of survey respondents in 2020.
College respondents were slightly more geographically diverse, when compared with other groups of respondents. The largest number of them—25.7%—were from the South Atlantic region. Another 23.5% were from the Midwest, while 21.9% were from the Northeast. Smaller numbers were located in the South Central region (15%) and in the West (13.9%).
College respondents were most likely to report from suburban or urban communities. Some 39.2% said they were located in a suburban community, while 37.6% said they were located in an urban community. Just 23.1% said they were in a rural area.
On average, college respondents said they reach a population of 32,110 people, down from 55,550 in 2020, but still above 2019's average of 22,420. College respondents were much more likely than non-college respondents to report that they reach a population of 20,000 or fewer, while being much less likely to reach 100,000 or more. Nearly three-quarters (74.3%) of college respondents said they serve populations of 20,000 or fewer people, compared with 40.4% of non-college respondents. On the other hand, just 5.3% of college respondents said they reach an audience of 100,000 or more, compared with 23.4% of non-college respondents.
Nearly two-thirds (64.9%) of college respondents said they were with public colleges and universities. Another 28.7% were with private nonprofit schools, while 6.4% said they were with private, for-profit schools.
On average, respondents from colleges and universities manage 3.7 facilities, down from 5.1 in 2020. They were far more likely to manage three or fewer facilities, while being unlikely to manage 10 or more. Nearly two-thirds (66.3%) of college respondents said they manage one to three facilities. This compares with 58.4% of non-college respondents. On the other hand, while 5.9% of college respondents said they manage 10 or more facilities, 17.2% of non-college respondents said they manage 10 or more.
Respondents from colleges and universities were slightly less likely than others to report that they had partnered with other organizations. Some 86.4% of college respondents said they had formed such partnerships, up from 83.5% in 2020. This compares with 88.2% of non-college respondents. College respondents were far more likely to report that they had partnered with other colleges and universities. In fact, nearly two-thirds (65.2%) of college respondents said they had partnered with other colleges and universities, compared with just 31.3% of non-college respondents. At least a quarter of college respondents had also partnered with: local schools (38.6%); state government (35.3%); local government (27.7%); and nonprofit organizations (25%).
Synthetic Turf on the Rise at Colleges
Since 2017, the number of college respondents who indicate that their facilities currently include synthetic turf sports fields has been on the rise. In 2021, more than half (50.5%) of college respondents report that their facilities currently include synthetic sports fields. This compares with just 15.8% of non-college respondents, and is up from 42.1% in 2020 and just 36.1% in 2017. The percentage of non-college respondents with synthetic turf has changed little in that time period.
Revenues & Expenditures
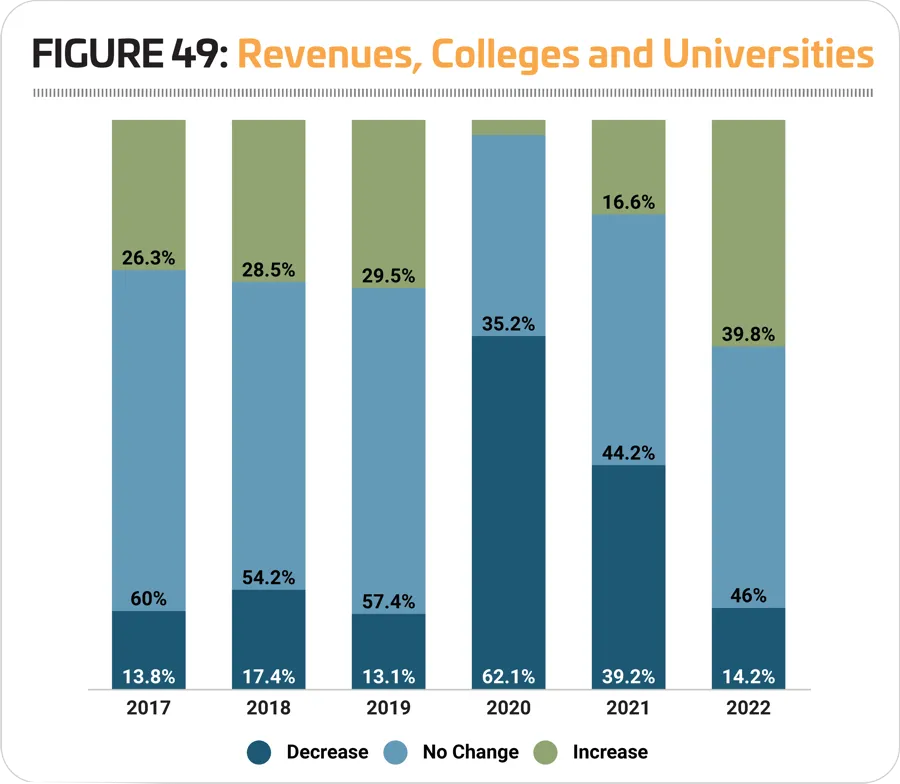
Over the past several years, college respondents have been less likely than non-college respondents to report increases in their revenues. And in 2020, a year when few respondents in general saw increasing revenues, college respondents were by far the least likely to report that their revenues had increased. Only 2.7% of college respondents said their revenues had increased in 2020, compared with 15.1% of non-college respondents. Another 35.2% of college respondents said their revenues had remained the same, while 62.1% reported a decrease.
College respondents also seem to expect a slower return to normal, with just 16.6% expecting revenues to increase in 2021, while 44.2% expect revenues to remain the same and 39.2% projected a further decrease. Looking forward, 39.8% of college respondents are expecting higher revenues in 2022, with 46% expecting revenues to remain the same and 14.2% expecting a decrease. (See Figure 49.)
College respondents reported a much steeper drop in their average operating costs from 2019 to 2020, compared with the general survey population. While overall, respondents reported a 12% decrease in operating expenses from 2019 to 2020, college respondents reported a 25.8% drop, from an average of $2,170,000 to $1,610,000.
Looking forward, college respondents were expecting a slight, 2.5% increase to operating expenses in 2021, to an average of $1,650,000. This is followed by a 3.6% increase in 2022, to an average of $1,710,000—still 21.2% less than the average for 2019.
College respondents reported that they recover an average of 42.8% of their operating costs via revenues, down from 46.7% in 2020. They were much more likely than non-college respondents to report that they recover 10% or less of their costs via revenue. Some 17.9% of college respondents recover 10% or less, compared with 9.1% of non-college respondents. Some 40.8% of college respondents said they recover 30% or less of their operating costs via revenues, compared with 26.4% of non-college respondents. Another 19.6% of college respondents said they recover between 31% and 70% of their costs via revenues, while 22.8% said they recover 71% or more.
While college respondents are usually a little less likely than average to report that they had taken action to reduce their operating expenses, this year that trend reversed, and college respondents were slightly more likely than non-college respondents to have taken such action. Some 93.3% of college respondents said they had taken actions to reduce their operating expenses, compared with 89.6% of non-college respondents. College respondents were much more likely than non-college respondents to report that they had reduced their hours of operation (67.8% vs. 50.5%) or instituted a hiring freeze (41.7% vs. 28.1%). Other actions that college respondents had commonly deployed to reduce their operating costs included: cutting programs or services (57.8%); reducing staff (55%); and closing facilities temporarily (51.1%).
College Facilities
The impact of the coronavirus pandemic is easy to see in the number of people using college respondents' facilities in 2020 and 2021. In 2020, 63.6% of college respondents said the number of people using their facilities decreased, while 23.4% reported no change and 13% reported an increase. In 2021, they are still expecting visitorship to be down, with 38.3% reporting a lower number of people using their facilities, 30.1% reporting no change and 31.7% reporting an increase. (See Figure 50.)
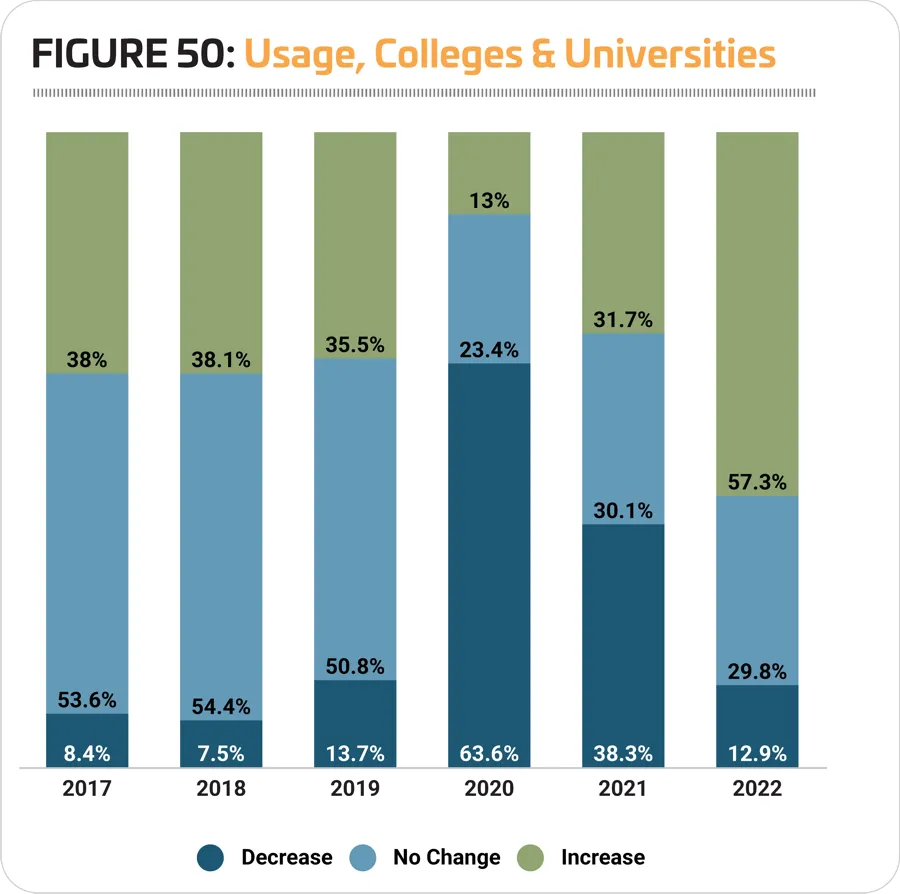
Looking forward, college respondents seem to be expecting a return to normal in 2022, with well over half (57.3%) reporting that they expect usage of their facilities to increase next year, 29.8% expecting no change, and 12.9% expecting a decrease.
College respondents were much less likely than non-college respondents to report that they have plans for construction over the next few years. Some 52.7% of college respondents said they have such plans, while 66.8% of non-college respondents are planning construction. That said, this represents very little change for college respondents from pre-pandemic construction plans. In January 2020 when the previous Industry Report survey was taken, 52.4% of college respondents had plans for construction.
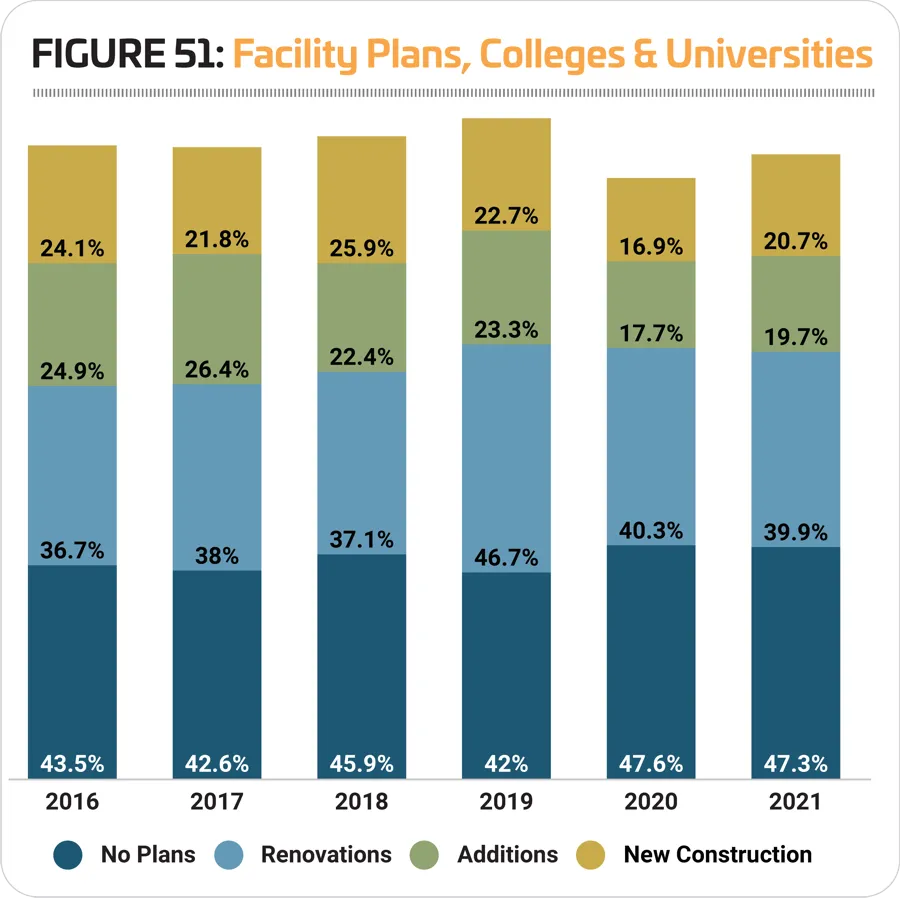
In addition, college respondents in 2021 were actually slightly more likely than in 2020 to be planning to build new facilities or make additions to their existing facilities. Some 20.7% of college respondents in 2021 said they would be building new facilities (up from 16.9% in 2020), and 19.7% said they would be making additions (up from 17.7%). Another 39.9% said they were planning renovations to their existing facilities. (See Figure 51.)
After an increase to college respondents' construction budgets in 2020, they reported a 14.7% decrease in 2021, from an average of $9,020,000 to $7,690,000. As usual, college respondents are among the biggest spenders on their construction plans, spending 75.5% more than the average for all respondents of $5,140,000.
There was little to no change in the past year to the features most commonly found among college respondents' facilities. The 10 features that are most common in college and university facilities included: locker rooms; fitness centers; indoor sports courts for sports like basketball and volleyball; exercise studio rooms; classrooms and meeting rooms; bleachers and seating; natural turf sports fields; Wi-Fi services; indoor walking and running tracks; and outdoor sports courts for sports like tennis and basketball.
College respondents were much less likely than non-college respondents to report that they had plans to add features at their facilities over the next three years. While 39.1% of non-college respondents said they had such plans, just 23.9% of college respondents said they would be adding features, down from 32.3% in 2020, and 33.3% in 2019.
The most commonly planned additions for college respondents in 2021 include:
- Synthetic turf sports fields (planned by 28.9% of college respondents with plans to add features)
- Exercise studio rooms (26.7%)
- Fitness trails and outdoor fitness equipment (17.8%)
- Outdoor sports courts (15.6%)
- Disc golf courses (13.3%)
- Fitness centers (13.3%)
- Classrooms and meeting rooms (13.3%)
- Natural turf sports fields (11.1%)
- Indoor sports courts (11.1%)
- Outdoor aquatic facilities (11.1%)
Synthetic turf sports fields have been at the top of the list of planned features for college facilities for a number of years. While there was a decrease in the percentage of those with plans to add them, from 30% in 2020, the number is still higher than in 2019, when 26% of those with plans to add features said they would be adding synthetic turf.
Fitness trails and outdoor fitness equipment saw a slight increase from 2020, as did exercise studio rooms. Disc golf courses and outdoor aquatic facilities also got a boost in 2021.
Programming
A majority of college respondents (96.7%) said they offer programming of some kind at their facilities, representing virtually no change from 2020, when 96% said they provide programming. This compares with 97.7% of non-college respondents who said they offer programming in 2021.
Fitness programs are still the most common type of program provided by college respondents. Some 81.5% of college respondents said they currently have fitness programs, up from 80.6% in 2020.
Other programs commonly found at college respondents' facilities include: group exercise programs (71.2% of college respondents said they have group exercise programs); mind-body/balance programs like yoga (65.2%); adult sports teams (56.5%); functional fitness programs (56%); personal training (50%); educational programs (49.5%); swimming programs (47.8%); individual sports activities like running clubs or swim clubs (47.8%); and sports tournaments and races (46.2%).
College respondents were less likely than non-college respondents to report that they had plans to add programs at their facilities over the next few years. Some 29.8% of college respondents said they were planning to add programs (representing no change from 2020), compared with 37.4% of non-college respondents.
The top 10 planned program additions for college respondents include:
- Group exercise programs (up from No. 4)
- Fitness programs (up from No. 3)
- Functional fitness programs (down from No. 2)
- Mind-body/balance programs like yoga (did not appear in the top 10 for 2020)
- Nutrition and diet counseling programs (down from No. 1)
- Day camps and summer camps (down from No. 5)
- Swimming programs (did not appear in 2020)
- Personal training (did not appear in 2020)
- Educational programs (down from No. 7)
- Aquatic exercise programs (did not appear in 2020)
New to the list in 2021 are mind-body/balance programs, swimming programs, personal training, and aquatic exercise programs. These replace sports tournaments and races, individual sports activities like running clubs, sport training such as golf or tennis lessons, and climbing programs.
Top Challenges
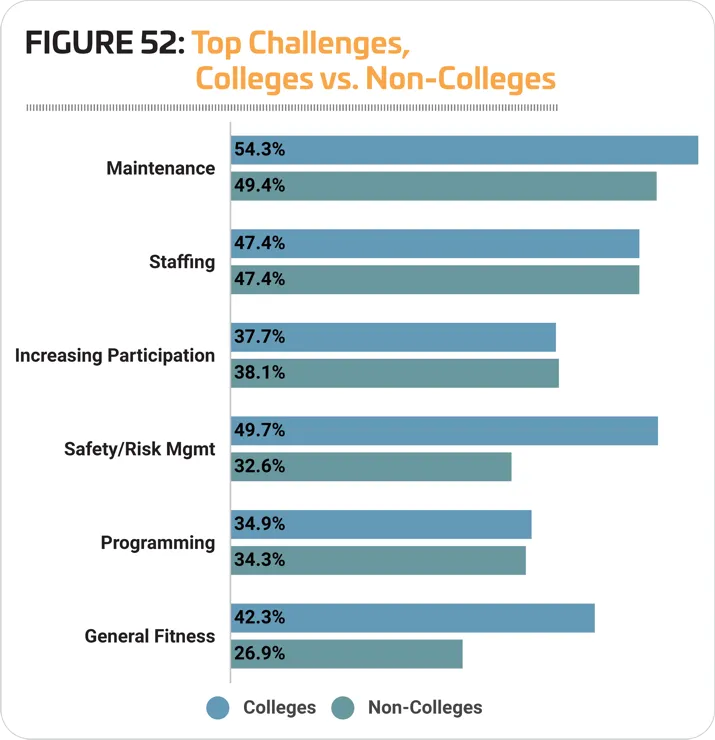
When it comes to the top concerns facing college respondents, they differed from the other survey respondents and were far more likely to name general fitness as a concern, while being somewhat more likely to name equipment maintenance and safety issues as top concerns. Some 42.3% of college respondents said general fitness and wellness were a top concern at their facility, compared with just 26.9% of non-college respondents. Likewise, while 54.3% of college respondents said equipment maintenance was their top concern, that number falls to 49.4% for non-college respondents; and while 49.7% of college respondents said safety and risk management was their top concern, just 32.6% of non-college respondents named safety and risk management a top concern. (See Figure 52.) RM