


A Look at Trends in YMCAs, YWCAs, JCCs and Boys & Girls Clubs
In these pages, we cover Ys, which includes not only YMCAs, but similar facilities that typically operate as nonprofits and provide similar services, such as YWCAs, JCCs and Boys & Girls Clubs. These facilities tend to stand apart in ways other than their nonprofit status, including their diverse program offerings and outreach to their communities. Respondents from Ys and similar facilities made up 8.2% of the survey response in 2021.
Y respondents were most likely to be located in the Midwest. Some 31.6% of Y respondents said they were from this region. They were followed by the Northeast, which is home to 22.8% of Y respondents. Smaller numbers were from the South Central region (18.4%), the South Atlantic (14.9%) and the West (12.3%).

Well over half (56.1%) of Y respondents said they were located in suburban communities. Another 22.8% were located in urban areas, and 21.1% were to be found in rural communities.
On average, Y respondents said they reach a population of 106,700 people, up from 83,310 in 2020. They were slightly less likely to reach 20,000 or fewer, while being slightly more likely to reach 100,000 or more, when compared with respondents from other types of facilities. Some 38.1% of Y respondents said they reach a population of 20,000 or fewer, compared with 43.9% of non-Y respondents. On the other hand, 28.3% of Y respondents said they reach a population of 100,000 or more, compared with 20.3% of non-Y respondents.
On average, respondents from Ys said they manage 4 facilities, up from 2.5 in 2020, but not much changed from 2019, when the average was 4.2. They were much more likely than other respondents to manage between one and three facilities. Some 74.6% of Y respondents said they manage one to three facilities, compared with 58.1% of non-Y respondents. On the other end of the spectrum, while 8.8% of Y respondents manage 10 or more facilities, nearly twice as many—16.2%—non-Y respondents said they have at least 10 facilities to manage.
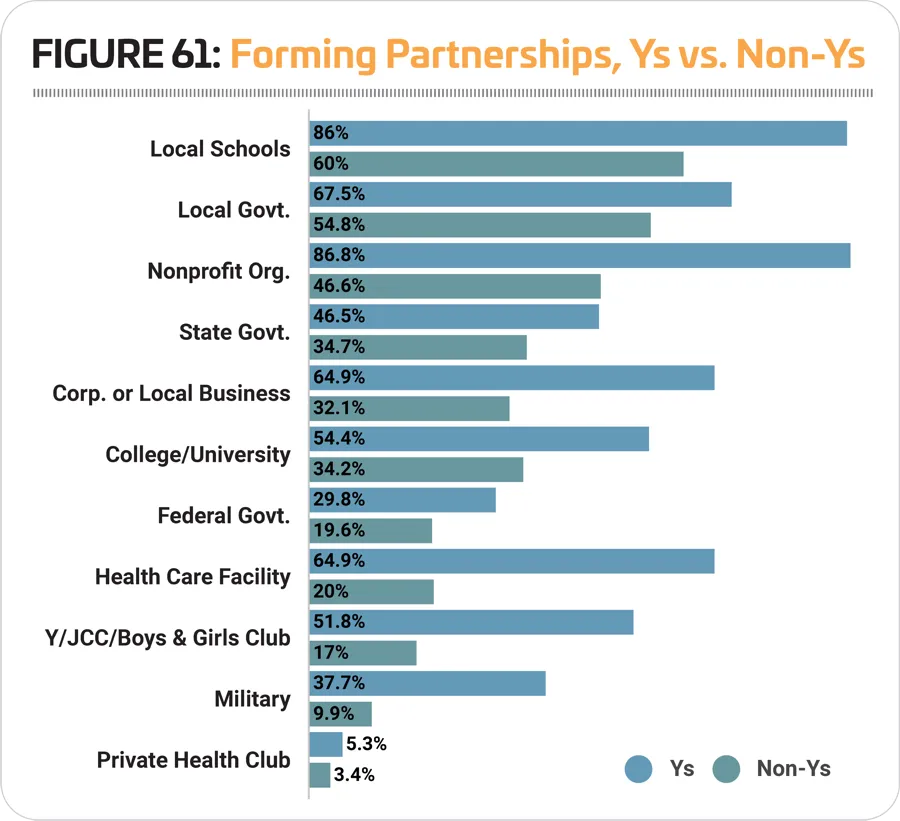
Y respondents were much more likely than other respondents to report that they form partnerships with other organizations. The vast majority—97.4%—of Y respondents said they have such partnerships, compared with 87.1% of non-Y respondents. They were also more likely to engage with every kind of partner covered by the survey than their non-Y counterparts. The most common partners for Ys in 2021 were: nonprofit organizations (86.8%, compared with 46.6% of non-Y respondents); local schools (86% vs. 60%); local government (67.5% vs. 54.8%); corporate or local businesses (64.9% vs. 32.1%); and health care or medical facilities (64.9% vs. 20%). (See Figure 61.)
Y respondents were most likely to report that they primarily serve all ages. More than half (54.4%) said they reach all ages. Another 23.7% said they primarily reach adults, while 15.8% primarily serve children ages 4 to 12 at their facilities. Smaller numbers said they primarily reach infants and toddlers (2.6%), teens (1.8%) or seniors (1.8%).
Revenues & Expenditures
Following a very good year in 2019, when more than six in 10 (61.2%) Y respondents reported an increase in revenues, Y respondents were the most likely to report that their revenues had fallen in 2020. In fact, 83.9% of Y respondents said their revenues in 2020 were down, compared with 63.2% of non-Y respondents. Another 16% of Y respondents said their revenues had either remained flat (8%) or increased (8%) in 2020. (See Figure 62.)
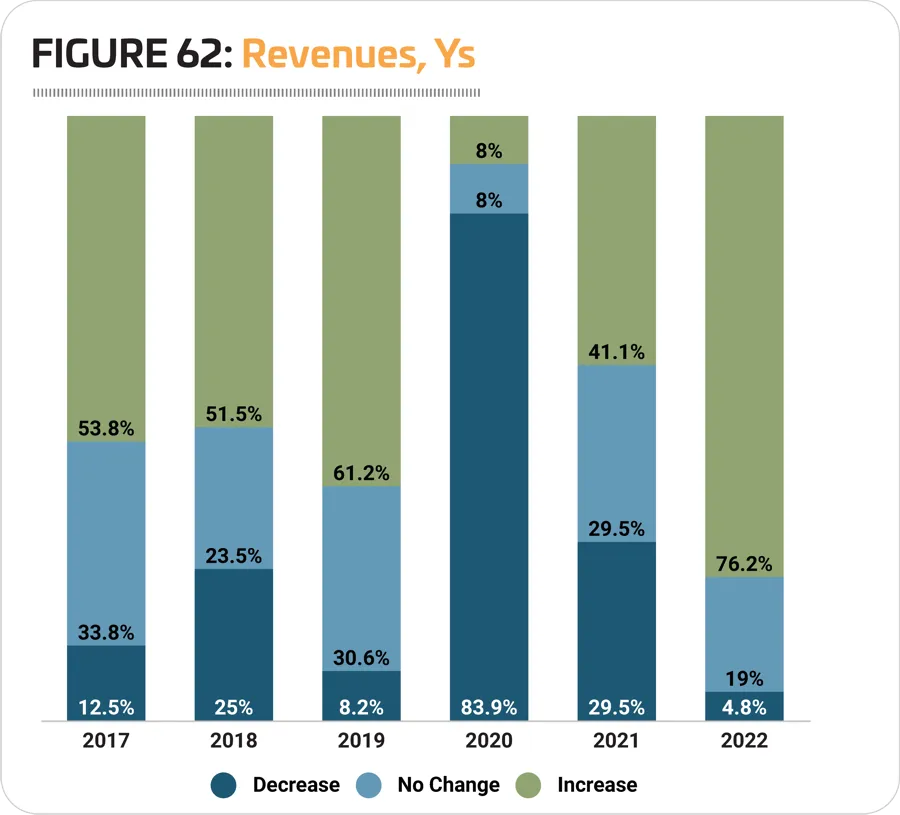
Y respondents had a relatively positive outlook for 2021, with 41.1% expecting revenues to increase and 29.5% expecting no change. Another 29.5% of Y respondents said they expect their revenues to decrease in 2021.

Looking forward, Y respondents reverse their position of 2020 and are the most positive about their prospects for 2022. More than three-quarters (76.2%) of Y respondents said they expect their revenues to increase in 2022. This compares with 56.2% of non-Y respondents. Another 19% of Y respondents expect no change in revenues in 2022, and just 4.8% are expecting a decrease.
After reporting a 5.3% increase in their operating expenses from 2018 to 2019, Y respondents reported a much greater increase in 2020. Y respondents reported an average operating cost in 2020 of $3,760,000, 35.3% higher than the average for 2019 of $2,780,000. While they projected a very slight decrease of 0.3% from 2020 to 2021 (to an average of $3,750,00), they expect their operating costs to rise 4.3% between 2020 and 2022, to an average of $3,920,000.
On average, Y respondents reported that they recover 72.2% of their operating costs via revenues, up slightly from 71% in 2020. Nearly six out of 10 (59.3%) Y respondents said they earn back at least 71% of their operating costs via revenues, compared with just 28% of non-Y respondents. On the other hand, while less than one-fifth (19.5%) of Y respondents said they earn back less than half of their operating costs via revenues, some 44.9% of non-Y respondents earn back less than half of their cost.
As usual, Y respondents were much more likely than most others to report that they had taken action to reduce their operating expenses. Some 97.4% of Y respondents said they had taken such action, up from 90.6% in 2020. This compares with 90.9% of non-Y respondents (also up, from 80.6%). The most common actions Y respondents had taken to reduce their costs included: reducing staff (83.3% of Y respondents had done so, compared with 54.1% of non-Y respondents); cutting programs or services (82.5% vs. 53.2%); reducing their hours of operation (78.1% vs. 50.4%); closing facilities temporarily (53.5% vs. 49.1%); and putting construction or renovation plans on hold (49.1% vs. 33.1%).
Y Facilities
While in most years around half of Y respondents report an increase in the number of people using their facilities, 2020 was an obvious exception. In 2020, 91.2% of Y respondents said the number of people using their facilities decreased, while 3.5% reported no change, and 5.3% reported an increase. (See Figure 63.)
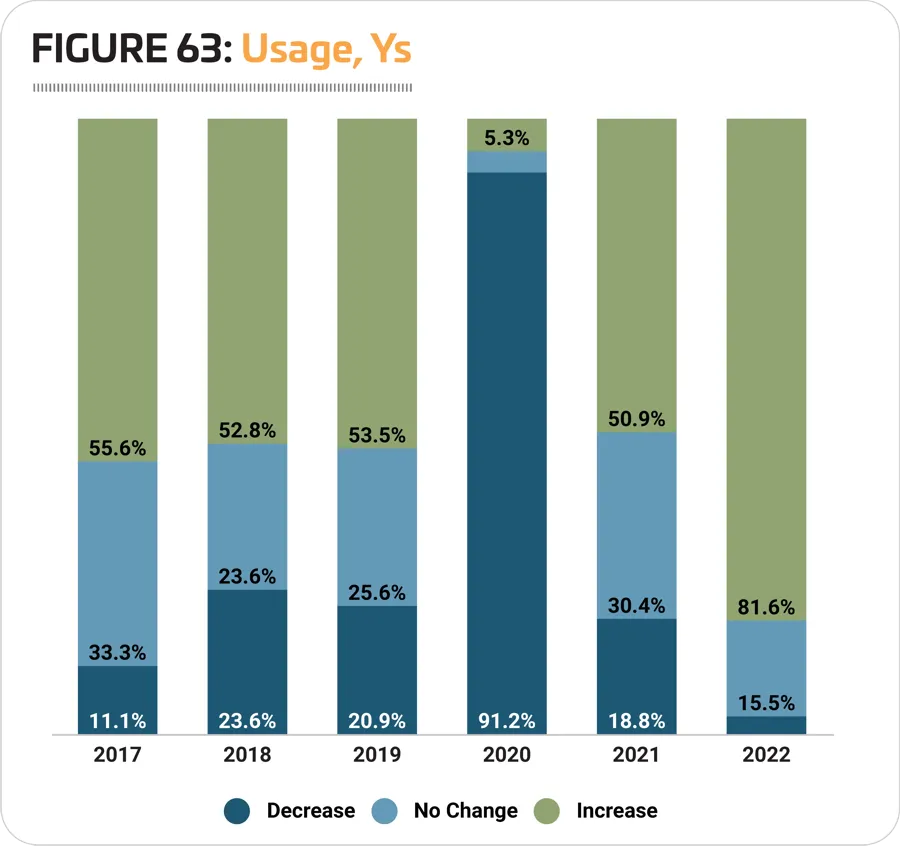
Following this dramatic drop, Y respondents expect a rapid return to normal in 2021, with more than half (50.9%) projecting an increase in usage, 30.4% expecting no change and 18.8% expecting usage of their facilities to decline. And in 2022, 81.6% of Y respondents are expecting an increase in the number of people using their facilities, while 15.5% expect no change and 2.9% expect a decrease.
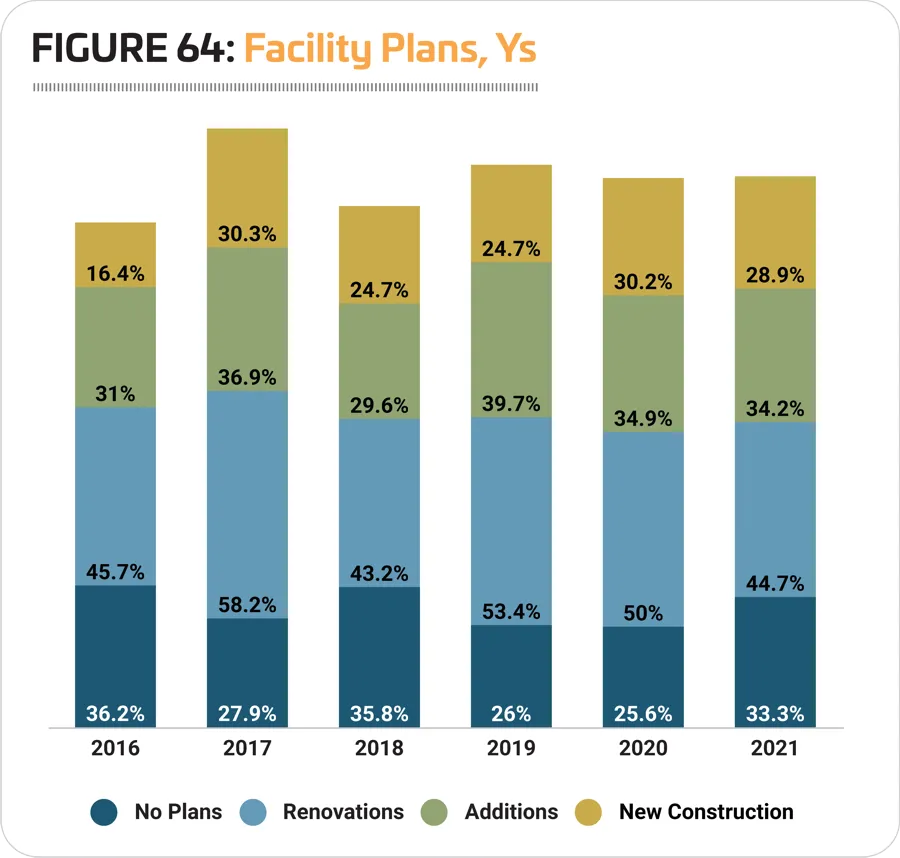
Two-thirds (66.7%) of Y respondents in 2021 said they have plans for construction, down from 74.4% in 2020, but still higher than in 2018, when 64.2% had construction plans. Some 44.7% of Y respondents said they were planning renovations to their existing facilities. Another 34.2% were planning additions, and 28.9% were planning new construction. (See Figure 64.)
The amount Y respondents were planning to spend on construction fell by a third in 2021. Y respondents were planning to spend an average of $5,190,000, 33.3% lower than the average for 2020 of $7,780,000, but just 0.4% less than the average in 2019 of $5,210,000.
The 10 features most commonly found in Y respondents' facilities in 2021 include: exercise studio rooms; fitness centers; indoor courts for sports like basketball and volleyball; classrooms and meeting rooms; Wi-Fi service; childcare centers; indoor aquatic facilities; playgrounds; bleachers and seating; and open spaces such as gardens and natural areas.
Some 38.6% of Y respondents said they have plans to add features at their facilities over the next several years, representing virtually no change from 2020, when 38.4% had such plans. This compares with 36.9% of non-Y respondents who plan to add features.
The most commonly planned additions for Y respondents in 2021 include: splash play areas; outdoor courts for sports like tennis and basketball; natural turf sports fields; fitness trails and outdoor fitness equipment; playgrounds; park shelters like gazebos and picnic shelters; synthetic turf sports fields; outdoor aquatic facilities; outdoor tracks; and indoor aquatic facilities.
PANDEMIC PROGRAMMING
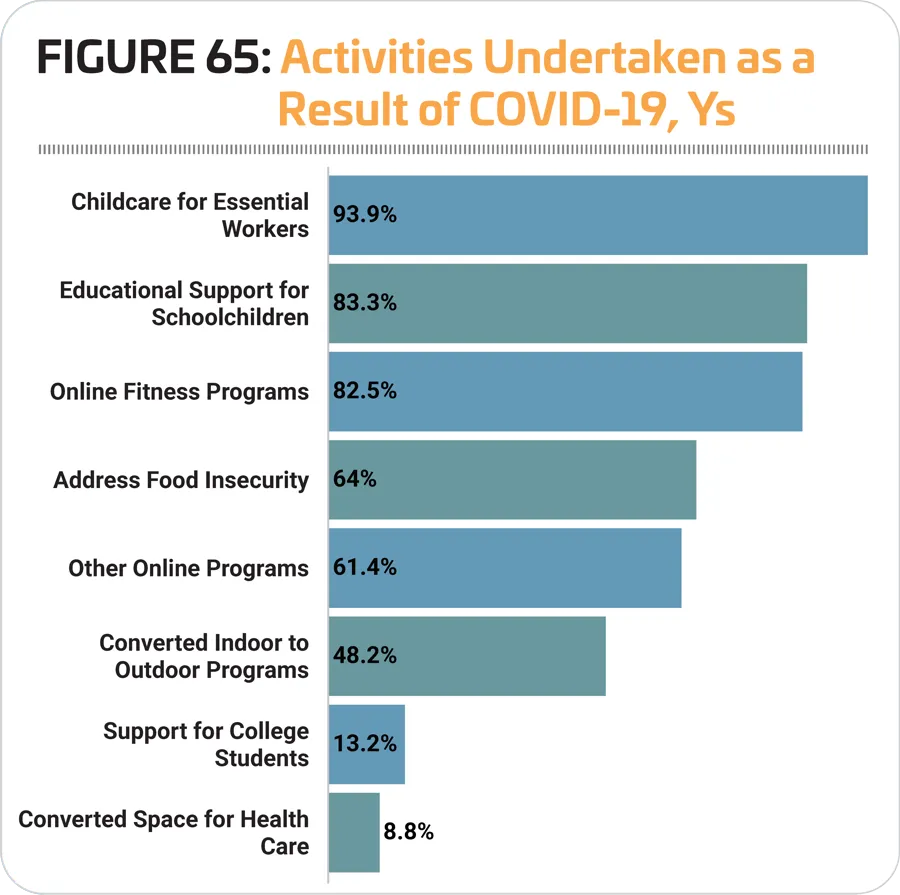
The closures and social distancing measures associated with the COVID-19 pandemic obviously shuttered many facilities and forced virtually everyone to adapt. Many facilities offered online programming, introduced programs to address food insecurity and more. Every single respondent from YMCAs and related facilities said that they had taken at least one of the measures covered in the Industry Report survey question covering actions and activities undertaken as a result of the pandemic.
Most common? Providing childcare for essential workers. The vast majority of Y respondents (93.9%) said they had provided childcare for essential workers during the pandemic. This compares with just 19.6% of non-Y respondents. Another 83.3% of Y respondents had provided educational support for schoolchildren, compared with 27.7% of non-Y respondents. And 82.5% of Y respondents said they had introduced new online fitness or wellness programs, compared with 39.7% of non-Y respondents.
More than half of Y respondents also said they had introduced programs to address food insecurity (64%) or introduced other online programming (61.4%). (See Figure 65.)
When it comes to facility closures, 45.6% of Y respondents said they had closed indoor facilities, and 7.9% had closed outdoor facilities. However, eventually the majority of Y respondents had reopened their facilities: 78.9% of Ys reported that they had opened their facilities with physical distancing requirements in place.
Programming
As is almost always the case, 100% of Y respondents said they offer programming of some kind at their facilities. This compares with 97.4% of non-Y respondents.

The programs most commonly provided by Y respondents' facilities in 2021 include: day camps and summer camps (provided by 90.4% of Y respondents); youth sports teams (90.4%); fitness programs (88.6%); group exercise programs (87.7%); mind-body/balance programs such as yoga or tai chi (85.1%); holidays and other special events (82.5%); swimming programs (79.8%); personal training (79.8%); programs for active older adults (78.9%); and daycare or preschool (78.1%).
Programs that saw growth from 2020 to 2021 include: youth sports teams (up from 88.4%); personal training (up from 76.7%); programs for active older adults (up from 77.9%); and daycare or preschool (up from 77.9%).
The number of Y respondents who said they have plans to add programs at their facilities over the next few years fell to 34.2% in 2021, from 37% in 2020. This compares with 36.3% of non-Y respondents who said they had plans to add programming.
The 10 most commonly planned program additions for Ys in 2021 were:
- Teen programming (no change from 2020)
- Adult sports teams (up from No. 6)
- Performing arts programs (up from No. 4)
- Individual sports activities like running clubs or swim clubs (down from No. 3)
- Nutrition and diet counseling (up from No. 7)
- Environmental education programs (down from No. 2)
- Special needs programs (up from No. 8)
- Youth sports teams (did not appear on this list in 2020)
- Arts and crafts programs (did not appear in 2020)
- Functional fitness programs (did not appear in 2020)
In 2021, youth sports teams, arts and crafts and functional fitness all rise into the top planned programs, replacing sport-specific training, trips and daycare and preschool programs.
Top Challenges for Ys
When it comes to the top issues of concern for their facilities, Ys differed somewhat from the rest of the survey respondents. While for all respondents, equipment and facility maintenance were the top issue of concern, this topic ranked fifth among respondents from Ys. Instead, marketing and increasing participation at their facilities was the top concern for Y respondents. More than half (54.4%) of Y respondents named this their top concern, compared with 36.5% of non-Y respondents. For half (50%) of Y respondents, staffing issues were a top concern, compared with 47.2% of non-Y respondents. And 36% of Y respondents named general fitness and wellness a top concern, vs. 28.3% of non-Y respondents.
When it comes to equipment and facility maintenance, 34.2% of Y respondents named it a top concern, versus 51.6% of non-Y respondents.
In addition to fitness and wellness in general, Y respondents were also more likely to name fitness and wellness for older adults (26.3% vs. 20%) and fitness and wellness for youth (21.1% vs. 17.7%) as a top concern for their facilities. They also were much more likely to cite social equity as a top issue of concern—23.7% of Y respondents said social equity was a top issue for them, compared with 14.1% of non-Y respondents. RM