


A Look at Trends in Camp Facilities
Camp-related facilities covered by the Industry Report faced a unique year from 2020 to 2021. While youth camps and sleepaway camps had to deal with social distancing requirements and local health guidelines, if they opened at all (and many did not), many campgrounds and RV parks saw business pick up as they became one of the only places for people to get away from home for a little R&R.
Respondents who represent camp-related facilities comprised 5.3% of the Industry Report Survey population. Some 3.6% of respondents were from youth or private camps, and 1.7% were from campgrounds or RV parks.
Camp respondents largely represent privately run organizations, with the greatest number, 63.5%, reporting from private, nonprofit organizations. Another 21.6% are from private, for-profit organizations, and 14.9% are with public or governmental organizations.
The largest number of camp respondents, around one-third (33.8%), said they were located in the Midwest. They were followed by those from the Northeast, who made up 24.3% of the respondents, and those from the West, making up 21.6% of camp respondents. Smaller numbers were from the South Atlantic (12.2%) and South Central (8.1%) regions.
Obviously, camp respondents are most likely to be located in rural areas, with 64.4% indicating they called rural communities home. Another 23.3% said they were located in suburban communities, and 12.3% were located in urban areas.
Camp respondents were the least likely to report that they had partnered with any other organizations. While 88.6% of non-camp respondents were involved in these kinds of partnerships, just 77% of camp respondents had partnered with outside organizations, representing virtually no change from 2020, when 76.7% of camps said they had partnered. The most common partners for camps in 2021 included nonprofit organizations (54.1%), local schools (43.2%), and local government (28.4%).
Respondents from camps were most likely to report that they primarily serve an audience of either children ages 4 to 12 (35.1%) or all ages (32.4%). Another 13.6% said they primarily reach teens 13 to 18, while 10.8% primarily serve adults. Some 4.1% said their audience is primarily made up of seniors older than 65.
Revenues & Expenditures
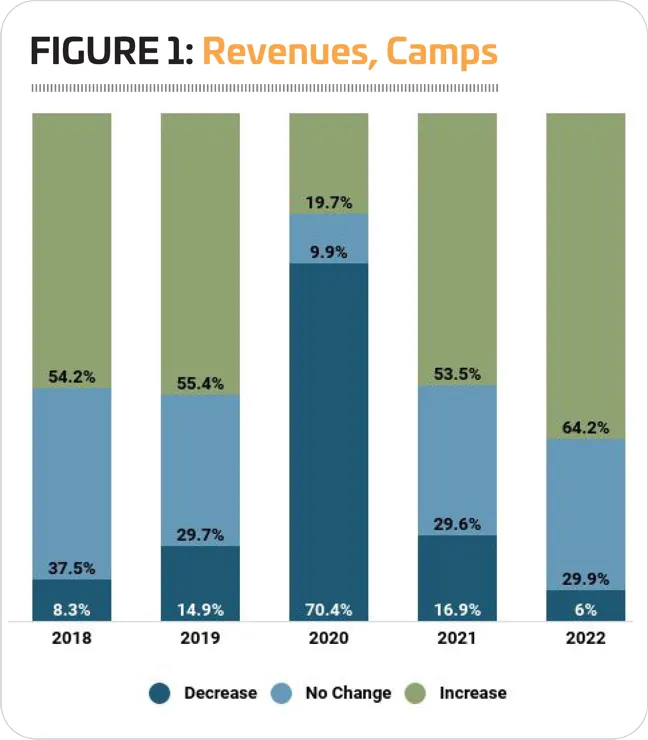
Like all respondents, camps were most likely to report that their revenues had fallen in 2020, though they were slightly less likely to do so than, say, YMCAs, which are also predominantly nonprofit organizations. Some 70.4% of camp respondents said their revenues fell in 2020, while 19.7% said they saw an increase, and 9.9% reported no change.
Looking forward, camp respondents expect a quick return to normal, with projections for 2021 looking not much different from pre-pandemic years. In 2021, 53.5% of camp respondents said they expect their revenues to increase and 16.9% expect a decrease, with the remainder projecting no change. And in 2022, nearly two-thirds (64.2%) expect revenues to increase, while just 6% expect revenues to fall. (See Figure 1.)
Camp respondents reported an average operating expense of $1,550,000 for 2020, 43.5% higher than the average for 2019 of $1,080,000 (but only 13.1% higher than 2018's average of $1,370,000). Looking forward, camp respondents are expecting their operating costs to increase by 14.8% between 2020 and 2022, to an average of $1,780,000.
On average, camp respondents said they recover 75.2% of their operating costs via revenue, which places them second only to health clubs. This is up from 74.4% in 2020 and 73.4% in 2019.
Camps were slightly more likely than the rest of the survey respondents to report that they had taken action over the past year to reduce their operating costs. Some 91.8% of camp respondents said they had taken such action, compared with 90.1% of non-camp respondents. This is up from 87.8% of camp respondents in 2020 who had acted to reduce their costs. The most common actions camp respondents had taken to reduce their costs include: reducing staff (54.8%); cutting programs or services (54.8%); putting construction plans on hold (43.8%); temporarily closing facilities (39.7%); and increasing fees (30.1%).
Camp Facilities
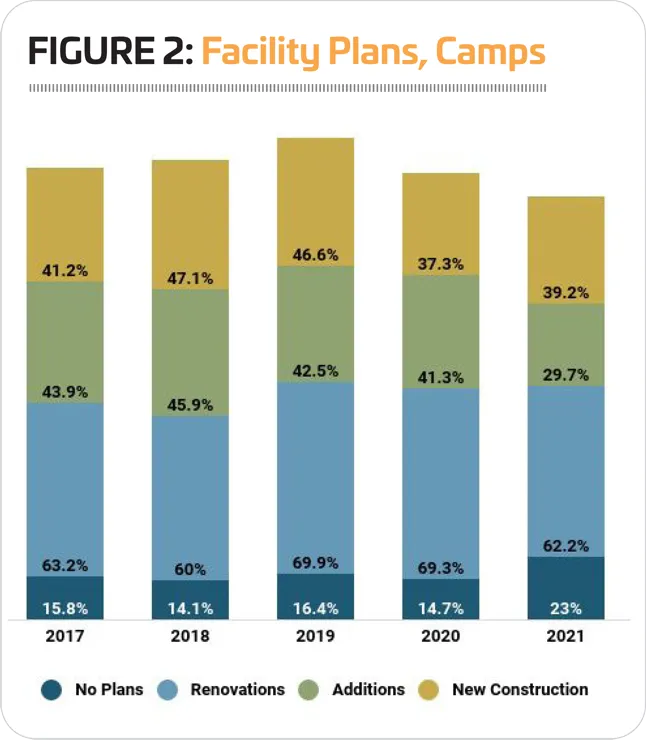
Camp respondents were once again the most likely to report that they had plans for construction over the next three years, though that number did fall in 2021. Some 77% of camp respondents said they were planning construction, compared with 64.2% of non-camp respondents, and down from 85.3% in 2020. Nearly four in 10 (39.2%) camp respondents were planning new construction, 29.7% were planning additions, and 62.2% were planning renovations to their existing facilities. (See Figure 2.)
On average, camp respondents were planning to spend $1,010,000 on their construction plans, a 53.5% decrease from 2020, when they were planning to spend $2,170,000, but only 34.4% lower than the 2019 average of $1,540,000.
The 10 features most commonly included at camp respondents' facilities include: open spaces and natural areas; walking and hiking trails; outdoor courts for sports like basketball and volleyball; campgrounds; playgrounds; Wi-Fi services; waterfronts and marinas; park shelters; restroom structures; and challenge courses and ropes courses.
Camp respondents were somewhat more likely than their peers from other facilities to indicate that they had plans to add features at their facilities over the next three years. Some 41.9% of camp respondents said they had such plans (down from 58.7% in 2020), compared with 36.8% of non-camp respondents.
The most commonly planned additions were:
- Playgrounds (planned by 22.6% of camp respondents who will be adding features)
- Park shelters (22.6%)
- Disc golf courses (22.6%)
- Bike trails (19.4%)
- Nature centers (19.4%)
- Community gardens (16.1%)
- Fitness trails and outdoor fitness equipment (12.9%)
- Walking and hiking trails (12.9%)
- Wi-Fi services (12.9%)
- Climbing walls (12.9%)