


A Look at Trends in Rec Centers
Professionals from community and private recreation and sports centers comprised 8.3% of the total response to the Industry Report survey. More than half (55.7%) said they were with public or governmental rec and sports centers, while 25.2% were private nonprofits and 19.1% were with private, for-profit facilities.
Rec center respondents were most likely to be found in the Midwest and Western regions of the United States. Some 28.1% were located in the Midwest, while 27.2% were in the West. Another 18.4% were from the South Atlantic region, 13.2% were from the Northeast, and 13.2% were from the South Central region.
More than half (50.9%) of rec center respondents said they were located in suburban communities. Another third (33.3%) said they were in urban communities, and 15.8% were located in rural communities.
Rec center respondents were slightly less likely than others to report that they had partnered with other organizations. Some 85.8% of rec center respondents said they had formed such partnerships, down from 87.1% in 2020. The most common partners for rec center respondents were: local schools (68.1%); local government (59.3%); nonprofit organizations (55.8%); corporate or local businesses (46.9%); and colleges and universities (38.1%).
Revenues & Expenditures
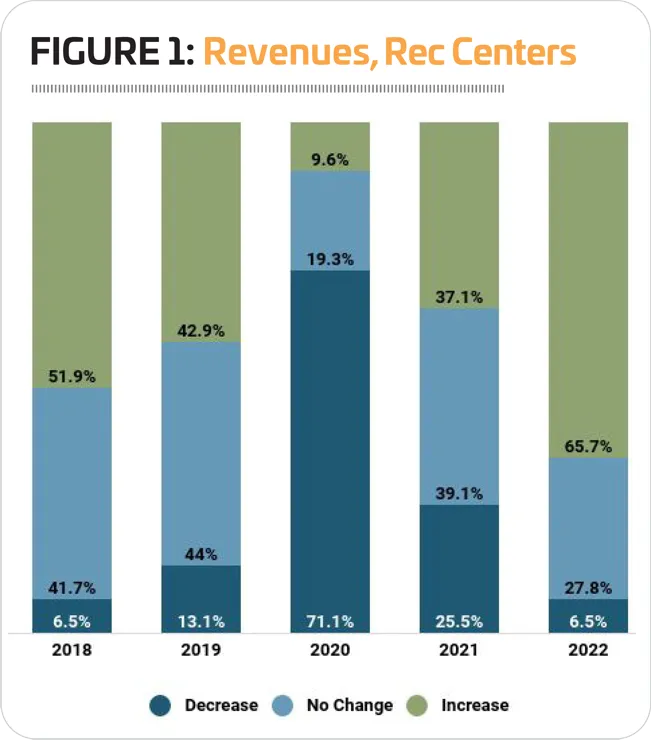
More than seven out of 10 (71.1%) rec center respondents said their revenues decreased from 2019 to 2020, no surprise given the widespread closures associated with the pandemic. Another 19.3% said they had seen no change in their revenues in 2020, while 9.6% reported an increase.
Rec center respondents don't expect business to kick back up to growth levels until 2022. Some 37.1% said they are expecting revenues to increase in 2021, while around a quarter (25.5%) are expecting a decrease. However, in 2022, nearly two-thirds (65.7%) said they are expecting revenues to rise, while 6.5% are projecting a decrease that year. (See Figure 1.)
On average, rec center respondents said they recover 56% of their operating costs via revenues, up from
Rec center respondents reported a 12.3% decrease in their average operating cost in 2020, down from $1,540,000 in 2019 to an average of $1,350,000 in 2020. Looking ahead, they projected an increase of 23% between 2020 and 2022, to an average of $1,660,000. While it's a big jump from 2020, it's a 7.8% increase from the average in 2019.
51.1% in 2020.
Many more rec center respondents reported that they had taken action to reduce their expenditures in 2021 vs. respondents in 2020. Some 95.6% of rec center respondents in 2021 said they had taken such action, up from 79.8% in 2020. The most common actions rec centers had taken to reduce their costs include: reducing their hours of operation (65.5%); reducing staff (62.8%); cutting programs or services (56.6%); temporarily closing facilities (53.1%); and improving energy efficiency (39.8%).
Rec Center Facilities
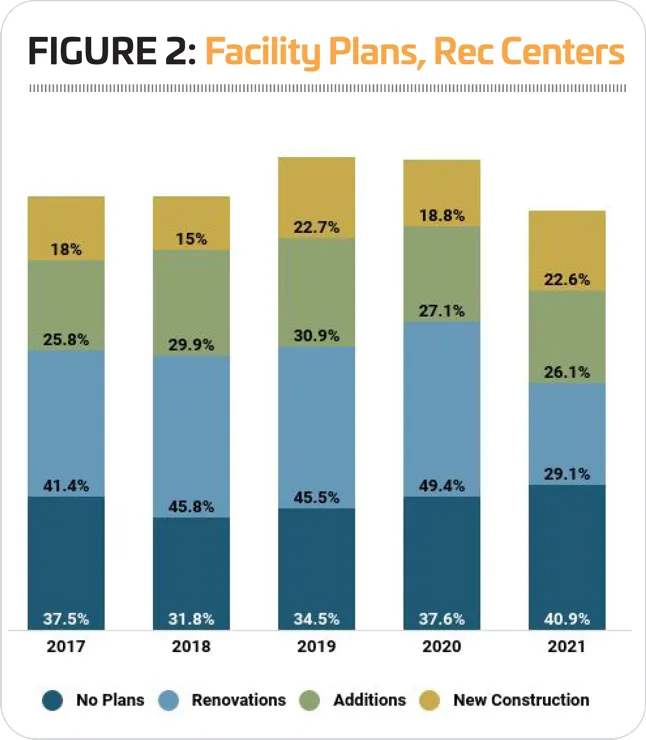
Some 59.1% of rec center respondents in 2021 said they had plans for construction over the next few years, down from 62.4% in 2020. Nearly a quarter (22.6%) said they were planning to build new facilities, while 26.1% were planning additions and 29.1% were planning renovations. (See Figure 2.)
On average, rec center respondents were planning to spend $6,450,000 on their construction plans. This represents a 16% increase over 2020, when they planned to spend an average of $5,560,000.
The 10 features most commonly included among rec center respondents' facilities include: Wi-Fi services; classrooms and meeting rooms; bleachers and seating; locker rooms; fitness centers; exercise studio rooms; playgrounds; indoor courts for sports like basketball and volleyball; outdoor courts for sports like tennis and basketball; and concession areas.
Rec center respondents were one of the only groups to be more likely to report in 2021 than in 2020 that they had plans to add features at their facilities over the next few years. Some 39.1% of rec center respondents said they had such plans, up from 38.8% in 2020. This compares with 36.9% of non-rec-center respondents.
The most commonly planned additions were:
- Fitness trails and outdoor fitness equipment (planned by 26.7% of rec center respondents who will be adding features)
- Splash play (24.4%)
- Climbing walls (17.8%)
- Exercise studios (17.8%)
- Park shelters (15.6%)
- Disc golf courses (15.6%)
- Bike trails (15.6%)
- Open spaces and natural areas (15.6%)
- Fitness centers (15.6%)
- Classrooms and meeting rooms (15.6%)