


Here, we expand on our State of the Industry Report issue to bring you even more details, this time on trends in camping-related facilities. These respondents made up 11.2% of the survey results, with 8% of all respondents reporting from youth camps or private camps, and 3.2% with campgrounds and RV parks.
The majority of camp respondents—93.7%—were with private organizations. Just 6.3% said they were with public or governmental organizations. Nearly two-thirds (65.1%) of camp respondents were with private nonprofit facilities, and 28.6% were with private, for-profit facilities.
More than one-third (34.4%) of camp respondents said they were located in the Midwest. They were followed by those from the Northeast, who made up 27.9% of the responses from camps. The Western region was also well represented, with 21.3% of camp respondents hailing from that region. The southern states saw less representation, with 8.2% of camp respondents in the South Atlantic region and 8.2% of camp respondents in the South Central region.
Camp respondents were, not surprisingly, most likely to be located in rural areas, with 80.3% indicating their facilities were in rural communities. Another 185 said they were located in suburban communities. No camp respondents were located in urban areas.
Camp respondents are generally much less likely than most other respondents to report that they partner with other organizations, though a majority do so. In 2022, 65.6% of camp respondents said they had partnered with outside organizations, compared with 84.7% of non-camp respondents. The most common partners for camps included nonprofit organizations (42.6%), local schools (29.5%), and state government (16.4%).
More than one-third (33.9%) of camp respondents said that their primary audience was made up of children ages 4 to 12. Slightly fewer (30.6%) said they reached all ages. Around one-fifth (19.4%) said their audience is mainly made up of teenagers 13 to 18 years old, and 12.9% primarily reach adults. Another 1.6% said they primarily work with infants and toddlers, and another 1.6% primarily reach seniors.
Revenues & Expenditures
In 2020, 70.4% of camp respondents saw their revenues fall, but 2021 reversed that trend. In fact, 72.6% of camp respondents said their revenues were higher in 2021. This compares with just 49.1% of non-camp respondents who reported higher revenue in 2021. Another 12.9% of camp respondents said their revenues remained the same in 2021, and 14.5% reported a decrease.
In 2022, more than three-quarters (75.8%) of camp respondents said they expect their revenues to be higher, while 16.1% expect no change and 8.1% expect a decrease. And in 2023, 78% of camp respondents are expecting their revenues to increase, while 20.3% expect no change and 1.7% expect a decrease.
Camp respondents reported an average operating expense of $860,000 for 2021, 44.5% lower than the average for 2020 of $1,550,000, but just 20.4% lower than the average for 2019 of $1,080,000. In 2022, camp respondents expect their average operating cost to increase 11.6%, to $960,000, and they expect a further 29.2% increase in 2023, to an average of $1,240,000.
On average, camp respondents said they recover 74.9% of their operating costs via revenue, which makes them the leader in terms of cost recovery. This is down from 75.2% in 2020, but up slightly from 74.4% in 2020 and 73.4% in 2019.
Camps were among the most likely in 2022 to report that they had taken action over the past year to reduce their operating costs. Some 90.3% of camp respondents said they had taken such action, compared with 83.2% of non-camp respondents. This is down slightly from 2021, when 91.8% of camp respondents had acted to reduce their costs. The most common actions camp respondents had taken to reduce their costs include: increasing fees (74.2%), putting construction or renovation plans on hold (38.7%), reducing staff (37.1%), improving energy efficiency (32.3%), and cutting programs and services (22.6%).
Camp Facilities
As has been the case for the past couple of years, camp respondents were the most likely to report that they had plans for construction over the next three years. In fact, more than nine out of 10 (92.1%) camp respondents said they had construction plans, compared with 67.8% of non-camp respondents. This is up from 77% in 2021. Two-thirds (66.7%) of camp respondents said they had plans for renovations to their existing facilities, while 44.4% had plans for additions and 44.4% had plans for new construction.
On average, camp respondents were planning to spend $1,410,000 on their construction plans, a 39.6% increase from 2021, when they were planning to spend $1,010,000.
The 10 features most commonly included at camp respondents' facilities include: walking and hiking trails, open spaces and natural areas, park shelters, playgrounds, Wi-Fi services, outdoor courts for sports like basketball or tennis, campgrounds, challenge courses and ropes courses, park restroom structures, and waterfronts and marinas.
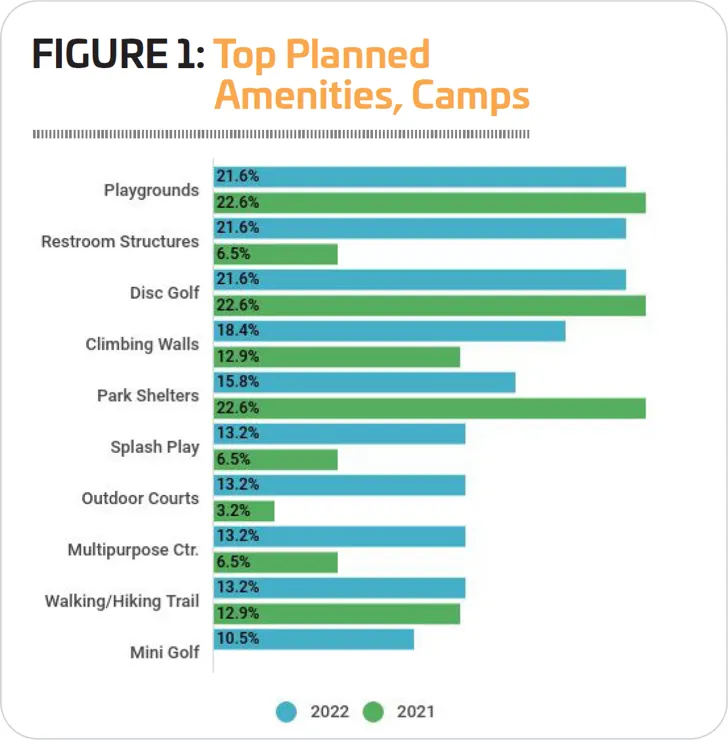
Camp respondents were much more likely than their peers from other types of facilities to indicate that they were planning to add more features at their facilities over the next several years. Some 60.3% of camp respondents said they had such plans (up from 41.9% in 2021), compared with just 36.4% of non-camp respondents.
The most commonly planned additions for campgrounds can be seen in Figure 1.