


A Look at Trends in Sports & Recreation Centers
Community and private recreation and sports centers were represented by 9.9% of the respondents to the Industry Report survey. Nearly seven out of 10 (69.6%) were with private facilities. Some 37.5% of rec center respondents were with private, nonprofit facilities, and 32.1% were with private, for-profit facilities. Another 28.6% said they were with public or governmental facilities.
Rec center respondents were most likely to be from the Midwest, with 30.4% of these respondents indicating that they make their home in that region. A little less than one-quarter were from the Northeast (23.2%) and the same number of respondents were from the West (23.2%). Smaller numbers of rec center respondents represented the South Central region (12.5%) or the South Atlantic region (10.7%).
Well over half (55.4%) of rec center respondents reported that they were located in suburban communities. Another 23.2% were from rural communities, and 21.4% were located in urban areas.
Rec center respondents were just slightly more likely than others to report that they had partnered with other organizations. Some 83.3% of rec center respondents said they had formed such partnerships, down from 85.8% in 2021. This compares with 82.5% of non-rec-center respondents who said they had formed partnerships in 2022. The most common partners for rec and sports centers were: local schools (57.4% of rec center respondents had partnered with schools), nonprofit organizations (55.6%), local government (50%), corporate or local businesses (33.3%), and colleges and universities (31.5%).
Revenues & Expenditures
After more than seven in 10 (71.1%) of rec center respondents reported a decline in revenues from 2019 to 2020, this year saw a turnaround, with 60% of rec center respondents indicating their revenues had increased from 2020 to 2021. Another 20% reported no change in revenues for 2021, while 20% reported a decrease.
In 2022, 63% of rec center respondents said they expect their revenues to increase, while 31.5% expect no change, and 5.6% are anticipating a decline. And in 2023, around half (49.1%) are expecting revenues to increase, while another 47.3% expect revenues to remain the same, and 3.6% expect a decrease.
Rec center respondents reported a 15.6% decrease to their average operating cost in 2021, down from $1,350,000 in 2020 to an average of $1,140,000. Looking ahead, they projected an increase of 7% from 2021 to 2022, to an average cost of $1,220,000, and a further 6.6% increase in 2023, to an average of $1,300,000.
On average, rec center respondents said they recover 64% of their operating costs via revenues, up from 56% in 2021 and 51.1% in 2020.
Nearly eight out of 10 (79.2%) of rec center respondents reported that they had taken action to reduce their expenditures over the past year, down from 95.6% in 2021, but in line with 2020, when 79.8% had taken such action. The most common measures rec centers had deployed to reduce their operating costs include: reducing staff (39.6%), reducing hours of operation (39.6%), increasing fees (39.6%), improving energy efficiency (28.3%), and cutting programs or services (22.6%).
Rec Center Facilities
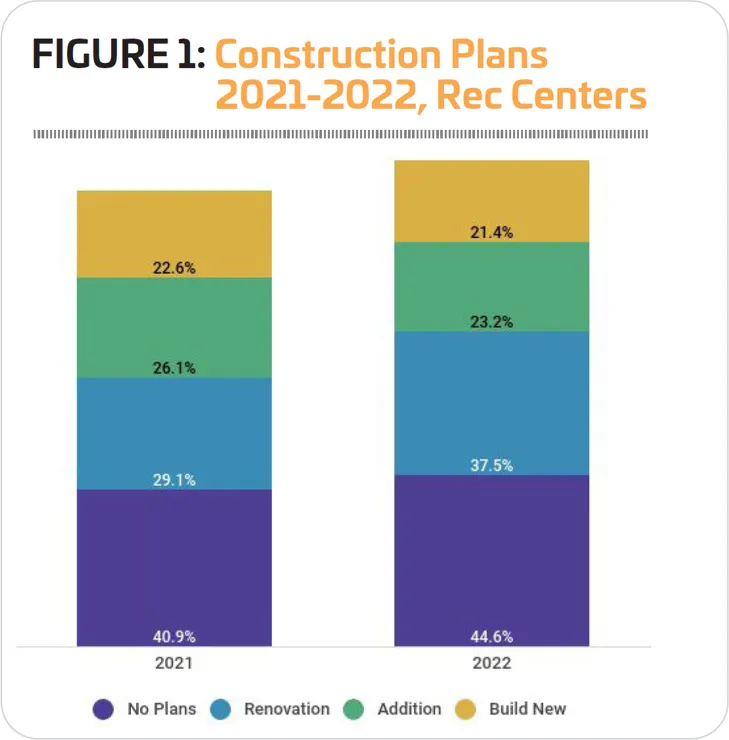
Some 55.4% of rec center respondents in 2022 said they had plans for construction over the next few years, down from 59.1% in 2021 and 62.4% in 2020. Some 21.4% said they were planning to build new facilities, while 23.2% were planning additions and 37.5% were planning to renovate their existing facilities. (See Figure 1.)
On average, rec center respondents in 2022 were planning to spend $2,900,000 on their construction plans. This represents a 55% decrease from 2021, when they planned to spend an average of $6,450,000. The 10 features most commonly included at rec and sports center respondents' facilities include: fitness centers, locker rooms, Wi-Fi services, bleachers and seating, exercise studio rooms, classrooms and meeting rooms, concession areas, playgrounds, indoor courts for sports like basketball and volleyball, and natural turf sports fields.
A quarter (25%) of rec center respondents in 2022 said they had plans to add more features to their facilities over the next few years. This compares with 40.6% of non-rec-center respondents in 2022 and is down from 39.1% in 2021.
The most commonly planned additions were:
- Splash play areas
- Playgrounds
- Fitness trails and outdoor fitness equipment
- Synthetic turf sports fields
- Dog parks
- Disc golf courses
- Open spaces and natural areas
- Classrooms and meeting rooms
- Waking and hiking trails
- Community gardens