


In this web-exclusive addition to the State of the Industry Report, we’ll examine the responses to the survey from professionals working for camp facilities. Camp respondents comprised 5.6% of all survey respondents, with 4.2% working for youth or private camps, and 1.4% working for campgrounds or RV parks.
In 2026, the largest number of camp respondents—a little more than one-third (34%)—was from the Midwest. Around one-quarter (25.5%) were from the West, and more than one-fifth (21.3%) were from the South Atlantic region. Slightly fewer camp respondents were from the Northeast (17%), and the smallest number of camp respondents were from the South Central region (2.1%).
Not surprisingly, the greatest number of camp respondents—59.6%—said they were located in rural areas. Another 34% were located in suburban communities, and just 6.4% were located in urban communities.
The majority of camp respondents—70.2%—said they worked for private, nonprofit organizations. Another 17.5% said they worked with for-profit organizations, and just 8.8% said they were with public or governmental organizations.
Camp respondents in 2026 were much more likely to report that they had partnered with other organizations than in 2025. Some 82.4% of camp respondents in 2026 said they had partnered with other organizations, compared with just 64.9% in 2025. The most common partners for camps in 2026 were nonprofit organizations (68.6%), local schools (51%), corporations or local businesses (27.5%), and colleges and universities (23.5%).
Camp Facility Costs & Revenues
From 2010 to 2020, the average operating budget for camp facilities increased by 39.6%, from $955,000 in 2009-11 to $1.333 million in 2018-20, while the median increased by 13.7%, from $495,000 to $563,000. This shows that the biggest spenders increased their spending to a greater extent than those camp respondents who spent less on their operations.
From 2018-20 to 2024, mean spending actually decreased by 15.2%, from $1.333 million to $1.13 million, while median spending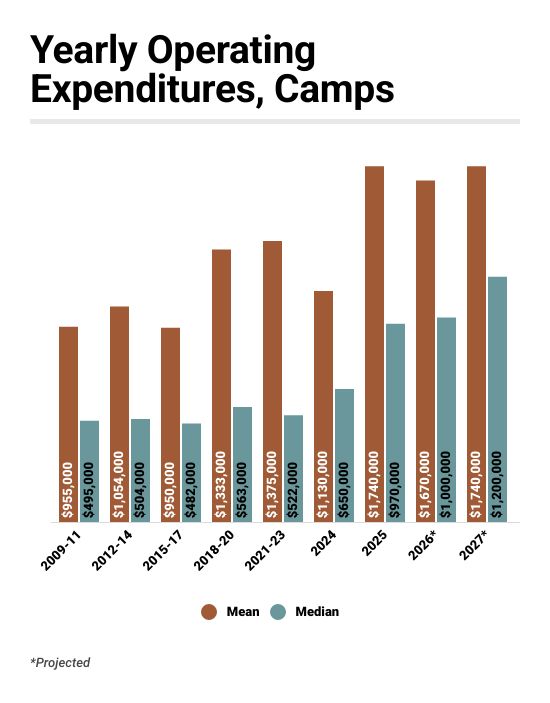 increased by 15.5%, from $563,000 to $650,000. This reflects increased spending at the lower end of the distribution.
From 2024 to 2025, mean operating costs for camp respondents increased 54%, from $1.13 million to $1.74 million, while median spending increased by 49.2%, from $650,000 to $970,000.
Looking forward, camp respondents are anticipating no change to their mean operating cost from 2025 to 2027, while the median is expected to increase by 23.7%, to $1.2 million, as lower spenders find themselves faced with higher costs, and the highest spenders hold their spending relatively steady.
Some 62% of camp respondents said their revenues for 2025 were higher than in 2024. Another 28% reported no change, and 10% said their revenues decreased from 2024 to 2025.
In 2026, 59.2% of camp respondents are expecting to see higher revenues, with 30.6% anticipating no change, and 10.2% expecting a decrease. And looking forward to 2027, 63.8% of camp respondents expect to see higher revenues, with 31.9% anticipating no change and 4.3% expecting revenues to fall.
Camp Facility Construction
More than three-quarters (76.5%) of camp respondents in 2026 said they had plans for construction over the next few years, down from 76.5% in 2025 and 85.4% in 2024. More than half (56.9%) said they planned to renovate their existing facilities, while 39.2% were planning additions, and 49% were planning new construction. The median construction budgets for camp respondents was $1.33 million, a dramatic increase over the median for 2025 of $500,000.
Nearly half (47.4%) of camp respondents said they had plans to add amenities to their facilities over the next few years, making camps the most likely to have such plans of all the cohorts covered by the survey.
The amenities camp respondents were most likely to be planning to add include:
- Playgrounds (23.1% of camp respondents with plans to add features said they would add playgrounds)
- Disc golf courses (23.1%)
- Challenge courses or ropes courses (19.2%)
- Park shelters (15.4%)
- Outdoor sports courts (15.4%)
- Park restroom structures (15.4%)
- Mini golf courses (15.4%)
- Bike trails (11.5%)
- Splash play areas (11.5%)
- Dog parks (11.5%)