


In this web-exclusive addition to the State of the Industry Report, we’ll take a closer look at responses from rec centers. Community and private recreation and sports centers, referenced in the Industry Report as “rec centers,” comprised 8.4% of all survey respondents. Some 6.4% of respondents said they worked for community recreation and sports centers, and 2.2% were with private recreation and sports centers.
In 2026, the largest number of rec center respondents—30.4%—were from the Western region of the U.S. Slightly fewer were from the Midwest (27.5%). Another 18.8% were located in the South Atlantic states, and 15.9% were in the Northeast. Just 5.8% of rec center respondents were located in the South Central region.
Rec center respondents were most likely to be located in suburban communities, with 59.4% indicating they were located in the suburbs. The remaining rec center respondents were evenly split between urban communities (20.3%) and rural areas (20.3%).
Rec center respondents were most likely to report that they worked with public or government organizations, with 55.2% indicating this was the case. Another 27.6% of rec center respondents work for nonprofits, and 14.9% said they were with for-profit organizations.
Rec center respondents in 2026 were slightly more likely to report that they had partnered with other organizations. Some 85.9% of rec center respondents said they had partnered, up from 82.1% in 2025. The most common partners for rec centers in 2026 were local schools (61.5%), nonprofits (59%), local government (53.8%), corporations or local businesses (35.9%) and colleges and universities (34.6%).
Rec Center Costs & Revenues
From 2010 to 2020, the average operating budget for rec centers increased by 22.8%, from $1.116 million in 2009-11 to $1.37 million in 2018-20, while the median increased by just 0.4%, from $465,000 to $467,000. From 2018-20 to 2024, mean spending increased by 52.6%, likely reflecting a change to the survey instrument. In that same time period, median spending increased by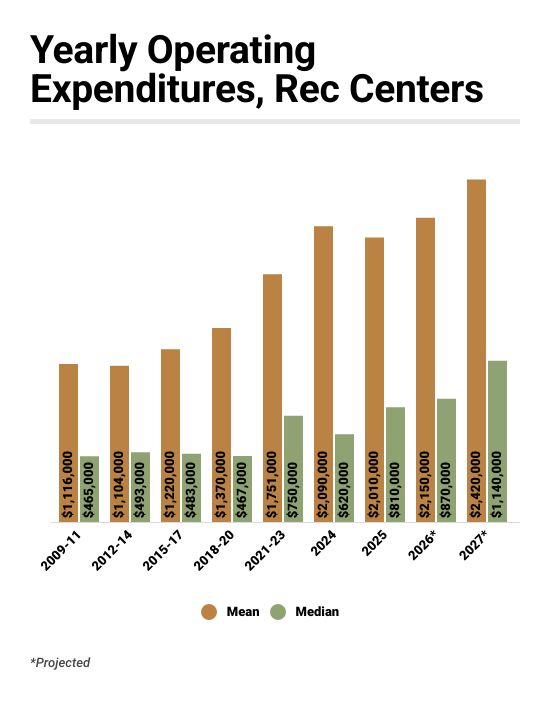 32.8%, from $467,000 to $620,000.
From 2024 to 2025, mean operating costs for rec center respondents actually decreased by 3.8%, from $2.09 million to $2.01 million. At the same time, median spending increased by 30.6%, from $620,000 to $810,000.
Looking forward, rec center respondents are anticipating a 20.4% increase to their mean operating cost from $2.01 million in 2025 to $2.42 million in 2027. At the same time, median spending is expected to increase 40.7%, from $810,000 to $1.14 million.
Well over half (57.3%) of rec center respondents said their revenues for 2025 were higher than in 2024. Another 32% reported no change, and 10.7% said their revenues decreased from 2024 to 2025.
In 2026, 68% of rec center respondents are expecting to see higher revenues, with 26.7% anticipating no change, and 5.3% expecting revenues to decrease. And looking forward to 2027, 58.3% of rec center respondents expect to see higher revenues, with 36.1% expecting revenues to remain the same, and 5.6% anticipating a decrease.
Rec Center Facility Construction
Around two-thirds (66.2%) of rec center respondents in 2026 said they had plans for construction over the next few years, down from 67% in 2025 but still higher than the 60.2% who were planning construction in 2024. The median construction budget for rec center respondents in 2026 was $1.42 million, up from $960,000 in 2025.
Some 31% of rec center respondents in 2026 said they had plans to add amenities at their facilities over the next few years, up from 29.8% in 2025.
The amenities rec center respondents were most likely to be planning to add included:
- Splash play areas (22.2% of rec center respondents with plans to add features said they would add splash play)
- Outdoor fitness equipment or fitness trails (18.5%)
- Dog parks (14.8%)
- Synthetic turf sports fields (11.1%)
- Outdoor sports courts (11.1%)
- Park restroom structures (11.1%)
- Concession areas (11.1%)
- Community gardens (11.1%)
- Playgrounds (7.4%)
- Fitness centers (7.4%)