
Welcome to the 20th Annual State of the Industry Report. Since 2007 we’ve been providing this annual examination of the responses to a hefty 50-question survey about recreation, sports and fitness facilities covering everything from funding, building and outfitting facilities to staffing up, programming and more. For this year’s report, we’ll expand the data in many relevant areas to take a look at how trends have changed over the 20 years we’ve been collecting this information.
Over these two decades, we’ve collected nearly 34,000 responses, averaging close to 1,700 a year. This year, we received 1,016 responses, and we sum them up here, beginning with a general breakdown of the distinct types of facilities covered, organization types, regional information, age groups served, typical numbers of users and more. From there we’ll move on to budgets and revenues, membership and facility usage, staffing trends, construction and amenities, programming and top challenges.
The sections that follow will cover information provided by specific cohorts within the survey population, starting with those whose facilities include aquatic elements such as swimming pools, splash play areas and waterparks, beginning on page 42. Additional sections cover the response from parks and recreation departments and districts (page 60), colleges and universities (page 72), schools and school districts (page 78), health clubs, racquet clubs and fitness-related facilities (page 84), and finally, nonprofit, multipurpose facilities like YMCAs, JCCs, and Boys & Girls Clubs (page 90). We expand the coverage even further online, with web-exclusive features covering the trends as reported by camps and campgrounds, as well as community and private sports and recreation centers.
It’s dense and it’s intense, and if you enjoy getting your information from the spoken rather than the written word, or if you just want a little more perspective on the data, we’ve got you covered there too! For the first time, we’ll be examining the Industry Report data in our educational webinar series. You can join me on June 18 when I’ll be discussing some of the information gathered here with Aquatic Design Group Principal and CEO Justin Caron and RDG Planning & Design Principal Scott Crawford. (Head to RecManagement.com/webinars to register, and let’s get a conversation going!)
About the Respondents
As always, we’ll begin with a closer look at the more than 1,000 folks who responded to our lengthy survey. (If you’re one of those respondents, thank you for taking the time!)
We’ll go into more detail on respondents’ career experience in next month’s Annual Salary Survey, but let’s start by talking about their professional roles. As usual, the greatest number of respondents—41.1%—hold the title of director. Another 16.1% hold operations and facility management positions, which includes operations managers, facilities managers, building managers and supervisors. Some 15.7% of respondents said they are in administration and management positions, which include administrators, managers and superintendents. Slightly fewer—13.3%—hold the title of chairman, CEO, president, vice president or owner of their organization or company. Some 8.5% of respondents are in program and activity administration roles, which includes activity and program directors, managers, coordinators, specialists, coaches and instructors. Just 1% of respondents said they are faculty or teachers, and 0.3% are in planning roles, including architects, designers and consultants. Finally, 4.1% of respondents hold other job titles not covered by the survey.
On average, respondents have been working in the recreation, sports and fitness industry for 23.9 years, with an average span of 12.2 years in their current roles.
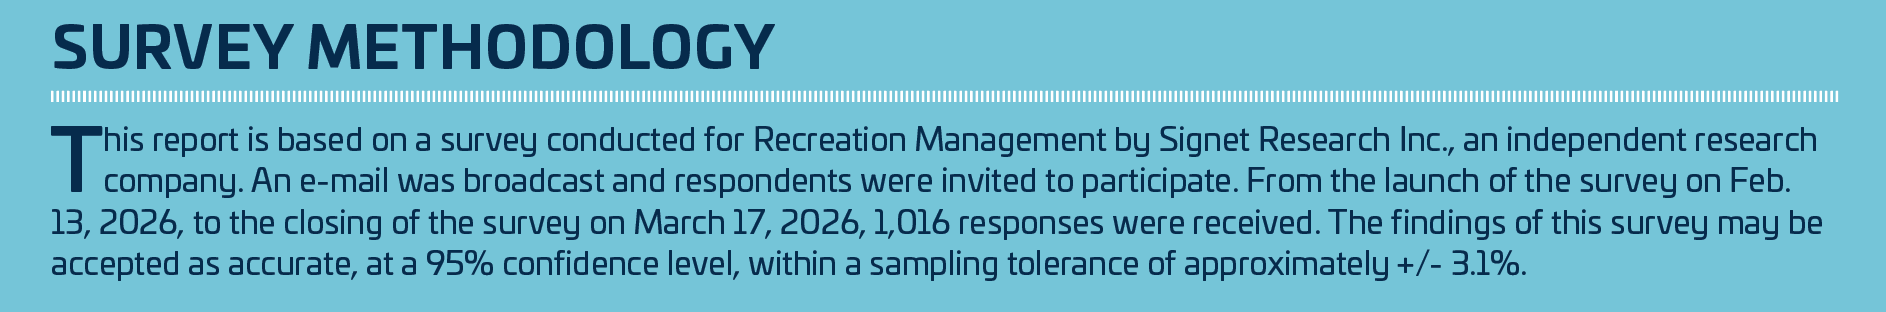
Over the past 20 years, regional response has remained relatively consistent, with the Midwest continuously representing the largest number of res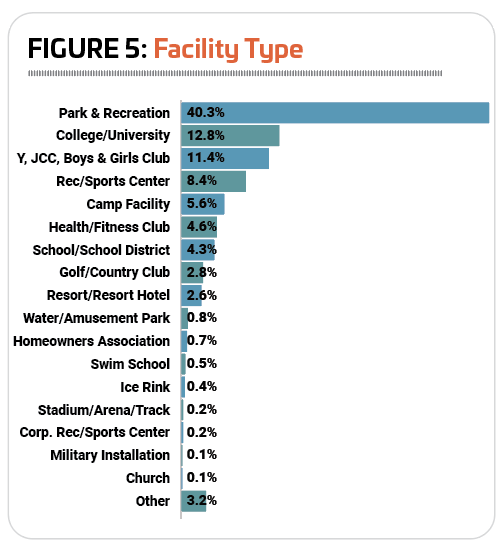 pondents, and the South Central region continuously representing the smallest.
2026 continued the trend, with around three out of 10 respondents (30.2%, hewing closely to the 20-year average of 30.3%) reporting from the Midwest, including Illinois, Indiana, Iowa, Kansas, Michigan, Minnesota, Missouri, Nebraska, North Dakota, Ohio, South Dakota or Wisconsin. (See Figure 1.)
They were followed by the West, which was home to 22.1% of respondents, again holding close to the 20-year average of 21%. This includes Alaska, Arizona, California, Colorado, Hawaii, Idaho, Montana, Nevada, New Mexico, Oregon, Utah, Washington and Wyoming.
The Northeast saw no change from 2025 to 2026, with 19.6% of respondents calling the states of Connecticut, Maine, Massachusetts, New Hampshire, New Jersey, New York, Pennsylvania, Rhode Island or Vermont home. This is slightly higher than the 20-year average of 17.6%.
The South Atlantic likewise saw little change with 17.2% of respondents indicating they are from Delaware, Florida, Georgia, Maryland, North Carolina, South Carolina, Virginia, Washington, D.C., or West Virginia. This compares with a 20-year average of 17.8%.
Finally, as always, the South Central region is represented by the smallest number of respondents at 10.8%. This includes Alabama, Arkansas, Kentucky, Louisiana, Mississippi, Oklahoma, Tennessee and Texas, and is slightly below the 20-year average of 12.8%.
 A single respondent in 2026 said they were from outside the U.S.
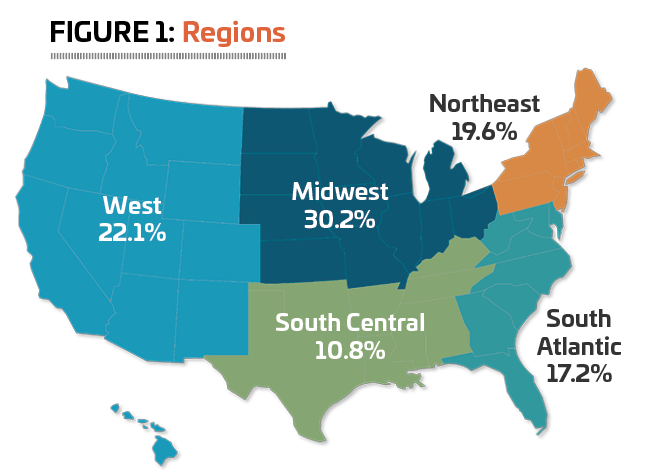
Response to the survey in 2026 was more heavily weighted toward suburban communities than in any previous year of the survey. Nearly half (49%) of respondents in 2026 said they were from the suburbs. Just over a third (34%) were from rural communities, and 21.3% were from urban communities. (See Figure 2.)
Respondents in 2026 said they reached an average of 121,150 patrons annually, up from 117,630 in 2025. Respondents from parks and colleges had the largest average number of patrons, at 183,810 and 101,880, respectively. They were followed by rec centers, with an average of 97,830, and Ys at 90,370. Camps (28,100) and schools (45,060) had the smallest number of patrons annually. (See Figure 3.)
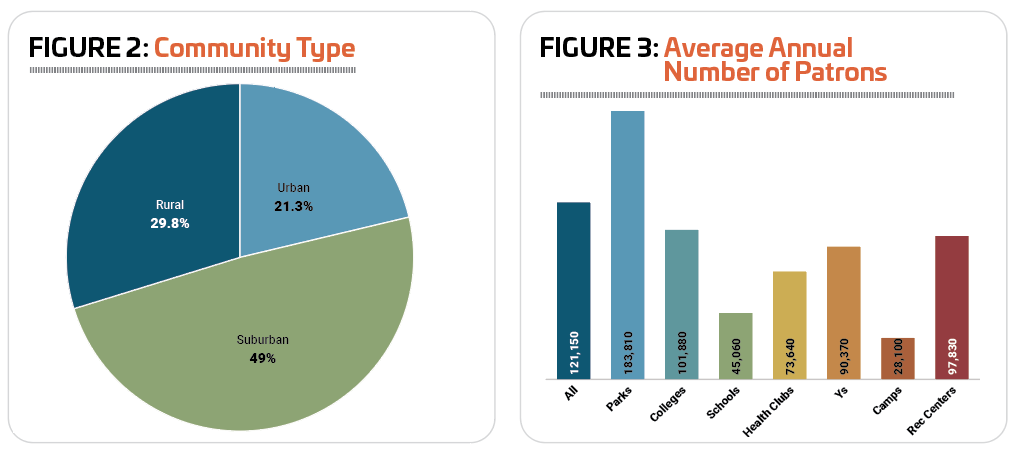
Around 58.1% of respondents in 2026 were with public or governmental organizations, about the same as in 2025 (58.5%), but well below the 20-year average of 64.9%. The next largest number of respondents were with private nonprofit organizations, 27.2%, down just slightly from 28.2% in 2025, and well above the 20-year average of 21.6%. Another 13.4% of respondents were with private for-profit organizations, up from 12.3% and slightly higher than the 20-year average of 12%. Finally, 1.4% of respondents said they were with “other” types of organizations. (See Figure 4.)
 The largest number of respondents to the survey were from park districts and departments, as usual. Some 40.3% of respondents said they were with parks. The next largest group of respondents were from colleges and universities (12.8%); YMCAs, YWCAs, JCCs, Boys & Girls Clubs and similar facilities (11.4%); community and private recreation and sports centers (8.4%); camp facilities, which includes private or youth camps, as well as campgrounds and RV parks (5.6%); health and fitness clubs, racquet clubs and medical fitness facilities (4.6%); and schools and school districts (4.3%). (See Figure 5.)
Smaller numbers of respondents reported from other types of facilities, including golf and country clubs (2.8%), resorts and resort hotels (2.6%), waterparks and amusement parks (0.8%), homeowners associations (0.7%), swim schools (0.5%), ice rinks (0.4%), stadiums, arenas and tracks (0.2%), corporate recreation and sports centers (0.2%), military installations (0.1%), and churches (0.1%). Finally, 3.2% of respondents were from “other” types of facilities, including childcare, a marina, a fairground, a beach and a bowling center, among others.
Respondents from parks, schools and colleges were most likely to be with public or governmental organizations. Some 97.8% of park respondents, 68.2% of school respondents and 61.5% of college respondents said their organizations were public. Rec centers (55.2%) were also more likely than not to be public or governmental organizations.
 The health club cohort, which also includes racquet clubs and medical fitness facilities, was more likely than any other group of respondents to be working with private, for-profit organizations. Some 63.8% of health club respondents said they operated as for-profit organizations.
Respondents from Ys and camps were the most likely to report that they worked for nonprofit organizations. Some 96.6% of Y respondents (a cohort that also includes JCCs, and Boys & Girls Clubs) said they were with nonprofit organizations, and 70.2% of camp facility respondents said they were with nonprofits.
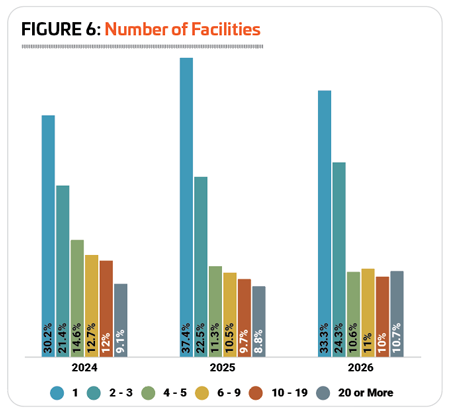
On average, respondents said they manage 7.4 individual facilities, down from 8.5 in 2025, but very closely in line with the 20-year average of 7.1. One-third (33.3%) of respondents said that they manage just a single facility, down from 37.4% in 2025, and 24.3% said they manage two or three individual facilities, up from 22.5%. The remainder of survey respondents in 2026 were fairly evenly divided between the remaining categories, with 10.6% managing between four and five facilities (down from 11.3%), 11% managing between six and nine facilities (up from 10.5%), 10% managing 10 to 19 facilities (up slightly from 9.7%), and 10.7% managing 20 or more individual facilities (up from 8.8% in 2025). (See Figure 6.)
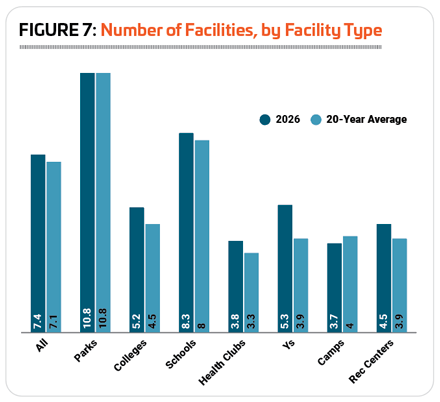
 Respondents from parks and schools had the greatest number of facilities to manage, averaging 10.8 and 8.3 facilities respectively in 2026. This falls closely in line with the 20-year averages for parks and schools of 10.8 and 8, respectively. Ys, colleges and rec centers fell in the middle, managing an average of 5.3 individual facilities (Ys), 5.2 (colleges) and 4.5 (rec centers). Here there was more deviation from the 20-year average, though it was slight. Finally, respondents from camps and health clubs had the smallest number of facilities to manage, with an average of 3.7 for camps and 3.8 for health clubs, which compares with 20-year averages of 4 and 3.3, respectively. (See Figure 7.)
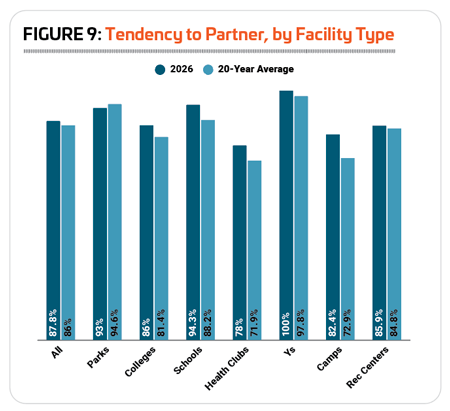
Since the Industry Report was launched in 2007, we have been reporting on the prevalence of partnerships for recreation, sports and fitness facilities. Such partnerships can expand programming opportunities, extend budgets and offer access to amenities and other offerings for community members. In 2026, 87.8% of respondents said they had formed such partnerships with other organizations, close to the highs reported from 2019 to 2021 (the highest rate of partnership, 89%, occurred in 2020), and a bit higher than the 20-year average of 86%.
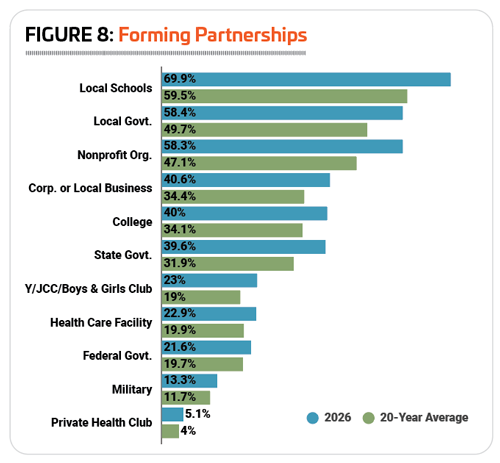
 Respondents in 2026 were more likely than the 20-year average to partner with every single type of organization covered by the survey. As always, local schools were the most common type of partner, with nearly seven in 10 (69.9%) respondents indicating that they had partnered with schools. This is up substantially from 2025 (60%), and is more than 10 percentage points higher than the 20-year average (59.5%). The next most common types of partners included: local government (58.4%, up from 51.5% in 2025 and well above the 20-year average of 49.7%); nonprofit organizations (58.3%, up from 48.5% in 2025, and again much higher than the 20-year average of 47.1%); corporations or local businesses (40.6%, up from 33% in 2025, as well as the 20-year average of 34.4%); and colleges and universities (40%, up from 36.3% in 2025, and above the 20-year average of 34.1%). (See Figure 8.)
In fact, the past decade has shown an increasing tendency to partner, with the 2017-2026 average beating the 2007-2016 average in almost every case. The greatest increases were for those partnering with nonprofit organizations, up 6.2 points from an average of 44% for 2007-2016 to 50.2% for 2017-2026. Local schools saw a 4.5-point jump, from 57.2% to 61.7%, and local government saw an increase of 4.1 percentage points, from 47.7% to 51.8%. The only types of partners that were less common from 2017 to 2026 than from 2007 to 2016 saw extremely modest decreases: the federal government, which was down 0.5 points, and private health clubs, down 0.8 points.
 Respondents from Ys, schools and parks were the most likely to report that they had partnered with other organizations. A full 100% of respondents from Ys, as well as 94.3% from schools and 93% from parks said they had formed such partnerships. Respondents from health clubs were the least likely to form partnerships, though most (78%) had done so.
All types of respondents other than parks were more likely to indicate that they have partnered with other organizations in 2026 than the average for the past 20 years. The biggest departure from the 20-year average was found among respondents from camps. Though they were still among the least likely to report in 2026 that they had formed partnerships with other organizations, 82.4% of camp respondents had done so, 9.1 percentage points higher than the 20-year average for camps, 72.9%. Schools and health clubs both gained 6.1 percentage points over the 20-year average in 2026, with 94.3% of schools reporting they had partnered (compared with a 20-year average of 88.2%), and health clubs’ 78% rate for 2026 outpacing the 20-year average of 71.9%. (See Figure 9.)
 The takeaway? Respondents in 2026, other than those from parks, were more likely to form partnerships than usual—some much more likely. And organizations that are partners—nonprofits, local schools, local government, and corporate and local businesses, in particular—were more likely to be a part of such partnerships.
Given that they are the most likely to partner with other organizations, it comes as no surprise that Y respondents are most likely to partner with almost all of the different types of partners covered by the survey. Y respondents were the most likely to partner with nonprofit organizations (90.2% of Y respondents had partnered with nonprofits), local schools (89.1%), local government (70.7%), other YMCAs (69.5%), corporations and local businesses (62.2%), state government (61%), healthcare or medical facilities (51.2%), the military (40.2%), and the federal government (35.4%).
The only exceptions were colleges and private health clubs. College respondents were the most likely to partner with other colleges and universities (68%), and health club respondents were the most likely to partner with private health clubs (19.5%).
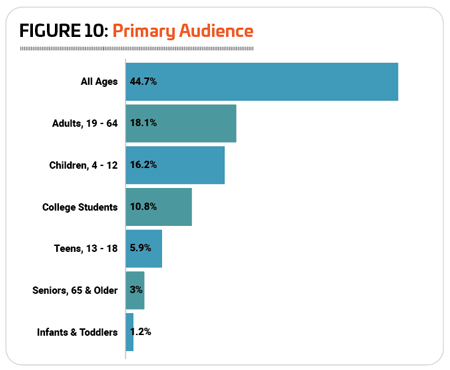
 Asked about the typical age range that their facilities reach, respondents were, as always, most likely to report that they reach all ages, with 44.7% indicating that they have an audience that does not feature any particular age group. Since we started asking respondents about their facilities’ typical age group in 2012, the number reaching all ages has fluctuated between a low of 36.1% in 2022 to a high of 48.2% in 2024.
The next most common ages reached by respondents were adults 18 and up, as well as children ages 4 to 12. Some 18.1% of respondents in 2026 said they primarily served adults, while 16.2% primarily reached children. As with the all-ages group, these numbers haven’t changed much over time. Respondents who typically reach adults saw a high of 19.3% in 2022 and a low of 15% in 2019 and 2025, while those who primarily reach children saw a high of 20.2% in 2022 and a low of 14.9% in 2024.
Smaller numbers of respondents in 2026 reached other audiences, including college students (10.8%), teens (5.9%), seniors (3%) or infants and toddlers (1.2%). (See Figure 10.)
Typical age groups vary a great deal from one type of facility to the next. Respondents from parks and Ys were the most likely to report that they reached all ages. Some 60.6% of park respondents and 60.2% of Y respondents said their primary audience was made up of all ages. Other audiences were most typically served by different types of facilities. Children were most likely to be the primary audience for camp respondents (33.3% of camp respondents said they primarily reach children), adults were most likely to be the primary audience for health clubs (59.1%), college students were most likely to be the primary audience for colleges and universities (79.2%), teens were most likely to be the primary audience for schools (52.8%), and seniors were most likely to be the primary audience for rec centers (12.7%).
 Getting & Spending
More than half (50.2%) of respondents to the 2026 Industry Report survey said that their revenues grew from 2024 to 2025. Another 40.6% reported no change, and 9.2% reported a decrease in revenues. This reflects a slight increase in the number of respondents reporting growing revenues from 2024, when 48.5% reported an increase.
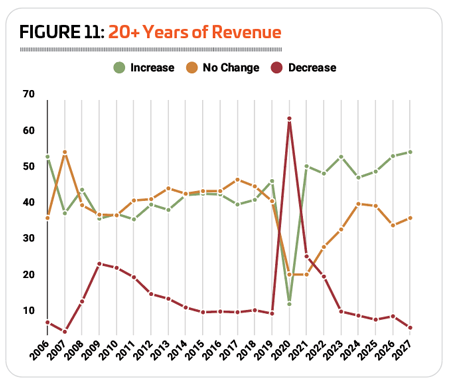
When you compare post-pandemic years to pre-pandemic years, respondents are generally more likely to report that their revenues are increasing. (See Figure 11.)
For each year from 2006 to 2019, an average of 42.4% of respondents to Industry Report surveys reported increasing revenues, with 43.6% reporting no change and 14% reporting decreases. Of course, with pandemic-related closures, most facilities saw their revenues drop in 2020, with 2021 showing mixed results as the pandemic continued to affect operations. For each year from 2022 to 2025, more than half (50.7%) of respondents, on average, reported that their revenues increased year over year. Another 36.3% on average saw no change, while 13% reported a decrease.
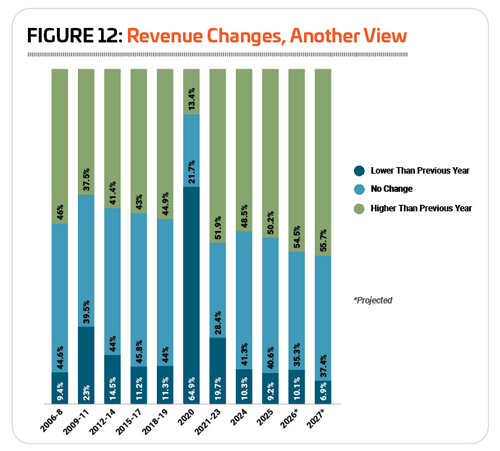
 In another view of the data, broken largely into three-year increments, one can see that the impact of the Great Recession (2009 to 2011) was much smaller than the impact of the COVID-19 pandemic (2020 and 2021, broken out separately here). (See Figure 12.) The year 2009 was the worst year of the recession, in terms of revenues, with 24.6% of respondents indicating their revenues had declined. But that was a relatively unremarkable finding when compared with 2020, when nearly two-thirds (64.9%) of respondents said their revenues had declined. The period of 2021 to 2023 shows revenues returning to normal after that dramatic impact, with 2024 and 2025 largely looking much more stable.
Looking forward, respondents to the 2026 Industry Report survey are expecting revenues to continue their rise, with 54.5% expecting an increase in 2026 and 55.7% expecting an increase in 2027. The question is, are the revenue increases enough to cover operating costs, which are also on the upswing.
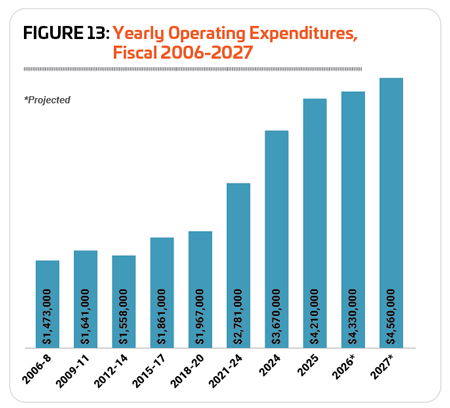
Respondents to the 2026 Industry Report survey reported an increase of 14.7% to their average operating expenditure from 2024 to 2025, from $3.67 million to $4.21 million, outpacing inflation, which was 2.63% from the 2024 average to the 2025 average. It represents a 185.9% increase from the average reported for the first three years of the Industry Report (2006 to 2008), $1.473 million. However, the survey instrument was changed slightly in 2023 and again in 2025, which has led to higher overall average numbers in the post-pandemic period. (See Figure 13.)
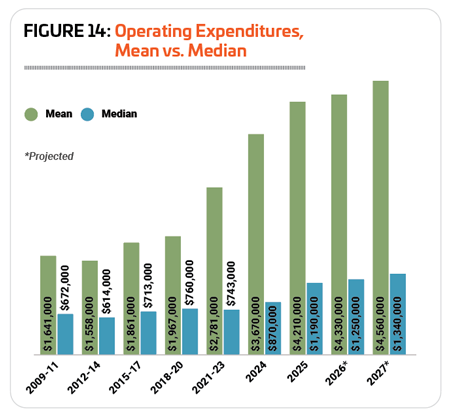
 For this reason, it is helpful to compare the median numbers reported, with data going back to the year 2009. (Editor’s Note: Remember, the median number is the number that falls in the exact middle of a set of data that is ordered from lowest to highest. Median numbers are also useful when high highs skew the results, as with income or home prices, i.e., median U.S. household income in 2024 was $83,730, while the average, or mean, was $121,000.)
When considering the median numbers, we also see operating costs outpacing inflation. From 2009 to 2025, the median operating cost for respondents increased by 69%, from $704,000 to $1.19 million, beating inflation for the period, which was 50.06%. Even in the more recent years covered by the survey, operating costs are rising faster than can be accounted for by inflation alone. The median reported for 2024, $870,000, would be just about $893,000 in 2025 dollars. (See Figure 14.)
Looking forward, respondents to the 2026 survey are expecting the operating costs to continue to rise this year and next. They projected a 2.9% increase from 2025 to 2026, from an average of $4.21 million to $4.33 million—with the median increasing at a faster 5% clip from $1.19 million in 2025 to $1.25 million in 2026. A further 5.3% increase to the average is expected in 2027, to $4.56 million, with the median increasing 7.2%, to $1.34 million.
 The takeaway? Respondents to the Industry Report survey mostly report rising (or at least stable) revenues over the past 20 years, while operating costs have outpaced inflation, and they expect that trend to continue.
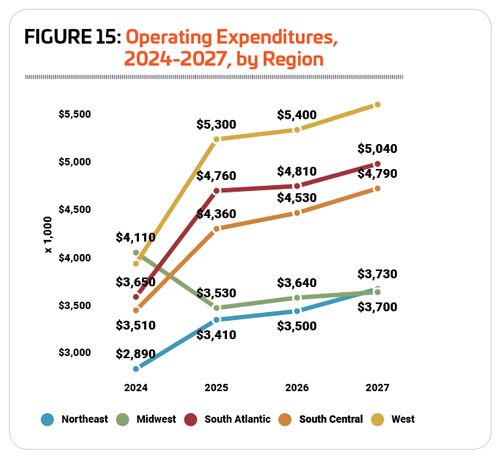
From 2024 to 2025, respondents from the Western region reported the steepest increase in operating costs, with their average rising 32.5% from $4 million in 2024 to $5.3 million in 2025. They were followed by respondents in the South Atlantic, who reported a 30.4% increase from $3.65 million to $4.76 million, and those in the South Central states, whose average operating cost increased by 24.2%, from $3.51 million to $4.36 million. Respondents in the Northeast reported the smallest increase, with their average operating cost rising 18% from $2.89 million in 2024 to $3.41 million in 2025. And respondents in the Midwest actually reported a decrease for the second year in a row, with their average cost falling 14.1%, from $4.11 million in 2024 to $3.53 million in 2025. (See Figure 15.)
Looking forward, respondents from the South Central and Northeastern states are expecting their operating costs to increase the fastest. From 2025 to 2026, South Central respondents are anticipating a 9.9% increase in their average operating expense, to $4.79 million, while Northeastern respondents are expecting a 9.4% increase, to $3.73 million. Western respondents are expecting their average operating cost to increase by 7% to $5.67 million, with respondents from the South Atlantic states expecting a 5.9% increase, to $5.04 million. Midwestern respondents were anticipating the smallest increase, projecting that their average operating cost would increase by 4.8% to reach $3.7 million in 2027.
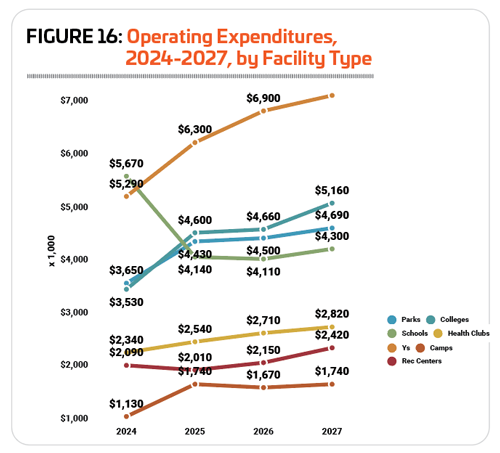
 Broken down by facility type, respondents from camps and colleges reported the greatest increase to their average operating expenditures from 2024 to 2025, while those from schools and rec centers actually recorded a decrease. Camp respondents reported a 54% increase to their average operating expense, from $1.13 million in 2024 to $1.74 million in 2025, while college respondents reported a 30.3% increase, from $3.53 million to $4.6 million. Smaller increases were reported by respondents from parks (up 21.4%, from $3.65 million to $4.43 million), Ys (up 19.1%, from $5.29 million to $6.3 million) and health clubs (up 8.5%, from $2.34 million to $2.54 million). Respondents from rec centers reported a 3.8% decrease to their average operating expenditure, from $2.09 million in 2024 to $2.01 million in 2025; while school respondents’ average was down 27%, from $5.67 million to $4.14million. (See Figure 16.)
Looking forward, respondents from rec centers are anticipating the steepest increase in operating cost over the next two years, projecting a 20.4% increase from $2.01 million in 2025 to an average of $2.42 million in 2027. They were followed by Ys, who expect a 14.1% increase to an average of $7.19 million; colleges, up 12.2% to $5.16 million; health clubs, up 11% to $2.82 million; parks, up 5.9% to $4.69 million; and schools, up 3.9% to $4.3 million. Camp respondents are not expecting their operating costs to change between 2025 and 2027.
 On average, respondents in 2026 said that they recover 53.8% of their operating costs via revenues, representing virtually no change from 2025 (53.3%). That said, since we’ve been asking respondents about their cost recovery, beginning with the 2016 Industry Report survey, respondents seem to be recovering slightly more of their costs over time.
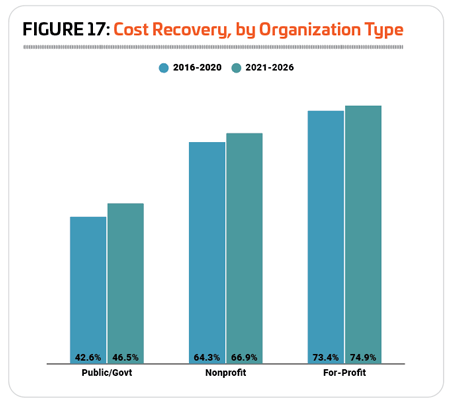
Looking at cost recovery trends for the different types of organizations, you can see that this trend holds for public/governmental organizations, for-profit organizations and nonprofits alike. From 2016 to 2020, public organizations recovered an average of 42.6% of their costs via revenues, while from 2021 to 2026 they recovered an average of 46.5% of their costs. For nonprofits, the 2016-to-2020 period showed a 64.3% cost recovery rate, compared with 66.9% for 2021 to 2026. For-profit organizations saw the least change, with a 73.4% average cost recovery rate from 2016 to 2020, and a 74.9% rate for 2021 to 2026. (See Figure 17.)
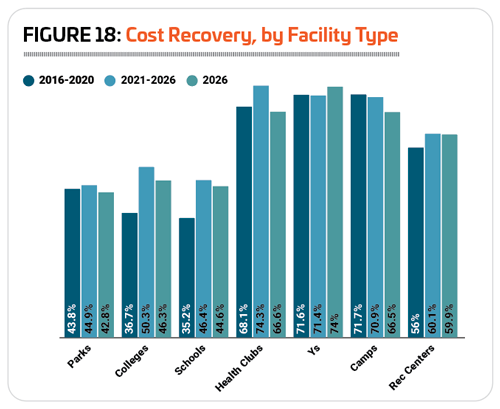
This trend largely holds true when you consider facility types as well, with the exception of Ys and camps, which saw very little change. Respondents from parks, colleges, schools, health clubs and rec centers all reported a slightly higher rate of cost recovery for 2021 to 2026 than they did for 2016 to 2020. That said, only Ys reported a higher average rate of cost recovery in 2026 than for the 2021-2026 average, 74% vs. 71.4%. (See Figure 18.)
 Like always, some facility types were more likely to recover a higher percentage of their costs via revenues than others. In 2026, rec centers (59.9%), camps (66.5%), health clubs (66.6%) and Ys (74%) all saw a higher rate of cost recovery than the average for all respondents of 53.8%. Respondents from parks (42.8%), schools (44.6%) and colleges (46.3%)—all more likely than others to be public or governmental organizations—recovered less than half of their costs via revenues.
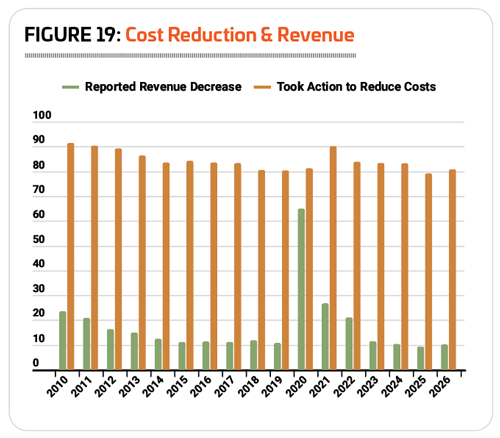
In every year since 2010, a substantial majority of respondents to the Industry Report survey report that they have taken action to reduce their operating costs, with those numbers reaching more than 90% twice—first in the wake of the Great Recession (91.4% in 2010 and 90.3% in 2011), and again during the COVID-19 pandemic (90.1% in 2021). (See Figure 19.)
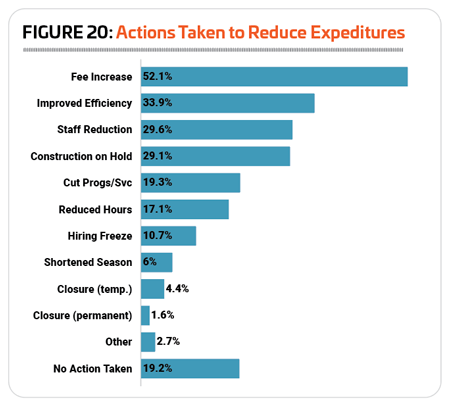
From 2010 to 2020, respondents were most likely to report that they had improved energy efficiency at their facilities in order to lower their operating costs, while in 2021 and 2022, they were most likely to cut staff to reduce costs. From 2023 to 2026, they were most likely to increase their fees in order to address rising costs at their facilities.
 In 2026, 80.8% of respondents reported that they had taken action to lower operating costs at their facilities, up from 79.1% in 2025. More than half (52.1%) said they had increased their fees in order to boost the bottom line, up from 51.6% in 2025, and 50.7% in 2024. Just over a third (33.9%) said they had improved energy efficiency, virtually unchanged from 33.8% in 2025, but down from 38.7% in 2024. Around three in 10 had made staff reductions (29.6% up from 26.5% in 2025), or put construction plans on hold (29.1%, up from 27.4%). And around one-fifth (19.3%) said that they had made cuts to programming and services, up from 17.7%. (See Figure 20.)
In 10 of the 17 years that we’ve been asking respondents about the actions they have taken to reduce their costs, respondents from Ys have been the most likely to do so, with 2026 being the 10th time they’ve led the pack. Some 86.4% of Y respondents in 2026 said that they had taken action to reduce their costs. They were followed by respondents from camps (85.4%), colleges (83.9%), health clubs (81.3%), and rec centers (81.1%). Parks (78.6%) and schools (75%) were the least likely to indicate that they had taken action to reduce their costs, though a majority had done so.
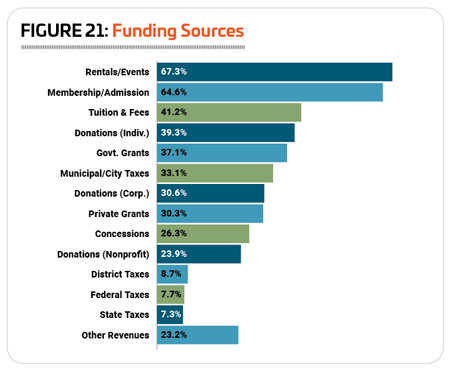
 We’ve been asking respondents about the various ways they fund their facilities since 2021, and in every year, the leading sources of funding are rentals and private events, as well as fees for membership or admission. In 2026, more than two-thirds (67.3%) of respondents said that they rely on rentals and private events (up from 61.4% in 2025), and nearly two-thirds (64.6%) get some of their funding from membership and admission fees (up from 59.4%) in 2025. More than one-third of respondents in 2026 received funding through tuition and fees (41.2%, up from 37.4% in 2025), private donations from individuals (39.3%, virtually unchanged from 39.4%), and government grants (37.1%, up from 35.1%). (See Figure 21.)
Over the 20 years of the Industry Report survey, an average of 60.1% of respondents charge a fee for membership or for using their facilities. In 2026, 64.7% of respondents report that they charge such a fee—the highest number recorded over the 20-year span of the report.
As always, Ys (100%) and health clubs (93.3%) were the most likely to charge a fee for membership or use of their facilities. They were followed by respondents from rec centers (74.7%), colleges (60%) and parks (59.7%). Less than half of respondents from schools (40%) and camps (39.2%) reported in 2026 that they charge a membership or facility usage fee.
 Traffic Trends
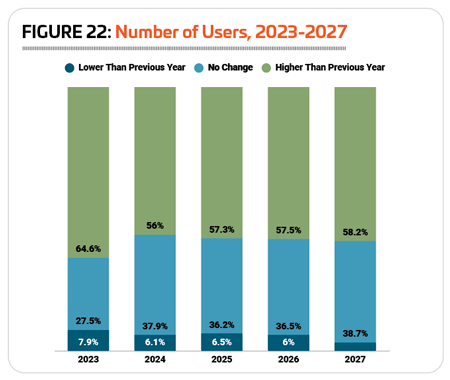
Since the pandemic, respondents have been more likely than before 2020 to indicate that the number of people using their facilities is on the rise. In 2021, 55.8% said they saw an increase in visitors to their facilities, and that number continued to climb through 2022 (60.4%) and 2023 (64.6%). In 2024, 56% reported an increase, while in 2025, 57.3% said the number of people using their facilities had increased. Prior to 2020, the highest number of respondents reporting that usage of their facilities had increased was 55.3%, and the average for all of the years from 2007 to 2019 was just 51.6%, compared to an average for 2021 to 2025 of 58.8%.
In 2025, just 6.5% of respondents said there was a decrease in the number of people using their facilities, while 36.2% reported no change.
Looking forward, 57.5% of respondents said they are expecting the number of people using their facilities to increase in 2026, and 58.2% expect an increase in 2027. (See Figure 22.)
 Respondents from Ys, camps and parks were the most likely to report that the number of people using their facilities increased from 2024 to 2025. Some 75.3% of Y respondents, 63.5% of camp respondents and 61.2% of park respondents said that usage of their facilities grew in 2025. More than half of respondents from rec centers (60.3%) and health clubs (51.2%) also reported increasing use of their facilities. Respondents from schools (29.4%) and colleges (42.9%) were the least likely to see increasing use of their facilities in 2025.
Looking forward, respondents from Ys and health clubs were the most likely to report that they expect to see usage of their facilities increase in 2026 and 2027. Some 73.1% of Y respondents expect an increase in 2026, and 66.7% expect an increase in 2027. And while 59.5% of health club respondents are expecting to see usage increase in 2026, 71.1% expect an increase in 2027.
Conversely, respondents from schools and colleges were the least likely to be expecting an increase in the number of people using their facilities in 2026 and 2027. Some 37.1% of schools are expecting an increase in 2026, while 41.2% expect an increase in 2027. And 47.6% of college respondents expect an increase in 2026, while 44.6% expect an increase in 2027.
 Providing Employment, From Full-Timers to Volunteers
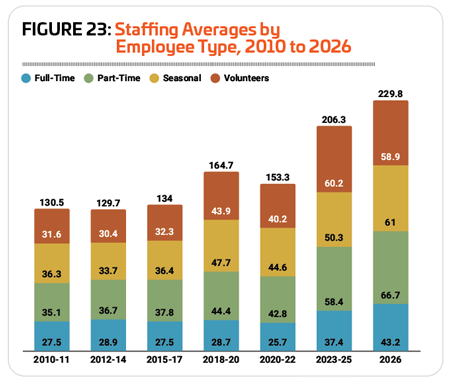
A view of the staffing averages of respondents to the Industry Report from 2010 to the current survey shows a significant increase beginning immediately following the COVID-19 pandemic. While the average changed little from 2010 to 2017, increasing just 2.7% from an average of 130.5 employees for the years 2010-11 to an average of 134 for the years 2015-17, it began climbing upward more rapidly in the following years, with a 22.9% increase from 2015-17 to 2018-20. Surveys from 2021 and 2022 reflect a slight downturn, not surprising, given the impact of the pandemic, before staffing averages surge upward at an even more rapid clip, with a 25.3% increase from the average for 2018-20 to an average of 206.3 for the years 2023-25. The average for respondents in 2026 is even higher, at 229.8, an 11.4% increase from the 2023-25 average. This includes an average of 43.2 full-time employees, 66.7 part-time employees, 61 seasonal employees and 58.9 volunteers. (See Figure 23.)
 Increases were seen for all types of employees from 2018-20 to 2023-25, but respondents added volunteers at the fastest clip, with 37.1% more volunteers working for respondents’ facilities in 2023-25 than 2018-20. Full-time and part-time staff increased at a similar rate over the same period, with 30.3% more full-time workers and 31.5% more part-time workers in 2023-25 than 2018-20. Seasonal workers saw the smallest increase, at 5.5%.
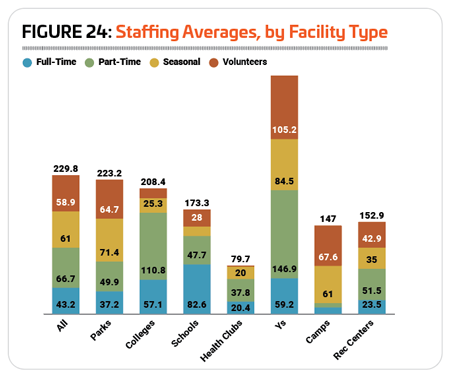
As usual, Ys employed the greatest number of people, with an average of 395.8 staff workers of all kinds. This includes an average of 59.2 full-time employees, 146.9 part-timers, 84.5 seasonal workers and 105.2 volunteers. They were followed by parks, with an average of 223.2 employees, and colleges, with an average of 208.4. As usual, health clubs had the smallest staffs, with an average of 79.7. (See Figure 24.)
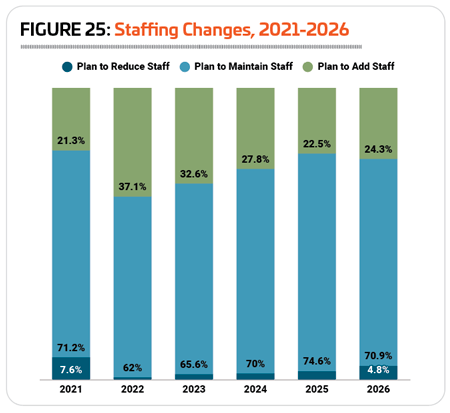
Respondents in 2026 were slightly less likely to indicate that they were planning to maintain existing staffing levels this year. Some 70.9% of respondents said they would maintain their current staffing levels, down from 74.6% in 2025. Respondents in 2026 were both more likely to indicate that they were planning to add staff (24.3%, vs. 22.5% in 2025) and that they were planning to cut staff (4.8%, vs. 3% in 2025). (See Figure 25.)
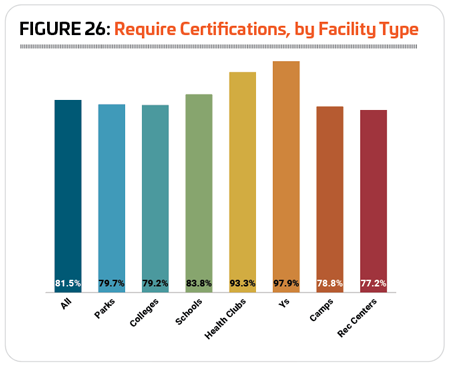
 A wide range of industry certifications help ensure that employees as well as organizational leaders have the knowledge and skills to do their jobs, and that they are staying on top of the most up-to-date practices and understanding in their respective fields. In 2026, 81.5% of respondents said that they currently require certification of some kind for at least some of their staff members, up slightly from 79.7% in 2025 and 78.7% in 2024.
Respondents from Ys and health clubs were the most likely to require certifications for some of their staff members. Some 97.9% of Y respondents said they currently require certifications, which is virtually the same as in 2025 (97.1%), and 93.3% of health club respondents in 2026 require certifications, up from 91.7% in 2025. They were followed by schools (83.8%, down from 89.9%), parks (79.7%, up from 74%), colleges (79.2%, down from 84.1%), and camps (78.8%, up from 77%). As in 2025, respondents from rec centers were the least likely to require certification for their staff members, though more than three-quarters (77.2%) did so, an increase from 68.4% in 2025. (See Figure 26.)
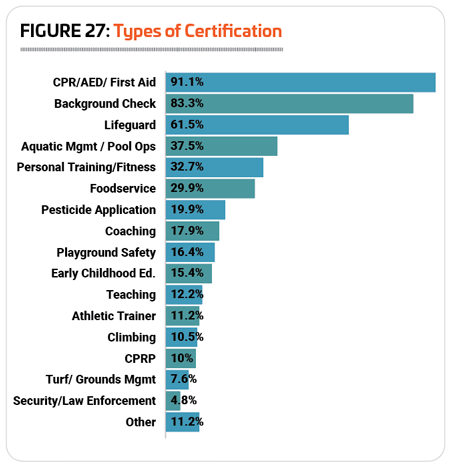
The most commonly required certifications remain consistent from year-to-year. As always, the most common is CPR/AED/First Aid training, with the majority—91.1% of respondents who require any certifications indicating that they require at least some staff members to be certified in CPR, AED use and First Aid, up slightly from 88.8% in 2025. Background checks are the next most common, at 83.3%, down from 84.4% in 2025. Lifeguard certification was the third most commonly required credential, with 61.5% of respondents employing certified lifeguards, up from 53.7% in 2025; while aquatic management certifications were required by 37.5%, up from 32.4% in 2025. (See Figure 27.)
 Being the most likely to require certification at all, it’s no surprise that Y respondents were also the most likely to require many different types of certifications, including CPR/AED/First Aid (97.9%), background checks (96.8%), lifeguard (76.6%), aquatic management (53.2%) and early childhood education (56.4%). Respondents from health clubs were the most likely to require personal training certifications (76.2%). Camp respondents were the most likely to require foodservice certification (75.6%) or climbing certification (34.1%). School respondents were the most likely to require teaching certification (43.3%) or coaching certification (36.7%). Parks were the most likely to require certification in pesticide application (36.2%), playground safety (32.8%), turf or grounds management (11.8%) or security/law enforcement (6.6%). Nearly one-fifth of parks (19.9%) also required the Certified Parks & Recreation Professional (CPRP) credential offered through the National Recreation and Park Association (NRPA). Finally, colleges were the most likely to require athletic trainer certification, with 27.4% of those who require any certification indicating that they looked to include certified athletic trainers among their staff.
 Facilities & Amenities
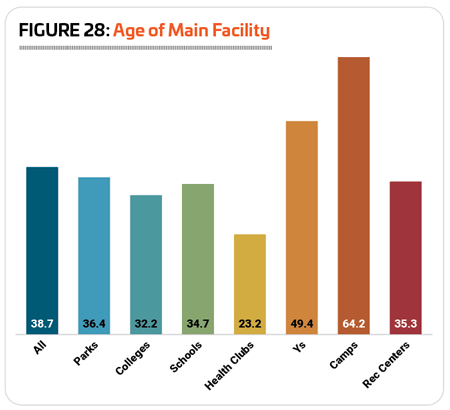
For the third year in a row, the average age of respondents’ flagship facilities has fallen, with respondents in 2026 indicating that the average age of their main facility was 38.7 years, down from 39.3 in 2025, 41 in 2024, and 43.7 in 2023. Respondents from camps and Ys had the oldest flagship facilities, at 64.2 years and 49.4 years, respectively, while those from health clubs had the newest, at 23.2 years. (See Figure 28.)
Some 5.5% of respondents said their flagship facility was 5 years old or less, up from 4% in 2025. Another 6.8% had facilities that were between 6 and 10 years old, down from 12.1%. Some 15.9% said their flagship facility was between 11 and 20 years old, down from 17.4%. More than one-fifth (21.3%) had facilities between 21 and 30 years old, up from 20.8%, while 11% had facilities between 31 and 40 years old, up from 10.5%. Another 11.5% said their main facility was between 41 and 50 years old, down from 12.9%. Finally, 28% of respondents said their main facility was more than 50 years old, down from 29.3% in 2025.
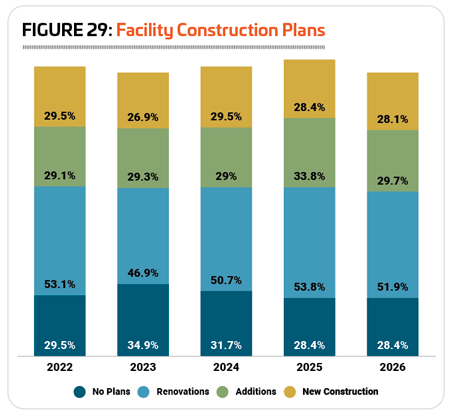
 In seven of the past 20 years, more than seven out of 10 respondents had plans for construction at their facilities, and five of those years have occurred since 2019. In 2026, 71.6% of respondents said they had plans for new construction, additions or renovations at their facilities over the next few years, unchanged from 71.6% in 2025. (The other five years when more than 70% of respondents planned construction were 2022, 2020, 2019, 2008 and 2007.) In 2026, more than half (51.9%) of respondents said they are planning renovations at their facilities, down from 53.8% in 2025. Another 29.7% are planning additions to their existing facilities, down from 33.8% in 2025, and 28.1% are planning new construction, virtually unchanged from 28.4% in 2025. (See Figure 29.)
More than three-quarters of respondents from Ys, parks and camps in 2026 said they are planning construction of any kind within the next few years. Some 80.2% of Y respondents said they have construction plans, up from 79.1%, while 78.5% of park respondents (down from 81.2%) and 76.5% of camp respondents (down from 77.2%) said they have construction plans. Nearly two-thirds (66.2%) of rec center respondents reported that they’re planning construction, down from 67%. Slightly fewer college respondents (61%) and health club respondents (60.5%) had plans for construction, while respondents from schools were the least likely to have plans for construction, though more than half (55.9%) did plan on construction within the next few years.
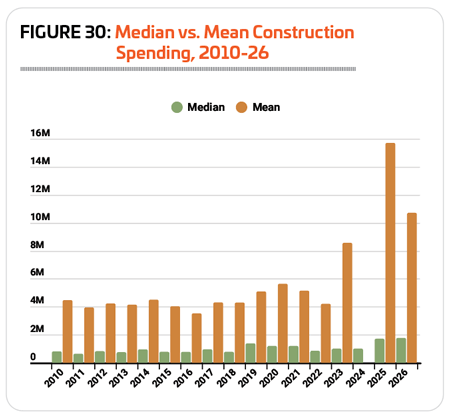
 Before diving into information on construction spending, I’d like to take note of changes to the survey instrument beginning in 2023, which allowed respondents to account for higher construction budgets than previously. But because some of those projects cost a great deal more than the average (check out the $49 million renovation of North Commons Park in Minneapolis, the $265 million renovation of Florida State University’s Doak Campbell Stadium or the new $55 million Westwood Recreation Center that just broke ground in Denver, for example), these numbers can skew the results when looking at simple averages. For this reason, we will consider the median costs reported since 2010 in the following paragraphs.
Since 2010, respondents’ median reported construction cost has increased by 121.4%, from $795,000 to $1.76 million, outpacing inflation. ($795,000 in 2010 dollars would be $1.204 million in March 2026). (See Figure 30.)
Condensing the 15 years’ worth of costs prior to 2025 into five-year averages, one can see the steady growth of construction costs over time, from an average median cost of $784,800 for the years 2010 to 2014 to an average of $1.044 million for the years 2020 to 2024, an increase of 33%.
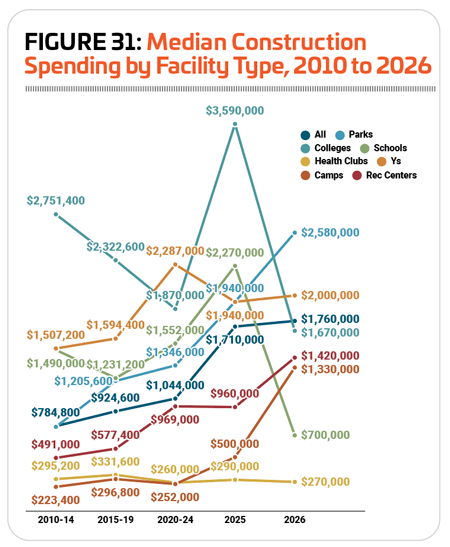
However, not every type of facility saw their median construction costs increase in this time period. Rec centers and parks reported the most rapid increases to their construction costs from 2010-14 to 2020-24, while respondents from colleges and health clubs actually saw their median construction costs decrease in that time frame. (See Figure 31.)
 Given the immense variety of projects that might be undertaken from one year to the next, it should come as no surprise that year-to-year changes in median construction costs can jump quite a bit, especially when the numbers are broken down into smaller cohorts. While the entire survey audience saw a 2.9% increase in median construction costs from 2025 to 2026, from $1.71 million to $1.76 million, respondents from colleges, schools and health clubs reported a decrease, while parks, Ys, camps and rec centers all reported increases.
The steepest increase to median construction costs from 2025 to 2026 was reported by camp respondents, whose median cost jumped 166%, from $500,000 to $1.33 million. They were followed by rec centers (up 47.9% from $960,000 to $1.42 million); parks (up 33% from $1.94 million to $2.58 million) and Ys (up just 3.1% from $1.94 million to $2 million).
On the other hand, school respondents reported the sharpest decline to median construction costs from 2025 to 2026, dropping 69.2% from $2.27 million to $700,000. They were followed by colleges (down 53.5% from $3.59 million to $1.67 million), and health clubs (down 6.9% from $290,000 to $270,000).
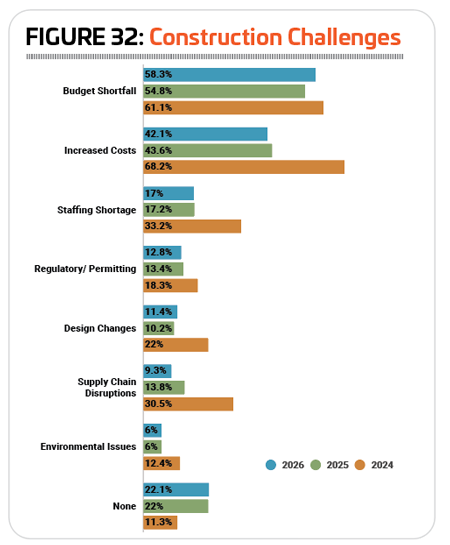
From rising costs and budgetary challenges to supply chain disruptions and more, a lot can get in the way of construction plans. In 2026, 77.9% of respondents reported that they had experienced at least one challenge or setback to their construction and renovation plans, virtually unchanged from 77.9% in 2025.
 Budget shortfalls were the biggest setback to construction plans for respondents in 2026, with 58.3% indicating that budgetary shortfalls had affected their construction plans, up slightly from 54.8% in 2025. The next most common challenges included: rising construction costs (42.1%, down from 43.6% in 2025); staffing shortages (17%, virtually unchanged from 17.2%); and regulatory or permitting issues (12.8%, down slightly from 13.4%). (See Figure 32.)
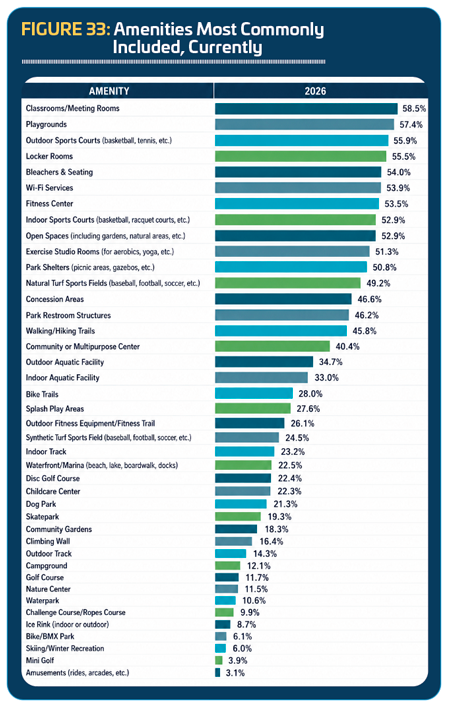
The top amenities currently included in respondents’ facilities included: classrooms and meeting rooms (58.5% of all respondents said they have classrooms and meeting rooms); playgrounds (57.4%); outdoor sports courts for basketball, tennis, pickleball, etc. (55.9%); locker rooms (55.5%); bleachers and seating (54%); Wi-Fi services (53.9%); fitness centers (53.5%); indoor courts for sports like basketball, volleyball, racquet sports, etc. (52.9%); open spaces including natural areas, gardens, etc. (52.9%); and exercise studio rooms such as aerobics, spinning or yoga studio spaces (51.3%). (See Figure 33.)
For most amenities, prevalence either remained nearly the same or fell slightly from 2025 to 2026. Those that saw an increase of at least four percentage points include: outdoor aquatic facilities (up 4 percentage points), park restroom structures (up 4.1), outdoor fitness equipment and fitness trails (up 4.2), waterfronts and marinas (up 4.6), and splash play areas (up 5.1).
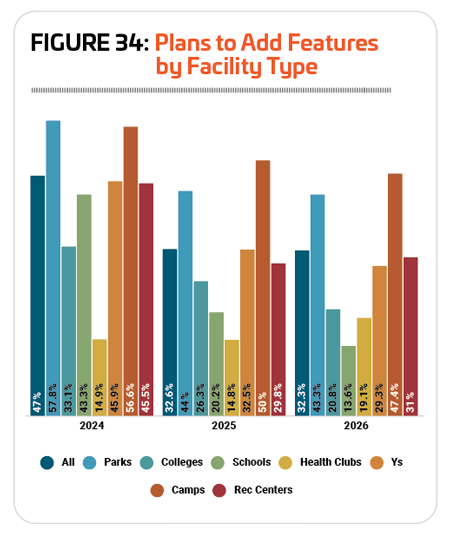
In 2026, the number of respondents who are planning to add features at their facilities fell to 32.3%, the lowest number since 2010. It’s down from the former low of 32.6% in 2025, and well under the 47% reported in 2024, which was an all-time high. Broken down by facility type, respondents from parks, colleges, schools and Ys all hit all-time lows in 2026 in terms of the percentage planning to add assets at their facilities. Some 43.3% of park respondents, 20.8% of college respondents, 13.6% of school respondents and 29.3% of Y respondents said they were planning to add features at their facilities over the next few years. Only respondents from health clubs and rec centers were more likely to report that they had plans to add amenities in 2026 vs. 2025, with 19.1% of health club respondents and 31% of rec center respondents indicating that they had such plans. The percentage of camp respondents planning to add amenities at their facilities fell below 50% for only the fifth time since 2010, with 47.4% in 2026 indicating they are planning to add features to their facilities. (See Figure 34)
 The top planned features in 2026 for all respondents include: splash play areas (22.6% of respondents with plans to add features were planning to add splash play); playgrounds (20.4%); synthetic turf sports fields (17.4%); park shelters (17.4%); and outdoor sport courts (15.9%). And despite being less likely to be planning to add features overall, respondents in 2026 who were planning to do so were more likely than the all-time average to report that they were planning to add splash play, playgrounds, synthetic turf, park shelters, outdoor sport courts, park restrooms and open spaces, among the top 10 planned amenities.
Since 2010, we’ve had 11,239 responses about the amenities respondents are planning to add. The top 10 planned amenities since 2010 include:
1. Splash play areas (22.1%, or about 2,484 instances of people saying they would add splash play)
2. Playgrounds (17.7%, 1,989 instances)
3. Synthetic turf fields (16.8%, 1,888)
4. Park shelters (16.5%, 1,854)
5. Outdoor fitness equipment/fitness trails (16.3%, 1,832)
6. Walking/hiking trails (15%, 1,686)
7. Park restroom structures (14.1%, 1,585)
8. Dog parks (13.7%, 1,540)
9. Fitness centers (12.7%, 1,427)
10. Disc golf (12.5%, 1,405)
Programming Options
Nearly all respondents—97%—said that they offer programming of one kind or another at their facilities, virtually unchanged from 2025, when 96.9% offered programming. A full 100% of respondents from schools, health clubs, Ys and rec centers said that they have programming options at their facilities. And nearly all respondents from parks (98.7%), camps (96.1%) and colleges (95.9%) also said they have programming options available to their facility users.
Looking back at 20 years’ worth of data on the most common programming options available shows a relatively consistent picture. The dozen or so most common program types might become more or less prevalent than one another, but always remain among the top dozen, with just two changes of note. First, in 2019, when group exercise was added as an option, it immediately appeared in the No. 2 position and has remained in the top five in every year since. And secondly, in 2022, teen programming overtook sport training to take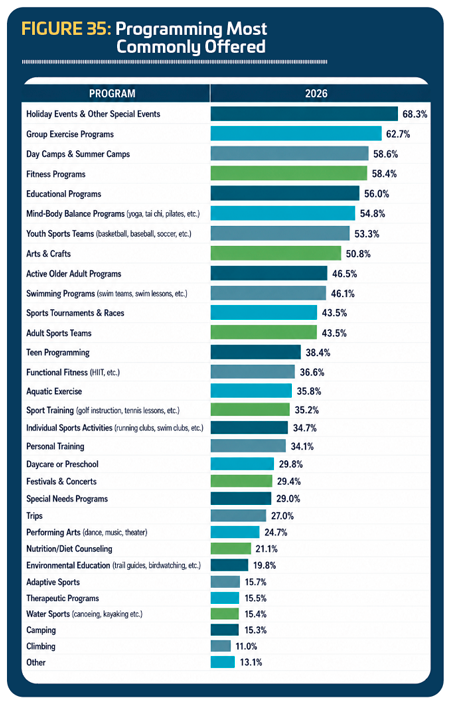 a place among the baker’s dozen of top programming options for the first time. This was really more a story of sport training becoming less popular than teen programming becoming more popular. The percentage of respondents offering teen programming has remained relatively consistent over the past 20 years, ranging from a low of 35.3% in 2022 to a high of 41.4% in 2024; but at the same time, the percentage who host sport training, such as tennis lessons or golf lessons, at their facilities, has gradually fallen, with a high of 46.2% reported in 2007, and a low of 32.1% in 2022. (In 2026, 35.2% of respondents offers sport training programs.)
The most common type of program offered by respondents’ facilities in 2026 is the same as it has been since 2007: holiday events and other special events, with 68.3% of those who provide any programming at their facilities reporting that they host this type. Also among the 10 most common types of programs in 2026 were: group exercise programs (62.7%), day camps and summer camps (58.6%), fitness programs (58.4%), educational programs (56%), mind-body balance programs like yoga and tai chi (54.8%), youth sports teams (53.3%), arts and crafts (50.8%); programs for active older adults (46.5%), and swimming programs (46.1%). (See Figure 35.)
Around one-quarter (25.2%) of respondents in 2026 said they were planning to add additional programming options to their lineup over the next few years, representing virtually no change from 2025, when 24.7% had plans to add programs.
Respondents from rec centers and health clubs were the most likely to report that they were planning to add to their program lineup. Some 39.1% of respondents from rec centers and 34% from health clubs said they were planning to add programming options. They were followed by parks (28.9%), Ys (28.4%) and camps (26.3%). Respondents from colleges (16.2%) and schools (11.4%) were the least likely to report that they had plans to expand their program lineup.
The 10 most commonly planned program additions for respondents in 2026 included:
1. Teen programs (planned by 23.4% of those who indicated they will expand their program options, virtually unchanged from 23.2% in 2025)
2. Special needs programs (22.3%, up from 16.1%)
3. Group exercise (19.9%, down from 21.8%)
4. Educational programs (19.9%, virtually unchanged from 19.8%)
5. Fitness programs (19.1%, down from 24.6%)
6. Youth sports (19.1%, up from 17.6%)
7. Adult sports teams (19.1%, down from 23.5%)
8. Adaptive sports (19.1%, up from 14.7%)
9. Environmental education (18.8%, down from 19.3%)
10. Mind-body balance (18.4%, down from 21.5%)
In addition to the program offerings they provide, recreation, sports and fitness facilities are often involved in initiatives in their communities, from outreach to the economically disadvantaged and inclusion for those with disabilities to wellness, conservation, disaster recovery and more. Some 81.2% of respondents said they were involved in at least one of the initiatives covered by the survey.
The 10 most common initiatives for respondents in 2026 were:
1. Wellness initiatives (52%, up slightly from 49.5% in 2025)
2. Outreach to underserved populations (48.8%, up from 46.4%)
3. Outreach to economically disadvantaged populations (47.8%, up from 42.3%)
4. Inclusion initiatives for those with physical disabilities (43.3%, down slightly from 45.5%)
5. Inclusion initiatives for those with developmental disabilities (40.7%, down slightly from 41.5%)
6. Outreach to minority populations (39.7%, up from 38%)
7. Programs to connect people with nature (26.7%, up slightly from 26.3%)
8. Resource conservation and green initiatives (25.1%, up from 23.8%)
9. Initiatives to reduce hunger and improve nutrition (18.8%, up slightly from 18.4%)
10. Disaster recovery assistance (11.2%, down from 11.6%)
Respondents from Ys were again the most likely to be involved in these kinds of initiatives, with 96.7% of Y respondents indicating they had such involvement. They were followed by respondents from health clubs (89.5%), parks (86.6%), camps (84%), and rec centers (81.7%). Respondents from schools (71%) and colleges (72.2%) were the least likely to be engaged in these kinds of initiatives.
Top Industry Challenges
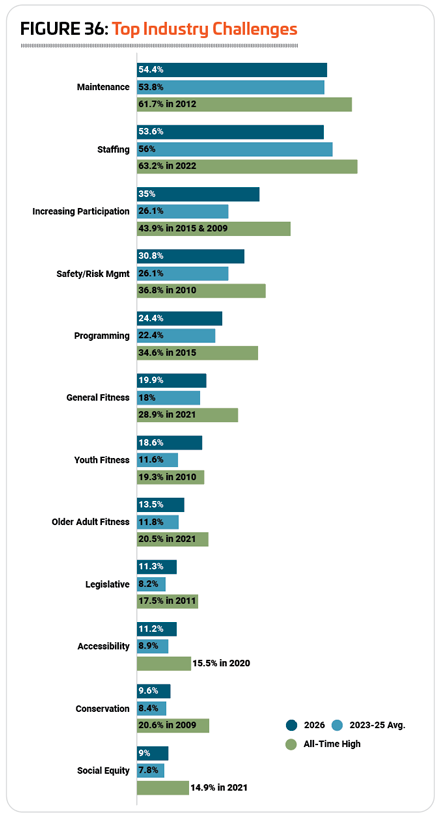
As the COVID pandemic caused shutdowns and slowdowns across the country, concerns about staffing challenges peaked for respondents to the Industry Report survey, reaching a high of 63.2% in 2022. While the percentage citing this as a challenge has fallen somewhat in the past few years, it’s still higher than in the years leading up to the pandemic. However, after rising to become the No. 1 challenge of concern cited by respondents from 2022 to 2024, the perennial issue of equipment and facility maintenance has again overtaken staffing as the top issue of concern.
In 2026, 54.4% of respondents said equipment and facility maintenance was a top challenge for their facility, down from 59.8% in 2025, but still slightly higher than the average for 2023-25 of 53.8%. The greatest percentage of respondents reported that equipment and facility maintenance was a top challenge for their facility in 2012, when 61.7% named it a top concern. (See Figure 36.)
More than half (53.2%) of respondents in 2026 also named staffing challenges as a top concern for their facilities, up slightly from 52.5% in 2025, but still well below the average for 2023-25 of 56%.
Marketing and increasing participation at their facilities was the third most cited challenge for respondents in 2026, with 35% naming it an issue of top concern. This is up from 31.9% in 2025, and well above the average of 26.1% for the years 2023-25.
While the key issues of concern have remained relatively consistent over time, with maintenance, staffing, participation, safety and creating innovative programming holding the top five spots in every year, there has been a slight shift over the past 20 years. Staffing issues have become more of a concern for respondents, while environmental and conservation issues and legislative issues have been named as top concerns less often in recent years. Before 2016, concerns that recorded highs included equipment and facility maintenance, marketing and increasing participation, creating new and innovative programming, safety and risk management, legislative issues, conservation and environmental concerns, and youth fitness. After 2020, categories that recorded record highs included staffing issues, accessibility, general fitness, and older adult fitness. (Social equity was added to the survey as an option in 2016, and peaked as an issue of concern in the wake of the pandemic and Black Lives Matter movement, hitting a high of 14.9% in 2021.) There have been no record high numbers for any of the top concerns since 2022.
Because this is the 20th anniversary of the Industry Report, we also asked respondents to tell us what factors have had the greatest influence or impact on their facilities and programming over the past 20 years. Unlike the question regarding top issues of concern, where we omit budgetary challenges (which are the perennial No. 1 concern for respondents), for this question we included a variety of options that relate to facility costs and expenditures. And indeed, “budgetary pressure” is the No. 1 factor influencing and affecting facilities over the past 20 years, according to respondents to the 2026 survey. More than half (54.7%) of respondents said budgetary pressures have had the greatest influence on their facilities and programming over the past 20 years. Half also named aging equipment and infrastructure as a top influence. (Respondents were allowed to select up to three choices.)
Here is the complete list of factors affecting facilities and programs over the past 20 years, from most to least commonly chosen:
- Budgetary pressures (54.7%)
- Aging equipment and infrastructure (50%)
- Economic/inflation-related challenges (28.1%)
- Increasing participation/growing number of users (22.2%)
- Difficulty finding or retaining employees (20.8%)
- Political challenges (13%)
- Visitor expectations/demands (13%)
- Decreasing participation/shrinking number of users (12%)
- Inclusion and accessibility (10.6%)
- Risk management and safety improvements (10.2%)
- New technologies (8.5%)
- Sustainability and conservation of resources (6.2%)
- Community involvement in facility planning (4.4%)
- Difficulty finding or retaining volunteers (4%)
- Legal and regulatory challenges (3.6%)
We’ll revisit this list in the following sections to see how these influences vary depending on the types of facilities responding.
The takeaway: Budget constraints continue to be a challenge for facilities that are also dealing with the need for upkeep of their aging assets and staffing their facilities while the costs of those assets and staff, as well as use of those facilities continues to grow. RM