


A Look at Trends in Parks & Recreation
Park districts, parks and recreation departments and other similar agencies may vary widely from state to state and region to region, but for the most part, all of them have been under increasing pressure to do more with less. Park directors and other professionals are asked to recover more of their costs through revenues, and need to find ways to stretch their staff to get more done with fewer workers. But despite those challenges, parks have continued to gain investment from the
public, and the amenities and programming found in parks have expanded to encompass everything from the expected playgrounds and picnic shelters to splash pads, dog parks, outdoor gyms and more.
According to The Trust for Public Land (TPL), public spending on parks in the 100 largest U.S. cities increased 6 percent in 2018, from $7.1 billion to $7.5 billion. There was an increased investment in certain features from 2017 to 2018 as well, with 22 percent more community gardens, 69 percent more pickleball courts, and 35 percent more splash pads. That doesn't mean the work is done. Park investment varies widely, and TPL reported that more work needs to be done to provide access to parks, in particular, given that 30 percent of people still do not live within a 10-minute walk of a park.
In this section, we take a look at the latest trends among respondents from park agencies. The largest cohort covered in the survey, these respondents made up 47.9 percent of the survey population.
The largest number of parks respondents (28.8 percent) were from the Midwest. They were followed by the West, where more than one-quarter (25.3 percent) of parks respondents are located. Smaller numbers hail from the South Atlantic states (19.6 percent), the Northeast (14.6 percent) and the South Central region (11.7 percent).
Parks respondents in 2019 were more likely than non-parks respondents to be from suburban communities, and less likely to be located in rural areas. Some 45.8 percent of parks respondents said they were located in the suburbs, compared with 40.8 percent of non-parks respondents. Another 30 percent of parks respondents were located in rural communities, while 36.1 percent of non-parks respondents were found in rural areas. Finally, 24.2 percent of parks respondents were located in urban areas, compared with 23.1 percent of non-parks respondents.
Parks respondents serve a larger average population size than most other respondents. On average, parks respondents said they reach a population of 118,600 people. This is up 25.2 percent from 2018, when parks respondents reached an average of 94,710 people. Parks respondents were more likely than non-parks respondents to report that they serve a population of at least 100,000 people, with 24 percent of parks reporting that they reach at least 100,000 (up from 21.7 percent in 2018). This compares with 17.1 percent of non-parks respondents. Conversely, while 30 percent of parks respondents said they reach a population of 20,000 or fewer (down from 33.4 percent in 2018), for non-parks respondents that number jumps to 56.3 percent.
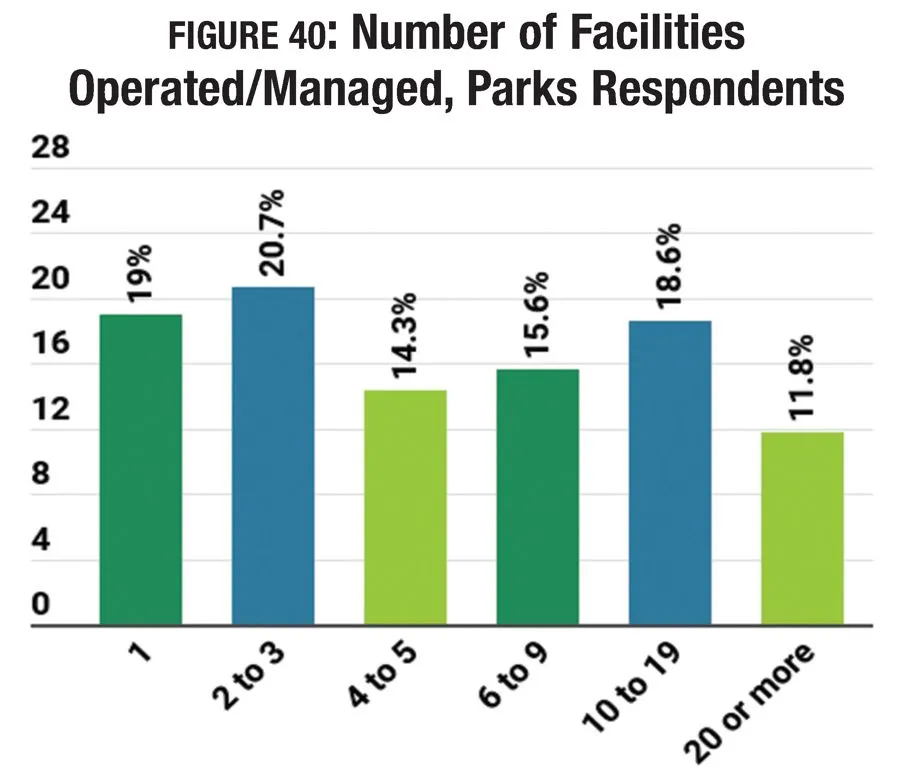
On average, parks respondents said they manage 10.7 facilities, up slightly from 9.9 in 2018. More than three in 10 (30.4 percent) said they manage 10 or more facilities. (See Figure 40.) This compares with just 9.9 percent off non-parks respondents. Conversely, parks respondents are far less likely to manage just a single facility. While 19 percent of parks respondents said they manage just one facility, some 45.1 percent of non-parks respondents said they have just one facility to manage.
Parks respondents are more likely than non-parks respondents to reach either an all-ages audience or an audience of children ages 4 to 12. While 59 percent of parks respondents said they primarily reach all ages (up from 54.9 percent in 2018), just 31.7 percent of non-parks respondents reach an all-ages audience. And, while 25 percent of parks said their primary audience is children ages 4 to 12, just 13 percent of non-parks respondents said they primarily reach this age group. Other audiences served by parks include: adults 18 and up (10.7 percent of parks respondents said they primarily reach adults); teens (2.7 percent); seniors 65 and older (2.4 percent); and infants and toddlers (0.3 percent).
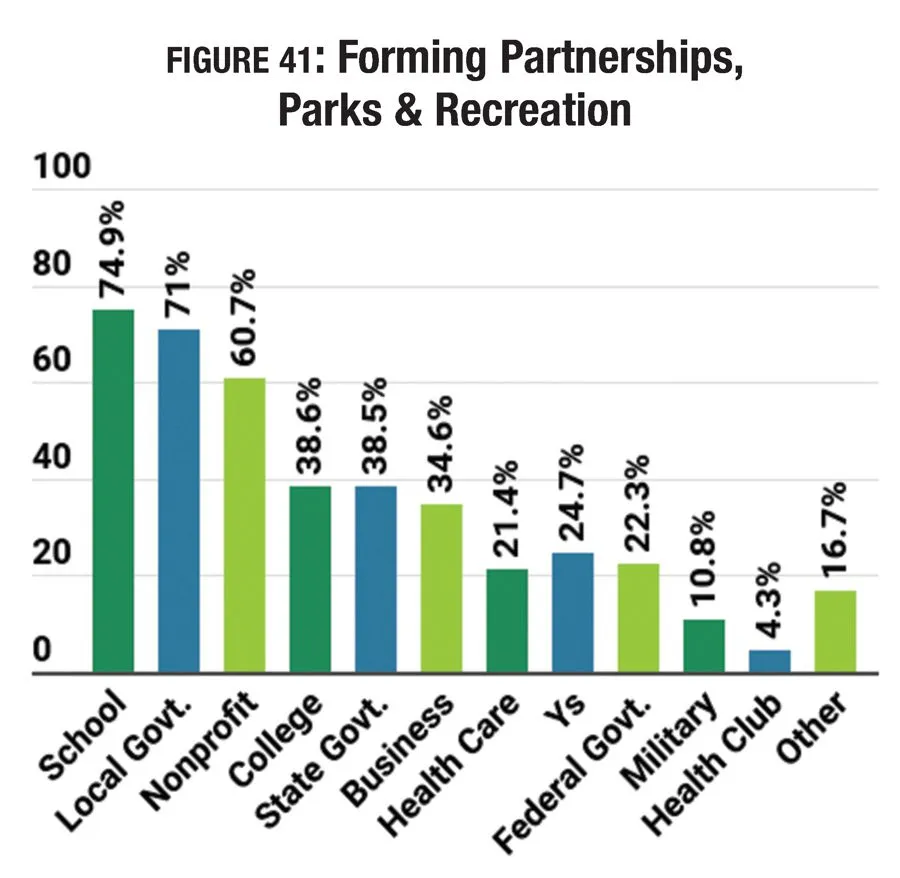
A majority of parks respondents (94.5 percent) said that they form partnerships with outside organizations, down slightly from 95.8 percent in 2018. This compares with 81.7 percent of non-parks respondents who said they had formed partnerships in 2019. The most common partners for parks are: local schools (74.9 percent of parks respondents partner with them); local governments (71 percent); nonprofit organizations (60.7 percent); corporations and local businesses (38.6 percent) and state government (38.5 percent). (See Figure 41.)
Revenues & Expenditures
The percentage of parks respondents who reported that their revenue grew year-over-year increased slightly from 2017 to 2018, with 44.2 percent indicating they saw an increase in 2017 and 45.5 percent reporting an increase in 2018. At the same time, the percentage who reported that their revenues had fallen remained virtually unchanged, with 9.1 percent reporting a decrease in 2017 and 9.4 percent reporting a decrease in 2018. (See Figure 42.)

Looking forward, a growing number of parks respondents said they expect their revenues to increase in 2019 and 2020, with 50.2 percent projecting an increase in 2019, and 54 percent expecting an increase in 2020. At the same time, the percentage who expect revenues to decrease drops to 5.2 percent in 2019 and 3.2 percent in 2020.
Parks respondents reported steadily increasing operating expenses from 2017 through 2020. From 2017 to 2018, parks respondents' operating expenditures increased by 0.5 percent, from an average of $2,020,000 to $2,030,000 in 2018. They expect to see a further increase of 1 percent in 2019, to an average of $2,050,000, and an increase of 2 percent from 2019 to 2020, with average operating expenses reaching $2,090,000.
On average, parks respondents report that they recover 42.3 percent of their operating costs via revenue, a number that has fallen slightly since the question was added to the survey in 2016. In 2018, parks respondents said they recovered 43.9 percent of costs, up slightly from 2017 (43.4 percent), but down from 2016, when 45.1 percent of costs were recovered. More than one-third (35.5 percent) said they recover 30 percent or less of their operating costs via revenue. Another 20.4 percent said they recover between 31 percent and 50 percent of their operating costs. Some 15 percent earn back 51 percent to 70 percent of their costs, and 17.4 percent said they earn back at least 71 percent of their operating costs via revenues.
Respondents from parks were slightly more likely than non-parks respondents to report that they had taken action to reduce their operating expenses. Some 81.4 percent of parks respondents said they had done so (up from 80.9 percent in 2018), compared with 79.4 percent of non-parks respondents. The most common actions parks respondents had taken to reduce their expenses include: increasing fees (53.3 percent, up from 51 percent in 2018); improving energy efficiency (46.6 percent); putting construction or renovation plans on hold (29.2 percent); reducing staff (26.1 percent); and cutting programs and services (18.8 percent).
Park Facilities
Parks respondents were much more likely than non-parks respondents to report that the number of people using their facilities had increased from 2017 to 2018. Some 57.7 percent of parks respondents said usage had increased in that time frame, compared with just 43.8 percent of non-parks respondents. This is up slightly from 2017, when 56.4 percent of parks respondents said usage had increased. Another 7.6 percent of parks respondents said usage had decreased from 2017 to 2018, up slightly from 2017, when 6.2 percent reported a decrease. (See Figure 43.)
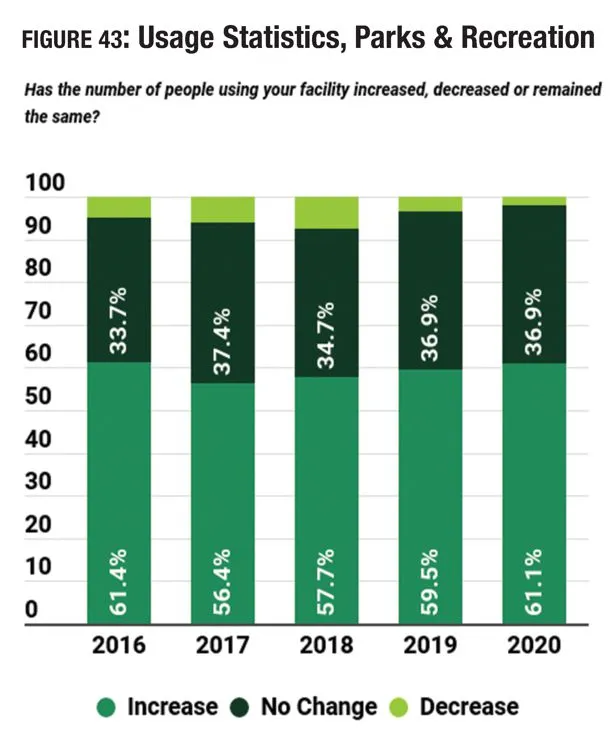
Looking forward, the percentage of parks respondents who expect to see further growth in the number of people using their facilities rises to 59.5 percent in 2019 and 61.1 percent in 2020. At the same time, the percentage expecting to see a decline in the number of people using their facilities falls to 3.5 percent in 2019 and 2 percent in 2020.
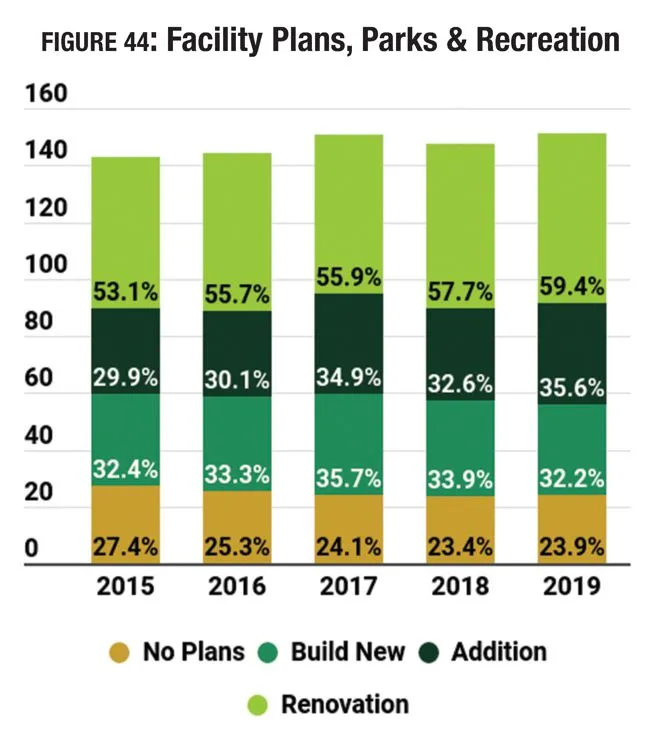
After increasing steadily for several years, the number of parks respondents who report that they have plans for construction dropped slightly in 2018. In 2015, 72.6 percent of parks respondents said they had plans for construction, and by 2018, that number had grown to 76.6 percent. This year saw a slight decrease, with 76.1 percent of parks respondents indicating that they have plans for construction over the next few years. Nearly one-third (32.2 percent) of parks respondents were planning new construction, while 35.6 percent were planning additions to existing facilities and 59.4 percent were planning renovations. (See Figure 44.)
After reporting a sharp decrease in construction budgets from 2017 to 2018, this year's parks respondents reported a significant increase. From 2017 to 2019, construction budgets for parks respondents increased by 9.4 percent, from an average of $4,689,000 to $5,130,000. This is 1 percent higher than the average for all respondents, $5,080,000.
There was little change to the features most commonly found among parks respondents' facilities from 2018 to 2019. The top 10 features commonly found in their facilities remained the same, though some were more or less prevalent than in 2018. The 10 most common features in park respondents' facilities include: playgrounds; park shelters such as gazebos and picnic shelters; park restroom structures; bleachers and seating; walking and hiking trails; outdoor sports courts for sports like basketball and tennis; open spaces such as gardens and natural areas; natural turf sports fields; classrooms and meeting rooms; and concessions.
While fewer parks respondents in 2019 are planning to add more features at their facilities over the next three years than in 2018, they are far more likely than non-parks respondents to have such plans. More than half (51.4 percent) of parks respondents said they will be adding features at their facilities (down from 56.2 percent in 2018), while 35.2 percent of non-parks respondents have such plans.
The most commonly planned additions for parks respondents include:
- Splash play areas (planned by 25.6 percent of parks respondents who will be adding features)
- Dog parks (22.4 percent)
- Playgrounds (21.6 percent)
- Fitness trails and outdoor fitness equipment (21 percent)
- Park restroom structures (18.7 percent)
- Walking and hiking trails (18.4 percent)
- Park shelters (18.1 percent)
- Synthetic turf sports fields (16.7 percent)
- Bike trails (15.5 percent)
- Disc golf courses (12.6 percent)
Features that are planned by more respondents in 2019 than in 2018 include: dog parks (up from 20.8 percent); playgrounds (up from 16.4 percent); fitness trails and outdoor fitness equipment (up from 20.6 percent); park restroom structures (up from 13.9 percent); walking and hiking trails (up from 17.8 percent); park shelters (up from 15.3 percent); and bike trails (up from 13.9 percent).
Programming
Parks respondents were slightly more likely than non-parks respondents to report that they provide programming of some kind at their facilities. While 96.2 percent of non-parks respondents provide programs, 97.6 percent of parks respondents do so.
The most common programs found in parks respondents' lineup include: holiday events and other special events (79.3 percent of parks respondents include them); youth sports teams (72.7 percent); day camps and summer camps (67.9 percent); group exercise programs (64.2 percent); adult sports teams (62.1 percent); arts and crafts (62.1 percent); educational programs (61.6 percent); programs for active older adults (60.3 percent); festivals and concerts (56.4 percent); and fitness programs (56.2 percent).
There were no programs offered by more park respondents in 2019 than in 2018.
Parks respondents were far more likely than non-parks respondents to report that they plan to add more programming options at their facilities over the next three years. Some 37.2 percent of parks respondents said they have such plans (down from 39.6 percent in 2018), compared with 26.1 percent of non-parks respondents.
The most commonly planned program additions in 2019 for parks include:
- Programs for active older adults (did not appear in 2018)
- Fitness programs (no change from 2018)
- Educational programs (up from No. 4)
- Group exercise programs (did not appear in 2018)
- Teen programming (down from No. 3)
- Mind-body balance programs such as yoga (down from No. 5)
- Environmental education programs (down from No. 1)
- Day camps and summer camps (down from No. 6)
- Special needs programs (down from No. 7)
- Holidays and other special events (did not appear in 2018)
Programs for active older adults, group exercise programs, and holidays and special events replaced adult sports teams, individual sports activities and sport-specific training in the top 10 planned programs.
Tried & True
When it comes to planned features at park facilities, you can't beat the tried and true. This year sees the greatest percentage increase in the number of parks respondents planning to add playgrounds (up 5.2 percentage points from 2018) and park restroom structures (up 4.8 percentage points).
While splash play areas, dog parks and outdoor fitness areas have been dominating the list of planned features for several years, there's no doubt that standard and expected park features like playgrounds, sports fields, picnic shelters and park restrooms are must-haves.