You can build a swimming pool for your guests, and it will surely be used for fun and recreation, and maybe even exercise, but the vast majority of respondents to our survey report that they do a little something more to get people into the pool by providing a variety of programs.
In fact, 93.9 percent of all aquatic respondents said that they currently provide programming of one kind or another at their facilities. They are led by those from Ys and from schools and school districts, where 100 percent of respondents said they currently offer programs. They were followed by colleges and universities (98.8 percent), community sports and recreation centers (96.7 percent), and parks and recreation respondents (94.2 percent). Respondents from camps were the least likely to indicate that they currently provide aquatic programming, though more than three-quarters (79.2 percent) do so. (See Figure 1.)
Respondents from facilities with higher operating costs were more likely to report that they currently provide aquatic programming than those who spend less on their aquatics. Some 97.8 percent of respondents with operating costs of $500,000 or more, and 97.8 percent of those with operating costs of $250,000 to $499,999 said they currently provide aquatic programs. This compares with 91.4 percent of those whose operating costs are less than $250,000. And, among those who spend less than $100,000 a year on their aquatic operations, 86.2 percent said they currently provide aquatic programs.
Current Program Offerings

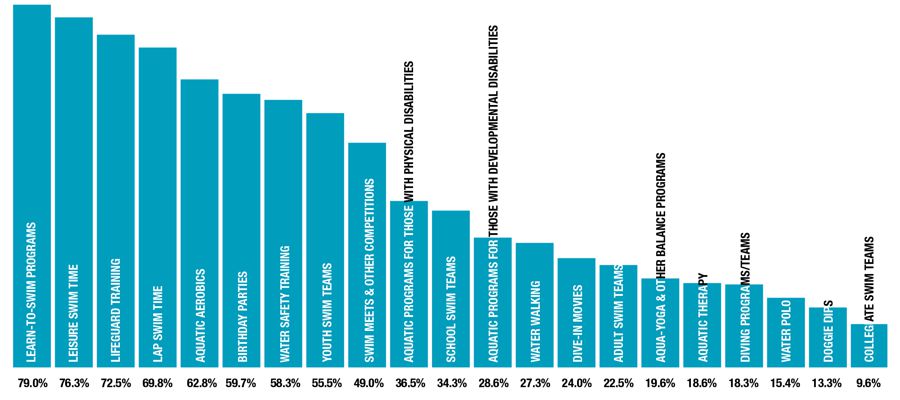
The No. 1 program currently offered by aquatic respondents was learn-to-swim programs, provided by 79 percent of respondents. More than two-thirds of aquatic respondents also said they provide: leisure swim time (76.3 percent); lifeguard training (72.5 percent); and lap swim times (69.8 percent). More than half also provide: aquatic aerobics (62.8 percent); birthday parties (59.7 percent); water safety training (58.3 percent); and youth swim teams (55.5 percent).
Among park respondents, the top current program offerings include: learn-to-swim programs (87.5 percent); leisure swim (79.4 percent); lifeguard training (77.4 percent); birthday parties (73.8 percent); and lap swim time (73.6 percent).
Among respondents from colleges and universities, the top current program offerings include: lap swim time (83.6 percent); leisure swim (76.4 percent); lifeguard training (76.4 percent); learn-to-swim programs (75.8 percent); and aquatic aerobics (57.6 percent).
For school respondents, the most common currently offered programs include: school swim teams (85.2 percent); swim meets and competitions (74.2 percent); learn-to-swim programs (73.8 percent); youth swim teams (73.8 percent); and lifeguard training (70.5 percent).
Respondents from Ys said that their top current programs include: learn-to-swim programs (96.7 percent); leisure swim (94.6 percent); lifeguard training (92.4 percent); lap swim time (91.3 percent); and aquatic aerobics (90.2 percent).
Among respondents from camp facilities, the top current program offerings include: leisure swim (65.3 percent); lifeguard training (48.6 percent); learn-to-swim programs (31.9 percent); water safety (29.2 percent); and birthday parties (23.6 percent).
For respondents from community sports and recreation centers, the most common currently offered programs include: learn-to-swim programs (91.8 percent); leisure swim (80.3 percent); aquatic aerobics (77 percent); lifeguard training (77 percent); and lap swim times (75.4 percent).
Planned Program Offerings
Nearly a quarter (22.9 percent) of respondents to the survey said that they are planning to add additional programs at their facilities over the next three years. They were led by respondents from parks and recreation facilities, where 28.6 percent said they had such plans. They were followed by those from community sports and recreation centers (23.8 percent); Ys (20.4 percent); colleges and universities (19.2 percent); and camps (12 percent). Respondents from schools were the least likely to report plans for program additions, with just 6.5 percent indicating they would be adding new programs over the next three years. (See Figure 1.)

Interestingly, respondents in the middle, in terms of operating costs, are more likely to report that they have plans to add programs at their facilities than others. Some 30.1 percent of those who reported average annual operating costs between $250,000 and $499,999 said they would be adding programs at their facilities over the next three years. This compares with just 22.9 percent of those with annual operating expenditures of $500,000 or more, and 22 percent of those who spend $250,000 or less.

The top 10 planned programs among aquatic respondents include:
- Aquatic yoga and other balance programs (planned by 32.6 percent of those who will be adding programs)
- Dive-in movies (31.1 percent)
- Aquatic programs for those with physical disabilities (23.1 percent)
- Aquatic programs for those with developmental disabilities (20.5 percent)
- Aquatic aerobics (16.1 percent)
- Water walking (15 percent)
- Learn-to-swim programs (14.7 percent)
- Adult swim teams (13.2 percent)
- Aquatic therapy (13.2 percent)
- Youth swim teams (12.8 percent)
Among parks respondents who plan to add programs, the most commonly planned additions include: aquatic programs for patrons with physical disabilities; programs for those with developmental disabilities, aqua yoga and other balance programs; dive-in movies; and water walking.
SURVEY METHODOLOGY
This report is based on a survey conducted for Recreation Management by Signet Research Inc., an independent research company. An e-mail was broadcast and respondents were invited to participate. From the launch of the survey on Dec. 12, 2017, to the closing of the survey on Jan. 2, 2018, 1,194 returns were received. The findings of this survey may be accepted as accurate, at a 95 percent confidence level, within a sampling tolerance of approximately +/- 2.8 percent.


