


A Look at What's Happening in Recreation, Sports and Fitness Facilities

Welcome to the 10th anniversary of our annual State of the Industry Report! Since June 2007, when we first reported the results on a 50-question survey that asked readers to provide a wide range of information about their facilities, we have been bringing this report to your desk at the beginning of each summer, providing an in-depth look at facility budgets, staffing, programs, building plans and much more.
It may sometimes seem like 10 years can fly by in the blink of an eye, but the truth is that a lot happens over the course of a decade. In the past 10 years, we've watched facility budgets take a big hit and then recover from the economic downturn. We've watched as some types of amenities, like splash play areas, dog parks and disc golf, have surged in popularity. We've seen construction plans get put on hold and then picked back up again as access to bonds and loans has improved.
Over the course of these 80-something pages, we'll take you on a tour through the detailed responses collected via our annual survey, aiming to paint a picture of the current state and trends affecting the management, construction, planning, programming, marketing, staffing and operations of recreation, sports and fitness facilities.
Before we dive into the numbers, I'd like to take a minute to express my deep appreciation and gratitude for the readers who took the time to participate in our extensive survey. I know you have a lot on your plate, and the fact that you're willing to take the time and consideration to provide this information speaks volumes about how much you care about the industry, as well as how much you value the end result, which you're reading now. We couldn't put together this extensive report without your help. Thank you!
As we do in every June issue, we'll begin this report by providing an overall summary of the survey results, with information tabulated from all 2,116 respondents. In addition, we'll occasionally break things down here to provide a bit more detail on how different facility types are faring. In the sections that follow, we'll provide greater detail from specific industry segments. We begin with a look at the results from various regions of the country (see page 41). Then we'll provide a closer look at respondents whose facilities include aquatic elements (see page 52). From there, we take a look at some of the largest segments of our survey population, including parks and recreation (see page 64), colleges and universities (see page 72), schools and school districts (see page 78), health clubs (see page 84), and YMCAs, YWCAs, JCCs and Boys & Girls Clubs (see page 88). Head to our website at recmanagement.com to learn even more, as we'll include special exclusive features there looking more closely at camps and community centers. And finally, be sure to stay tuned for the July 2016 issue, where we'll report the career and salary results of this survey in our annual Salary Survey report.
Survey Methodology
This report is based on a survey conducted for Recreation Management by Signet Research Inc., an independent research company. An e-mail was broadcast and respondents were invited to participate. From the launch of the survey on Jan. 27, 2016, to the closing of the survey on Feb. 10, 2016, 2,117 returns were received. The findings of this survey may be accepted as accurate, at a 95 percent confidence level, within a sampling tolerance of approximately +/- 2.1 percent.
Who Are You?
As with the readership of Recreation Management, survey respondents largely represent the higher levels of their organizations. More than one-third (34.4 percent) of respondents said their job title was "director." Another 20.8 percent are in administration management, which includes such titles as administrator, manager and superintendent. Another 15.5 percent of respondents are operations/facility managers, holding such titles as operations manager, facility manager, building manager or supervisor. Some 11.2 percent of respondents are in program and activity administration, with titles such as activity or program director, manager, coordinator, specialist, coach or instructor. Another 8.1 percent of respondents said they are the chairman, CEO, president, vice president or owner of their organization. Just 2.5 percent of respondents said they are faculty or teachers. Less than one in 100 (0.5 percent) of respondents are in service roles, including planners, designers, architects and consultants. Finally, 6.9 percent of respondents said they have an "other" role in their organization.
Considering so many respondents are representative of higher levels of career achievement, it should come as no surprise that the majority of respondents have a great deal of experience on the job and in their industry. On average, respondents have 11.9 years in their current positions, and 22 years of experience in the recreation, sports and fitness industry.
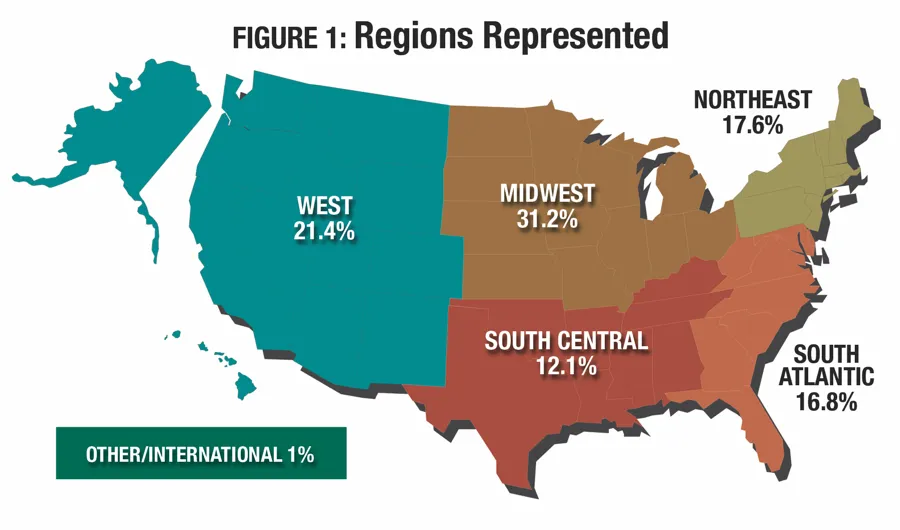
Respondents in 2016 were most likely to report in from the Midwest, with some 31.2 percent of all respondents indicating they were from Illinois, Indiana, Iowa, Kansas, Michigan, Minnesota, Missouri, Nebraska, North Dakota, Ohio, South Dakota or Wisconsin. (See Figure 1.)
The second largest region in terms of survey representation was the West, with 21.4 percent of respondents, a slight increase from 2015. This includes Alaska, Arizona, California, Colorado, Hawaii, Idaho, Montana, Nevada, New Mexico, Oregon, Utah, Washington and Wyoming.
The Northeast was represented by 17.6 percent of respondents in 2016, also up slightly from 2015, causing this region to leap ahead of the South Atlantic states' former position as the third largest region in terms of representation. The Northeast includes Connecticut, Maine, Massachusetts, New Hampshire, New Jersey, New York, Pennsylvania, Rhode Island and Vermont.
There were fewer respondents in 2016 from the South Atlantic region than in previous years. Some 16.8 percent of this year's respondents were from Delaware, Florida, Georgia, Maryland, North Carolina, South Carolina, Virginia, Washington, D.C., and West Virginia. This is a drop from 2015, when 18.7 percent of respondents were from the South Atlantic.
The South Central states also saw a slight decline in representation, with 12.1 percent of 2016 respondents calling this area home. This region is represented by Alabama, Arkansas, Kentucky, Louisiana, Mississippi, Oklahoma, Tennessee and Texas.
Finally, just 1 percent of the survey respondents reported that they were from outside the United States.
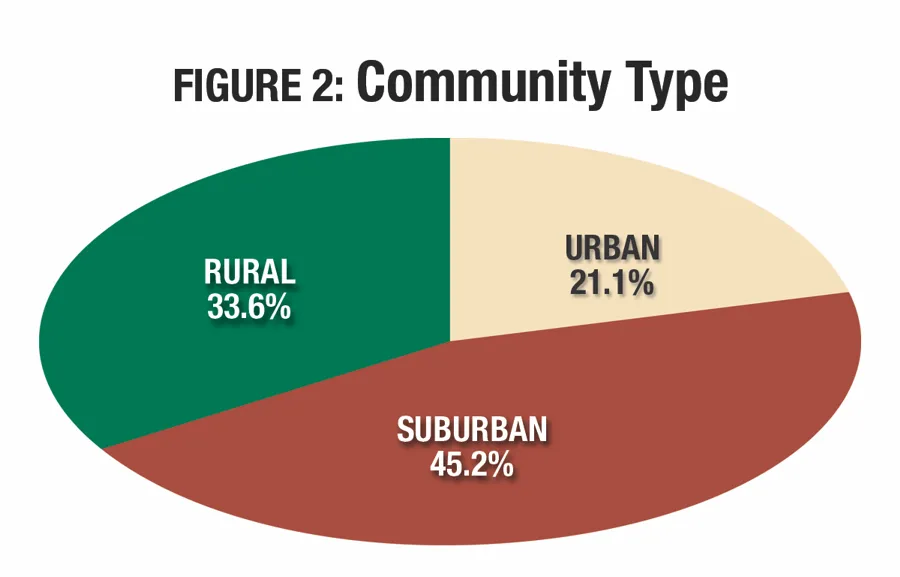
Slightly more respondents in 2016 were from suburban communities, compared with 2015, while fewer were from rural and urban areas. Some 45.2 percent of respondents in 2016 were from suburban communities, compared with 42.3 percent in 2015. Another third (33.6 percent) were from rural areas, and 21.1 percent were from urban communities. (See Figure 2.)
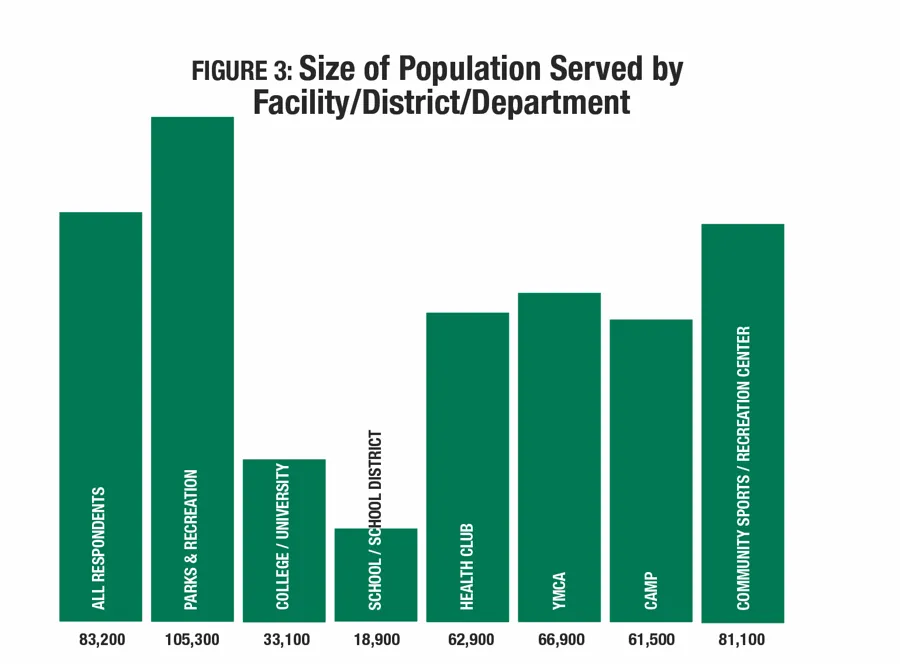
On average, the facilities, districts and departments covered by the Industry Report survey serve a population of 83,200 people. (See Figure 3.) That said, more than two-thirds of respondents said their facilities reach an average of 50,000 or fewer people. Some 33.5 percent of respondents serve a population of less than 10,000, while another 34.1 percent serve a population of 10,000 to 49,999. Another 13 percent serve a population between 50,000 and 99,999. Some 8.7 percent said their facility's population is between 100,000 and 199,999. Finally, 10.7 percent said they serve a population of 200,000 or more.
The largest population served by any particular facility type was found among parks and recreation respondents, who said they serve 105,300 on average. They were followed by community or private sports and recreation centers, at 81,100; YMCAs, at 66,900; and health clubs, with 62,900. The smallest average population served were found among schools and school districts (18,900) and colleges and universities (33,100).
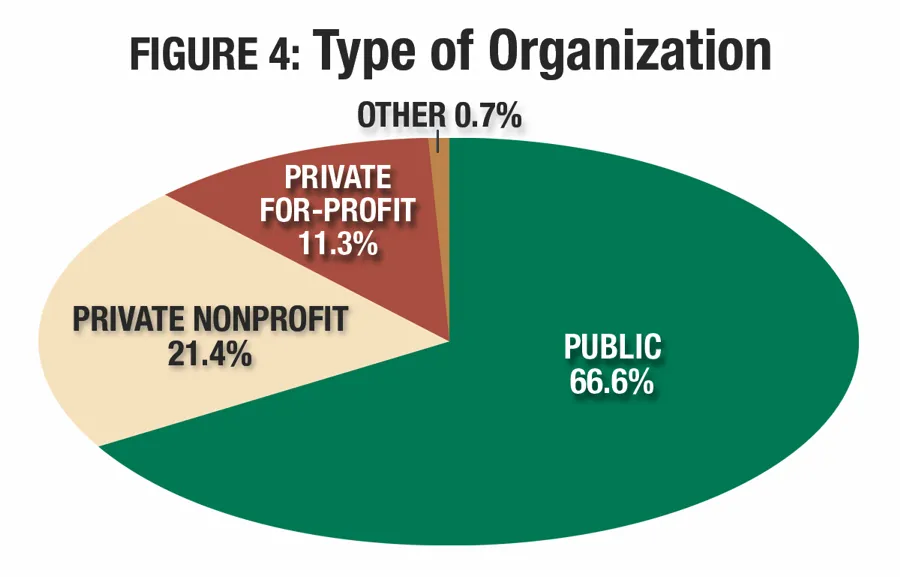
As in past years, the largest number of respondents said they work for public organizations. Two-thirds (66.6 percent) of survey respondents are with public organizations, such as parks and recreation departments, public schools or public universities. (See Figure 4.) They were followed by those who work for private, nonprofit organizations. Some 21.4 percent of respondents fall into this category, which includes such facilities as YMCAs and Boys & Girls Clubs. Finally, 11.3 percent of respondents indicated they were with private for-profit organizations, such as health clubs or resorts.
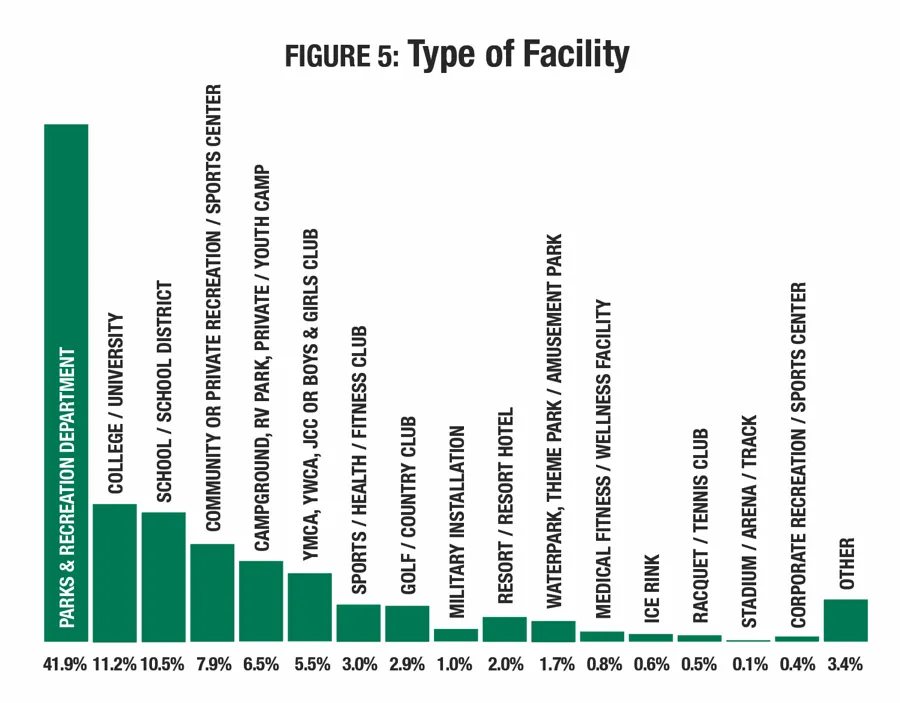
As in past years, the largest percentage of respondents reported from parks and recreation departments, park districts and similar organizations. Some 41.9 percent of respondents said they worked for parks and recreation. (See Figure 5.) They were followed by respondents from colleges and universities (11.2 percent); schools and school districts (10.5 percent); community or private recreation and sports centers (7.9 percent); campgrounds, RV parks, and private/youth camps (6.5 percent); and YMCAs, YWCAs, JCCs or Boys & Girls Clubs (5.5 percent). Smaller numbers of respondents reported from other types of facilities, including: sports, health and fitness clubs (3 percent); golf or country clubs (2.9 percent); resorts or resort hotels (2 percent); waterpark, theme parks or amusement parks (1.7 percent); military installations (1 percent); medical fitness and wellness facilities (0.8 percent); ice rinks (0.6 percent); racquet or tennis clubs (0.5 percent); corporate recreation or sports centers (0.4 percent); or stadiums, arenas and tracks (0.1 percent). Another 3.4 percent of respondents said they work for an "other" type of facilities, such as homeowners associations, churches and more.
Some types of facilities were more likely to be found in certain communities than others. For example, golf and country clubs were far more likely to be found in suburban communities than in other community types. Some 57.4 percent of golf and country clubs were located in the suburbs. Military installations (55 percent) and community or private recreation and sports centers (51.2 percent) were also most likely to be found in suburban communities. Least likely to be found in the suburbs were resorts and resort hotels (17.1 percent), and camps and campgrounds (20 percent).
Respondents from camps and campgrounds were most likely to be found in rural communities, with more than three-quarters (75.6 percent) of these respondents indicating they were in rural areas. They were followed by resorts and resort hotels (63.4 percent), and schools and school districts (49.8 percent). Respondents from community or private sports and recreation centers were least likely to be found in rural areas, with just 23.2 percent of these respondents indicating they were located in rural communities.
While there was no type of facility that was more commonly found in urban areas than in other community types, some were more likely to be urban than others. Some 28.8 percent of colleges and universities were located in urban communities. They were followed by community and private recreation and sports centers (25.6 percent), and YMCAs (24.3 percent). Respondents from camps were least likely to be located in urban communities, as might be expected, with just 4.4 percent indicating they called an urban area home.
Obviously, some types of facilities are more likely to be publicly administered, while others are more likely to be for-profit or nonprofit organizations. Those that were most likely to report that they were with a public organization were respondents from parks and recreation facilities (97.2 percent of which were public), schools and school districts (93.2 percent), and military (81 percent).
Respondents from YMCAs were most likely to be from private nonprofits, with 90.5 percent of Ys reporting they were this type of organization. They were followed by camps and campgrounds (63.8 percent) and golf and country clubs (50.8 percent). Parks were least likely to be private nonprofits, with just 2.5 percent indicating that this was their organization type.
Finally, private for-profit organizations were most common among health club respondents, where 64.1 percent said they were with a private for-profit organization. They were followed by resorts and resort hotels (62.8 percent) and golf and country clubs (29.5 percent).
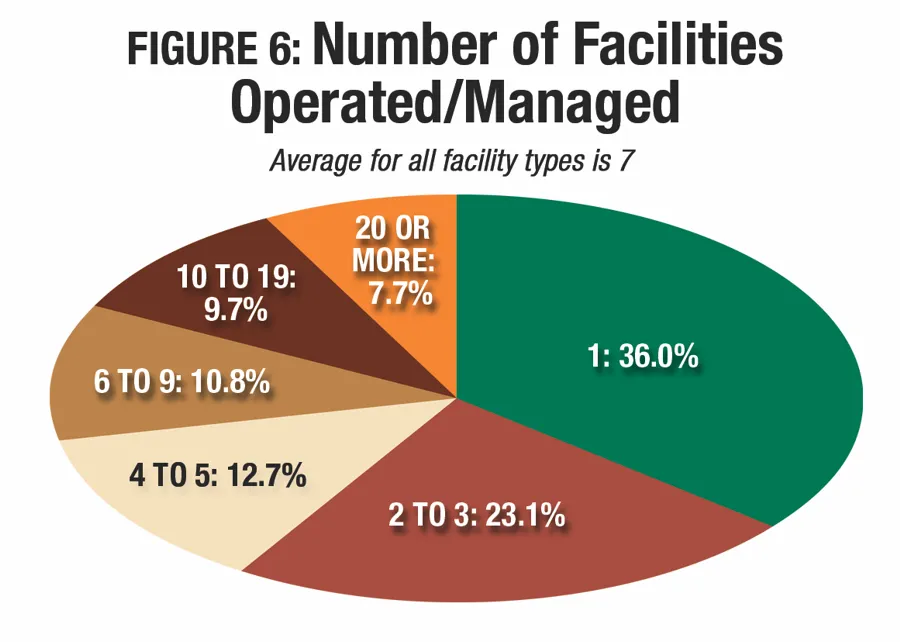
On average, survey respondents manage seven facilities, consistent with past years, when the average has varied from 6.4 to 6.8. Well over half (59.1 percent) indicated that they manage between one and three facilities. Nearly one-quarter (23.5 percent) said they manage between four and nine facilities. Some 17.4 percent of respondents said they manage 10 or more facilities. (See Figure 6.)
Respondents from urban and suburban communities were much more likely to manage a larger number of facilities than those from rural communities. On average, urban respondents manage 9.4 facilities, suburban respondents manage 7.3, and rural respondents manage 5.2. Nearly one-quarter (24.2 percent) of urban respondents said they managed 10 or more facilities, compared with 18.3 percent of suburban respondents and 11.6 percent of rural respondents. At the same time, 63.8 percent of rural respondents said they manage three or fewer facilities, compared with 56.9 percent of suburban respondents and 55.7 percent of urban respondents.
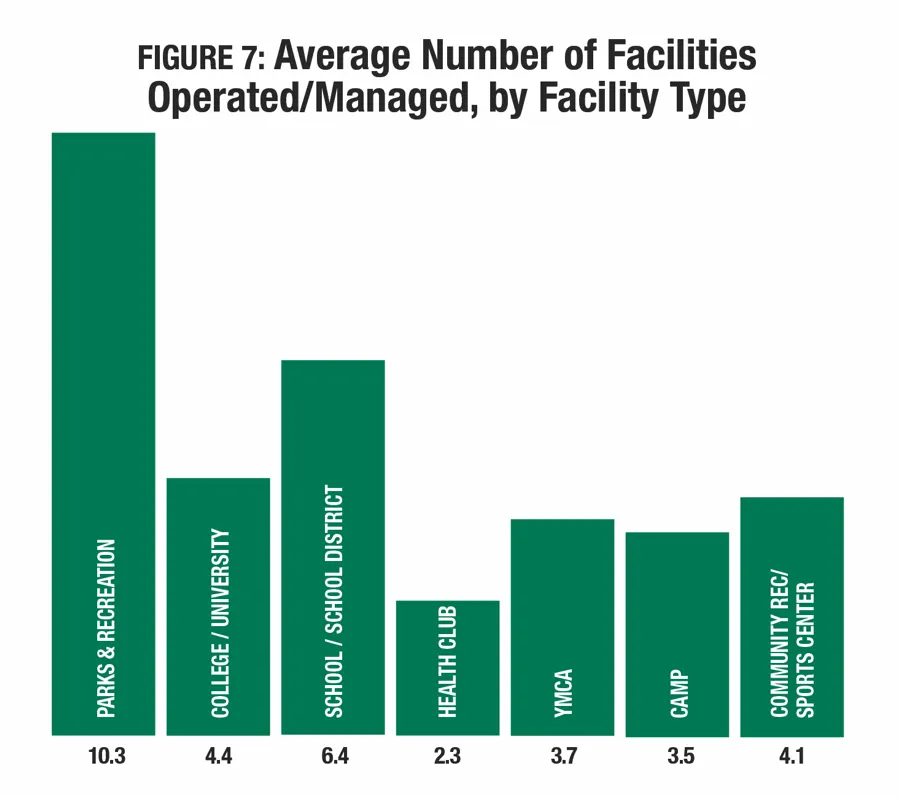
Respondents from park facilities were much more likely than others to report that they managed a larger number of facilities. On average, parks respondents manage 10.3 facilities, with 27.6 percent reporting that they manage 10 or more. They were followed by school respondents, who manage an average of 6.4 facilities, with 15.9 percent indicating they manage 10 or more. (See Figure 7.) Respondents from health clubs were least likely to report managing 10 or more facilities. On average, health club respondents manage 2.3 facilities, with just 1.6 percent managing 10 or more, and 90.7 percent indicating they manage three or fewer. YMCA respondents also managed fewer facilities, with 86.1 percent indicating they manage three or fewer. Only 39.5 percent of parks respondents said they manage three or fewer facilities.
A majority of respondents (87.2 percent) said that they form partnerships with outside organizations. This is up slightly from last year, when 85.6 percent reported forming such partnerships. Many organizations utilize such partnerships as a way to extend their programming capabilities and reach within their community, or as a way to share facilities or increase funding potential.
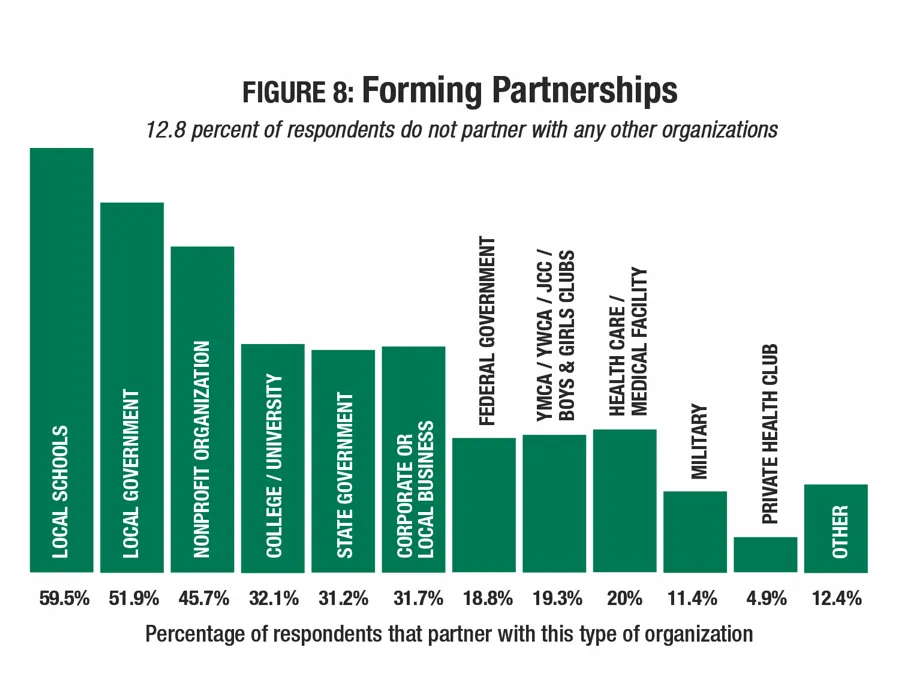
The most common partners for all facility types were local schools. Nearly six in 10 (59.5 percent) of respondents said they had partnered with local schools. They were followed by local government (51.9 percent), nonprofit organizations (45.7 percent), colleges and universities (32.1 percent), and corporations or local businesses (31.7 percent). (See Figure 8.)
Respondents from urban and suburban communities were more likely than their rural counterparts to report that they formed partnerships outside of their organization. Some 88.4 percent of urban respondents and 88.2 percent of suburban respondents had done so, compared with 85.2 percent of rural respondents.
Suburban respondents were more likely than those from urban or rural areas to report that they had partnered with local schools (62.5 percent of suburban respondents had partnered with schools); local government (55.4 percent); and corporate or local businesses (35.8 percent). Urban respondents were more likely than those from the suburbs or rural communities to form partnerships with nonprofit organizations (51 percent); colleges and universities (42.4 percent); state government (34.4 percent); YMCAs (26.2 percent); health care or medical facilities (24.4 percent); federal government (21.9 percent); military (14.1 percent); and private health clubs (6.6 percent).
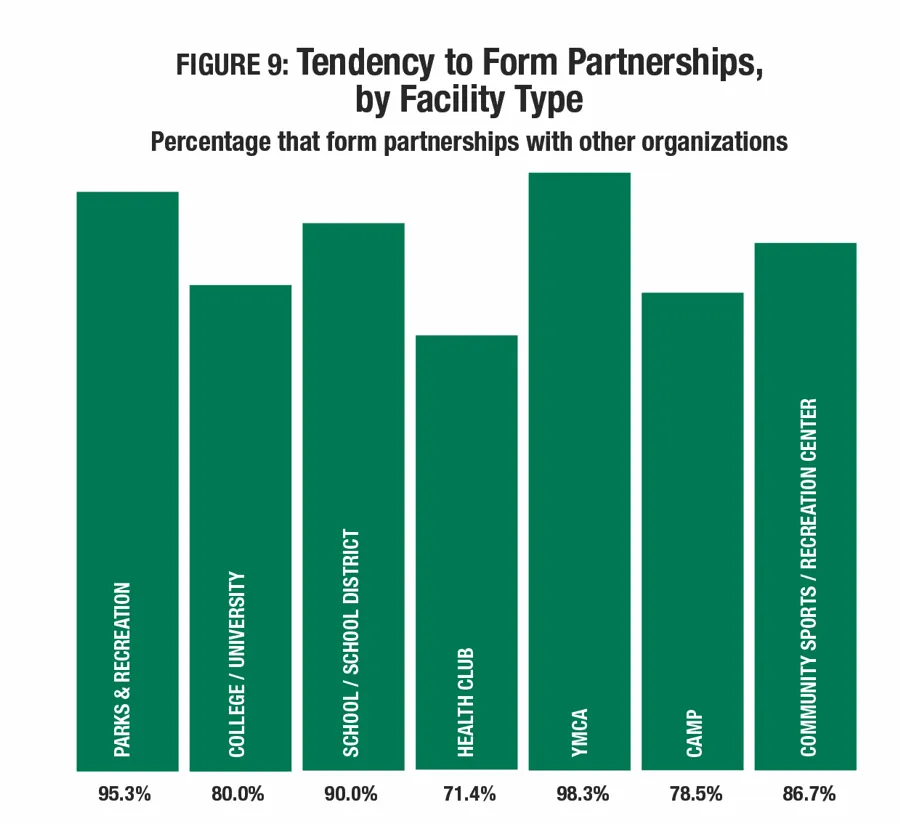
Respondents from YMCAs, parks and schools were the most likely to report that they had partnered with outside organizations, while those from health clubs were the least likely to partner. Some 98.3 percent of YMCA respondents, 95.3 percent of parks respondents, and 90 percent of school respondents had formed such partnerships, compared with just 71.4 percent of health clubs. (See Figure 9.)
Just as they were the most likely to form any kind of partnership, respondents from YMCAs were the most likely to partner with most of the types of facilities considered. They were more likely than other facility types to partner with local schools (80.2 percent of YMCA respondents had partnered with local schools); nonprofit organizations (79.3 percent); healthcare or medical facilities (69 percent); corporate or local businesses (56.9 percent); other YMCAs (56 percent); military (36.2 percent); and the federal government (24.1 percent). Respondents from parks were more likely than others to partner with local government, with 70.4 percent of parks respondents having formed such partnerships. Colleges and universities were more likely than others to report that they had partnered with other colleges and universities (57.4 percent); and likewise, health clubs were more likely to report that they had partnered with other health clubs (9.4 percent). Schools and school
districts were the most likely to have formed partnerships with state government, with 44.3 percent of school respondents indicating they had formed such partnerships.
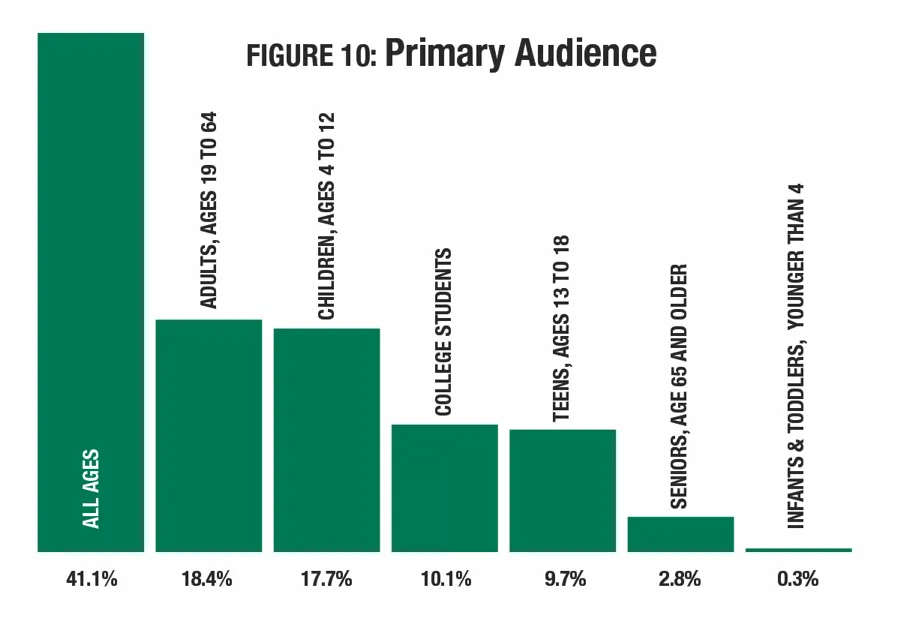
When it comes to the age groups served by their facilities, the largest number of respondents are not specific. Some 41.1 percent said their primary audience is all ages. (See Figure 10.) Nearly a fifth (18.4 percent) said adults between 19 and 64 years old are their primary audience, and 17.7 percent said children ages 4 to 12 are their main audience. Fewer respondents serve college students only (10.1 percent), and less than one in 10 said their primary audience was made up of teens between 13 and 18 years old (9.7 percent), seniors 65 and older (2.8 percent), or infants and toddlers (0.3 percent).
When it comes to facility types, some were more likely to serve specific audiences than others. YMCA and parks respondents were the most likely to report that they served all ages. Some 57.8 percent of Y respondents and 55.7 percent of parks respondents said they served an all-ages audience. Colleges were the least likely to serve all ages, with just 3 percent indicating that this was their primary audience.
Children ages 4 to 12 were most likely to be the primary audience for camp respondents (33.6 percent) and parks respondents (26.1 percent), and least likely to be the primary audience for colleges (0.4 percent).
Adults ages 19 to 64 were most likely to be the primary audience for health club respondents, 56.3 percent of whom said this was their primary audience. They were followed by community sports and recreation centers, where 23.5 percent said this was their primary audience. Adults were the least likely audience for school respondents, though 5.4 percent said this was their primary audience.
College students, obviously, were the most likely to be the primary audience at colleges and universities. Some 87.7 percent of college respondents said college students were their primary audience. No park, school or YMCA respondents called this their primary audience.
Teens were most likely to be the primary audience for school respondents, more than half (57 percent) of whom said teens between 13 and 18 years old were their primary audience. They were followed by camps, where 18.2 percent of respondents said teens were their primary audience.
Seniors 65 and older were most commonly the primary audience at health clubs. Some 7.8 percent of health clubs said seniors were their primary audience. They were followed by community recreation centers (4.8 percent) and YMCAs (3.4 percent).
Revenues & Expenditures
Over the course of the past 10 years, we've seen revenues and operating budgets take a hit, sharper in some areas and facilities than others, and then begin to recover. And, as budgets tightened, facilities started to look for ways to streamline their operations or reduce expenditures, in order to continue operations and provide much-needed services to their communities. Some facilities closed entirely, while others reduced their seasons, their staffs and their hours. The past couple of years have shown a recovery to a "new normal" as more facilities that were formerly subsidized must now earn more revenue to support their operations.
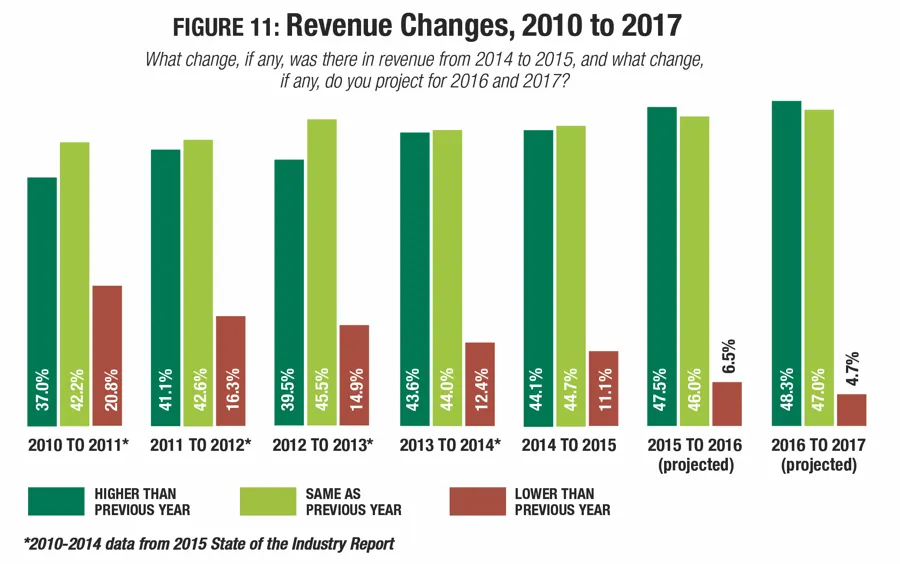
Since 2010, a mostly increasing number of respondents have reported increasing revenues, year-over-year. The only exception was 2012 to 2013. Since then, the number of respondents who said revenues did or will grow has increased from 39.5 percent (2012-2013) to 48.3 percent (projected for 2016-2017). (See Figure 11.)
At the same time, the number of respondents reporting decreasing revenues has steadily fallen, from 20.8 percent who reported that revenues decreased from 2010 to 2011, to 4.7 percent projecting a decrease from 2016 to 2017.
From 2014 to 2015, a majority of respondents said their revenues either remained the same (44.7 percent) or increased (44.1 percent). Just 11.1 percent reported that revenues decreased in this time frame, down from 12.4 percent who saw decreases in the preceding year.
Looking forward, the vast majority of respondents feel their revenues will either hold steady or increase, with a shrinking percentage expecting revenues to drop. From 2015 to 2016, nearly half (47.5 percent) said revenues will increase, and 46 percent said revenues will stay the same. And from 2016 to 2017, 48.3 percent projected an increase to revenues, while 47 percent expect revenues to remain the same.
Respondents from urban communities were the most likely to report that their revenues had increased from 2014 to 2015, and also were the most likely to project further increases in 2016 and 2017. While 48.4 percent of urban respondents said they had seen an increase in revenues in 2015, just 43.5 percent of suburban and 42.4 percent of rural respondents reported increases. Looking ahead, 52 percent of urban respondents expect revenues to increase in 2016, and 53.3 percent expect an increase in 2017. Respondents from rural communities were the most likely to report decreasing revenues in every year covered by the study, with 12.8 percent reporting decreases in 2015, 8.8 percent projecting a decrease in 2016 and 6.3 percent projecting a decrease in 2017.
Respondents from camps, YMCAs and health clubs were the most likely to report that their revenues were not stable from 2014 to 2015. In fact, these three industry groups were the most likely to report that revenues had increased in that time period, and also were the most likely to report a decrease in revenue in that time. Some 56.7 percent of camp respondents, 56.5 percent of YMCA respondents and 48.4 percent of health club respondents said revenues had increased from 2014 to 2015. At the same time, 24.2 percent of health club respondents reported a decrease, as did 19.1 percent of YMCA respondents and 14.9 percent of camp respondents.
School respondents were the least likely to see increasing revenues from 2014 to 2015, with just 12.5 percent reporting an increase. Parks respondents were least likely to report a decrease in revenue, at 7.6 percent.
Looking forward, health clubs, YMCAs and camps again were the most likely to project increases to their revenues in 2016 and 2017. In 2016, 78.3 percent of health club respondents, 59.8 percent of YMCA respondents and 58.8 percent of camp respondents said they expect to see revenues increase. And in 2017, 80.7 percent of health clubs, 66 percent of YMCAs and 59.2 percent of camps expect an increase.
Respondents from schools and school districts, as well as colleges and universities were the most likely to expect decreases to revenues in the next two years. From 2015 to 2016, 11.9 percent of school respondents and 10.6 percent of college respondents said they thought revenues would drop. And from 2016 to 2017, 13.2 percent of schools and 7.3 percent of colleges expect a decrease.
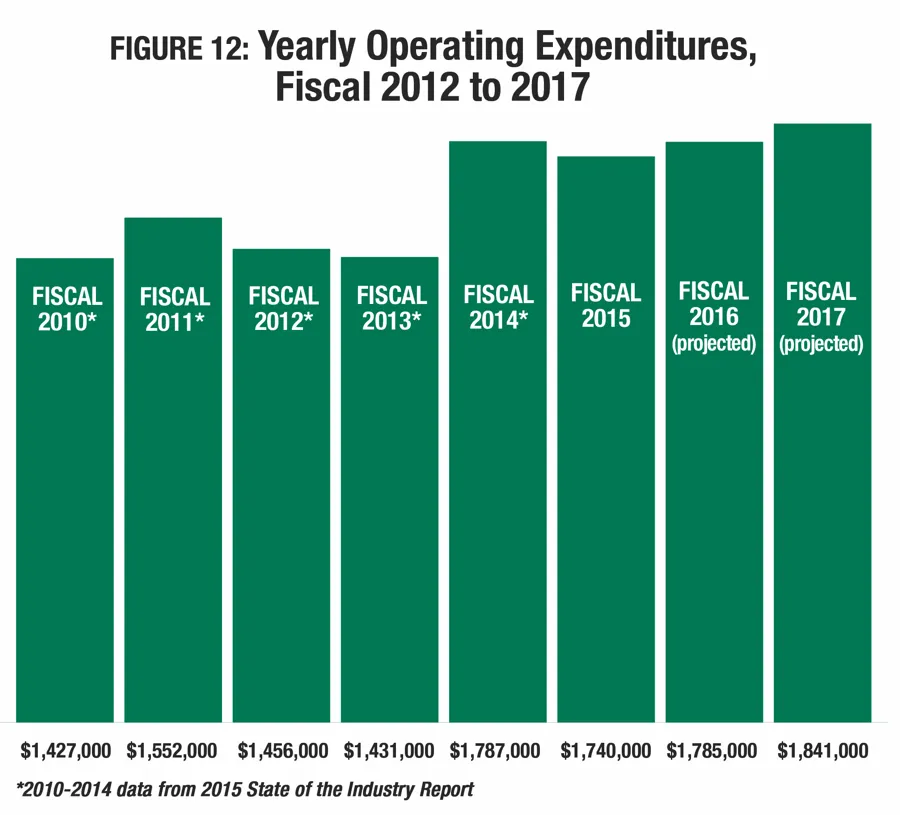
After a substantial increase in fiscal 2014, operating expenditures fell slightly in 2015, by 2.6 percent to an average of $1,740,000. This is 21.9 percent higher than the average in fiscal 2010 of $1,427,000. However, it is 4.4 percent lower than the projected operating expenditure for 2015 from last year's salary survey.
Looking forward, respondents expect to see modest increases in operating expenditures, with a 2.6 percent increase from 2015 to 2016, and a further 3.1 percent increase in 2017. (See Figure 12.)
Respondents from urban communities reported the highest average operating expenditures for 2015, and also were the only type of community to report an increase to average operating expenditures from 2014 to 2015. Urban respondents saw their average operating expenditures increase by 16 percent from $2,128,000 in 2014 to $2,468,000 in 2015. In this same time period, suburban and rural respondents saw their average operating expenditures drop. The greatest decrease was reported by rural respondents with a 10.6 percent decrease form $1,245,000 in 2014 to $1,113,000 in 2015. Suburban respondents reported a 5.8 decrease from an average operating expenditure of $2,017,000 in 2014 to $1,900,000 in 2015.
Looking forward, however, respondents from suburban and rural communities projected a greater increase to operating expenditures over the next two years than urban respondents. Suburban respondents are expecting operating expenditures to increase by 6.4 percent from an average of $1,900,000 in 2015 to $2,021,000 in 2017. They were followed by rural respondents, who projected a 5.9 percent increase from $1,113,000 in 2015 to $1,179,000 in 2017. Urban respondents are expecting their average operating expenditures to rise by a more modest 3.9 percent in the same time period, from $2,468,000 to $2,565,000.
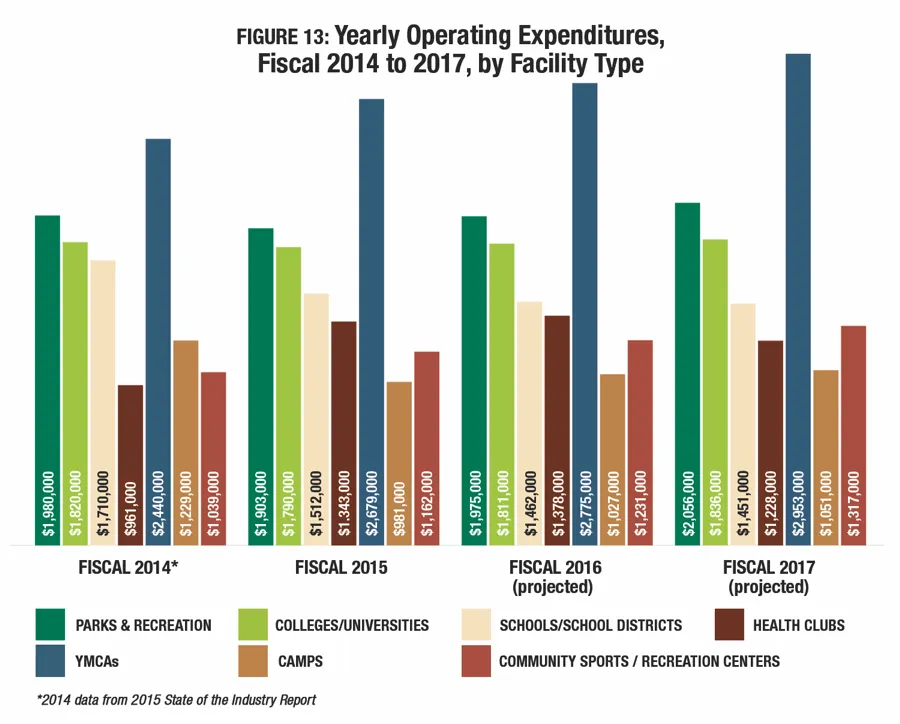
Between fiscal 2012 and fiscal 2015, respondents from colleges and YMCAs reported the greatest increases in their average operating expenditures. College respondents reported a 41.3 percent increase from an average of $1,661,000 in fiscal 2012 to $1,790,000 in fiscal 2015, while YMCAs saw a 23.7 percent increase in the same time period, from $2,166,000 to $2,679,000. (See Figure 13.) More modest increases were reported by health clubs (15.6 percent increase), parks respondents (14.6 percent) and community recreation centers (9.8 percent).
From fiscal 2012 to fiscal 2015, respondents from camps and from schools both reported slight decreases in average operating expenditures. Camp respondents saw operating expenditures fall by 1.5 percent from $996,000 in fiscal 2012 to $981,000 in fiscal 2015, while school respondents reported a 0.5 percent decrease from $1,519,000 to $1,512,000.
From 2014 to 2015, only respondents from health clubs, community recreation centers and YMCAs saw their average operating expenditures increase, while other facility types reported decreases. The greatest increase was seen in health clubs, which saw operating expenses rise 39.8 percent to $1,343,000 in fiscal 2015. They were followed by community recreation centers, with an 11.8 percent increase, and YMCAs with a 9.8 percent increase.
The greatest decrease to average operating expenditure between 2014 and 2015 was seen among respondents from camps, who reported a 20.2 percent drop, from $1,229,000 in 2014 to $981,000 in 2015. They were followed by schools and school districts, who reported an 11.6 percent drop, parks respondents (3.9 percent) and colleges and universities (1.6 percent).
Looking forward, respondents from community recreation centers, YMCAs and parks expect to see the greatest increases in their operating expenditures between 2015 and 2017, while health clubs and schools are expecting decreases in that time frame. Community recreation center respondents expect operating expenditures to rise 13.3 percent between 2015 and 2017, to an average of $1,317,000. They were followed by YMCAs, with a 10.2 percent increase, parks (8 percent), camps (7.1 percent) and colleges (2.6 percent). Respondents from health clubs expect the greatest decrease, projecting an 8.6 percent drop in operating expenditures to an average of $1,228,000 in 2016. They were followed by schools, with a 4 percent decrease.
For the first time in our 2016 Industry Report survey, we asked respondents to consider what percentage of their operating costs were recovered via revenues. As many are well aware, more and more organizations—even nonprofits and governmental organizations—that provide recreation, sports and fitness are being asked to run more like businesses, and are thus required to recover more of their costs via revenues.
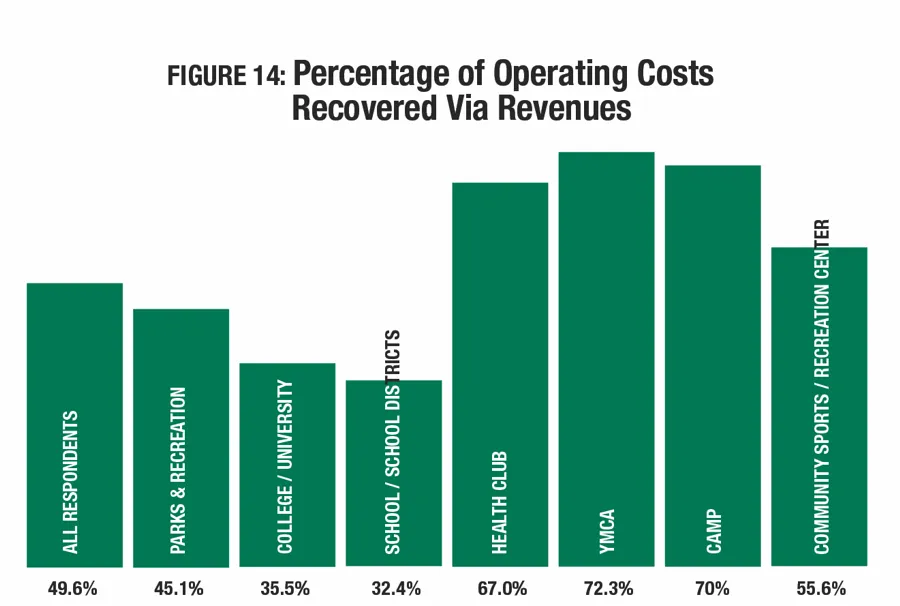
Interestingly, 22.8 percent of respondents said they recover only 0 to 20 percent of their costs via revenue, while at the same time 22.3 percent report that they recover between 80 and 100 percent of their costs via revenue. Some 17.1 percent of respondents said they recover between 90 and 100 percent of their costs. On average, for all respondents, 49.6 percent of costs are recovered via revenues, with that percentage varying widely depending on the organization type and facility type. (See Figure 14.)
Respondents from public organizations reported earning the smallest share of their operating costs back via revenues, at 42.9 percent. As might be expected, the greatest percentage was found among private for-profit organizations, at 69 percent. They were relatively closely followed by private nonprofits at 61.5 percent.
Respondents from YMCAs, camps and health clubs reported earning the highest percentage of their operating costs back via revenues. YMCAs reported that they earned 72.3 percent of operating costs, while camps earned 70 percent and health clubs earned 67 percent. They were followed by community recreation centers, at 55.6 percent.
Earning less than half of their operating costs via revenues were parks (45.1 percent), colleges (35.5 percent), and schools and school districts (32.4 percent).
While a majority of respondents (83.5 percent) reported that they had taken action to reduce their operating expenditures, that number has fallen relatively steadily over time from a high of 90.3 percent in 2011.
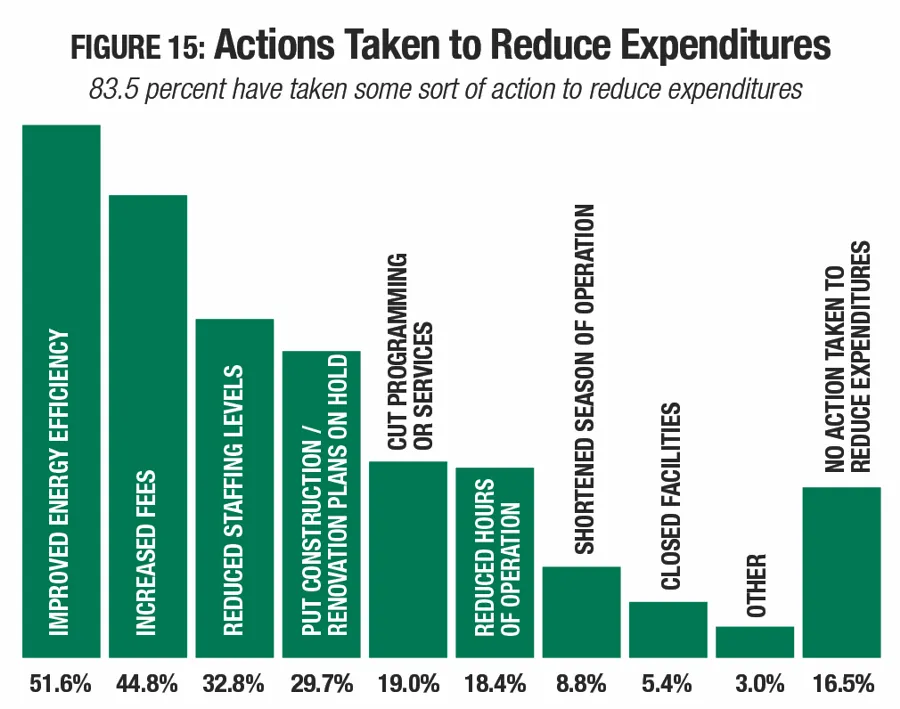
The most common action taken to reduce expenditures was improving energy efficiency. More than half (51.6 percent) of respondents reported that they had tried to improve energy efficiency in order to reduce operating expenses. (See Figure 15.) Other more commonly used methods of reducing expenditures included increasing fees (44.8 percent), reducing staffing levels (32.8 percent), and putting construction or renovation plans on hold (29.7 percent). Less common were cutting programming or services (19 percent), reducing hours of operating (18.4 percent), shortening the operating season (8.8 percent), and closing facilities (5.4 percent).
Respondents from health clubs, parks and YMCAs were the most likely to report that they had taken action to reduce their expenditures. Some 87.1 percent of health clubs, 86.3 percent of parks and 85.1 percent of YMCA respondents reported they had taken such actions. Schools respondents were the least likely to have acted to reduce operating expenses, though nearly three-quarters (74.4 percent) had done so.
Camps were more likely than any other facility type to report that they had improved energy efficiency (57.5 percent of camps had done so), increased fees (56.7 percent) or put construction plans on hold. YMCAs were the most likely to report that they had reduced staffing levels (52.6 percent). College respondents were the most likely to report that they had cut programming or services (27.7 percent), reduced their hours of operation (25.5 percent) or closed facilities altogether (7.8 percent). Parks respondents were the most likely to report that they had shortened their season of operation (12.3 percent).
Facility Usage & Membership
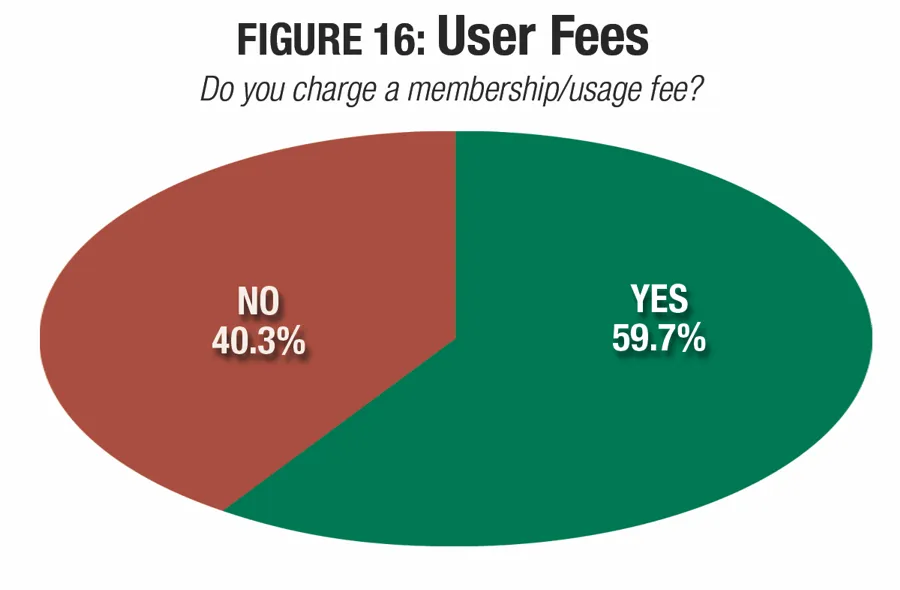
The percentage of respondents who charge a fee for membership or for using their facilities tends to hold steady year-over-year, generally falling between 55 and 60 percent. Over the past three years, this number has climbed slightly, from 55.7 percent in 2014 to 58.4 percent in 2015, and 59.7 percent in 2016. Some 40.3 percent of respondents do not change a membership or usage fee. (See Figure 16.)
Respondents from YMCAs, health clubs and community recreation centers were the most likely to charge a fee for membership or usage of their facilities. Some 93.1 percent of YMCA respondents, 90.6 percent of health club respondents and 69.3 percent of community center respondents said they charge a fee for usage of their facilities.
Conversely, schools, camps and parks were the most likely to report that they do not charge a fee for usage of their facilities. In fact, more than three-quarters (78.7 percent) of school respondents said they do not charge a membership/usage fee. They were followed by camp respondents (39.9 percent of whom do not charge a fee) and parks respondents (39.7 percent).
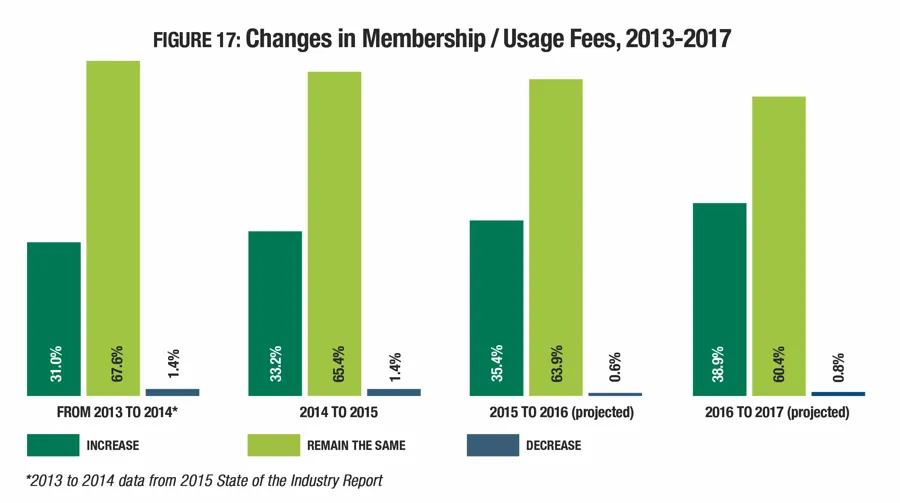
A growing number of respondents report that they have plans to increase their fees over the next several years, though a majority still indicate that they have plans to hold fees steady. Around one-third (33.2 percent) said they increased fees from 2014 to 2015. Looking forward, 35.4 percent plan to increase fees in 2016, and 38.9 percent will increase fees in 2017. (See Figure 17.) At the same time, the number of respondents who plan to keep fees the same falls from 67.6 percent in 2014 to 60.4 percent in 2017.
Of those facilities that do charge a fee for membership or usage, those from camps, YMCAs and health clubs were the most likely to report that they had raised their fees from 2014 to 2015, while those from schools were the least likely to raise fees in that time period. Some 53.7 percent of camp respondents who charge a fee said they had increased that fee in 2015. They were followed by YMCAs (47.2 percent) and health clubs (40.4 percent). Only 22.2 percent of school respondents who charge a fee said they had increased that fee in 2015.
Looking forward, camps continue to be the most likely to plan fee increases, while college respondents are the least likely to plan to increase fees. Some 57.3 percent of camp respondents said they would increase fees in 2016, and 51.9 percent plan to increase fees in 2017. They were followed by health clubs, 42.9 percent of whom plan fee increases in 2016 and 51.9 percent in 2017. Around one-quarter of college respondents who charge a fee said they plan to increase that fee in 2016 (25.5 percent will do so) and in 2017 (24.8 percent).
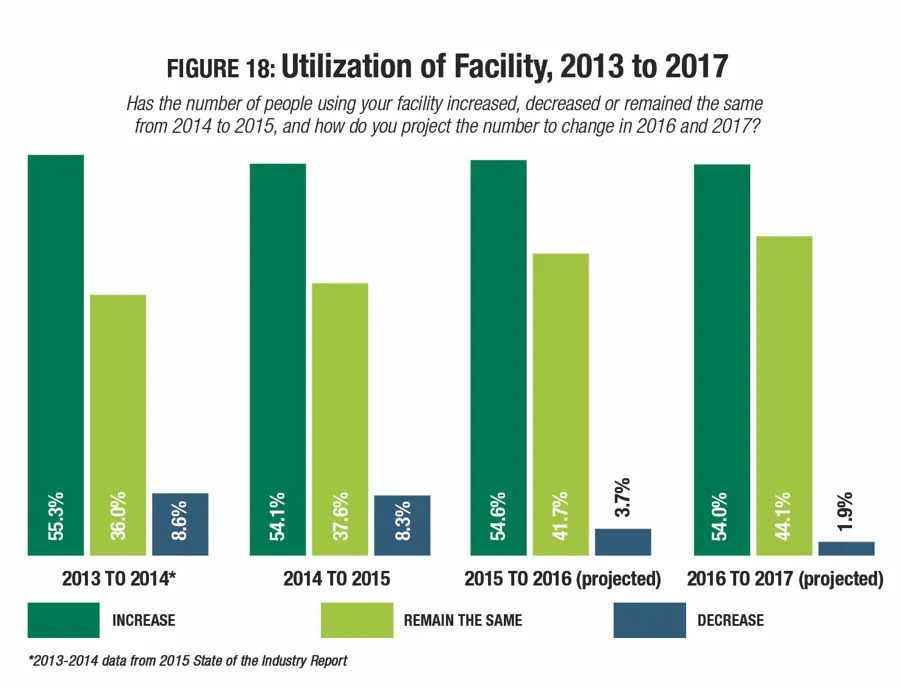
In 2015, some 59.8 percent of respondents said they expected usage of their facilities to increase from 2014 to 2015. This year, 54.1 percent reported that such an increase had taken place, while 8.3 percent said the number of people using their facilities had decreased. (See Figure 18.)
Looking ahead, more than half of respondents also expect utilization of their facilities to increase in 2016 (54.6 percent) and in 2017 (54 percent). At the same time, just 3.7 percent expect a decrease in 2016, and 1.9 percent projected a decrease in 2017.
Respondents from urban communities were 10 percent more likely to report an increase in the number of people using their facilities from 2014 to 2015 than those from rural communities. Some 58.8 percent of urban respondents said usage had increased in that time period, compared with 48.8 percent of rural respondents. Among suburban respondents, 55.9 percent reported that utilization had increased from 2014 to 2015. At the same time, 9.8 percent of rural respondents reported decreasing usage, compared with 7.4 percent of urban and 7.2 percent of suburban respondents.
Looking forward, urban respondents continue to be most likely to see increasing usage of their facilities, with rural respondents least likely to expect increases. From 2015 to 2016, 60.3 percent of urban respondents said they expect usage of their facilities to increase. They were followed by suburban respondents (54.7 percent) and rural respondents (51.2 percent). From 2016 to 2017, 58.3 percent of urban respondents, 54.8 percent of suburban respondents and 50.2 percent of rural respondents expect utilization of their facilities to increase.
From 2014 to 2015, respondents from parks, community recreation centers and camps were the most likely to report that the number of people using their facilities had increased, while those from health clubs and YMCAs were the most likely to report a decrease. Some 60.7 percent of parks respondents said usage of their facilities increased from 2014 to 2015. They were followed by community recreation centers (60 percent) and camps (55.8 percent). At the same time, 19.4 percent of health club respondents reported decreases in usage of their facilities, followed by YMCAs (18.3 percent).
Looking forward, health club respondents are the most likely to expect increasing usage of their facilities in 2016 and 2017. From 2015 to 2016, 68.9 percent of health club respondents expect usage to increase. They were followed by parks respondents (61.8 percent expect an increase) and YMCAs (53.8 percent). From 2016 to 2017, 77.8 percent of health club respondents expect to see usage of their facilities grow. In that time frame, 60.1 percent of parks respondents and 57.6 percent of camp respondents also expect to see increasing utilization of their facilities.
Staffing
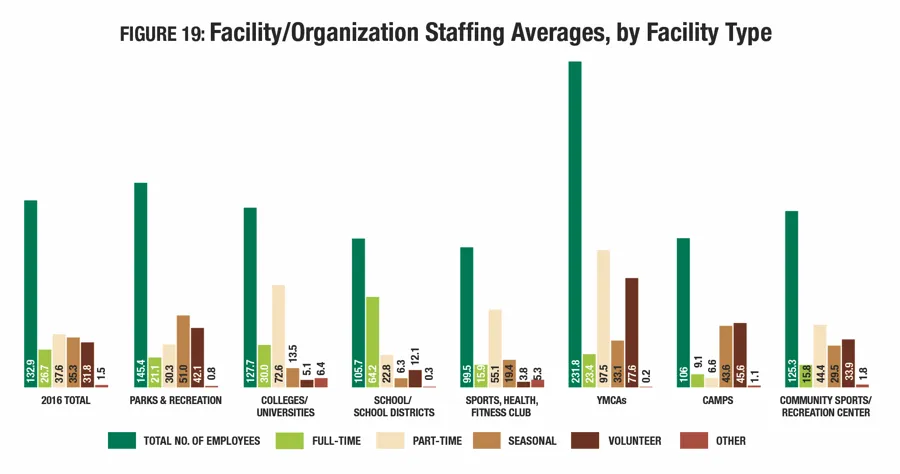
The average number of people employed at the organizations covered by the survey has increased slightly over the past three years, rising 5.2 percent from an average of 126.3 in 2014 to 132.9 in 2016. This includes 26.7 full-time workers (up from 25.6 in 2015); 37.6 part-time workers (up from 34.8); 35.3 seasonal workers (up from 34.4); 31.8 volunteers (up from 30.3); and 1.5 other workers. (See Figure 19.)
YMCAs continue to employ more people than any other facility type by far, with an average of 231.8 employees. They were followed by parks and recreation respondents, who employed 145.4 people on average, and colleges and universities, with 127.7. Health clubs employ the smallest staffs, at 99.5 on average, though this is a sharp increase from 2015, when health clubs employed an average of 76.8 people.
Schools and school districts employ the largest number of full-time workers, at 64.2. They are followed distantly by colleges, with an average of 30 full-time employees.
YMCAs employ more part-time workers than other types of facilities, with 97.5 part-time workers, on average. They are followed by colleges and universities, with an average of 72.6 part-time workers.
Seasonal employees are employed in the highest numbers by parks respondents. Parks respondents said they employ an average of 51 seasonal workers. They are followed by camps, with an average of 43.6.
YMCAs employ the greatest number of volunteers, with an average of 77.6. They are followed by camps, with an average of 45.6.
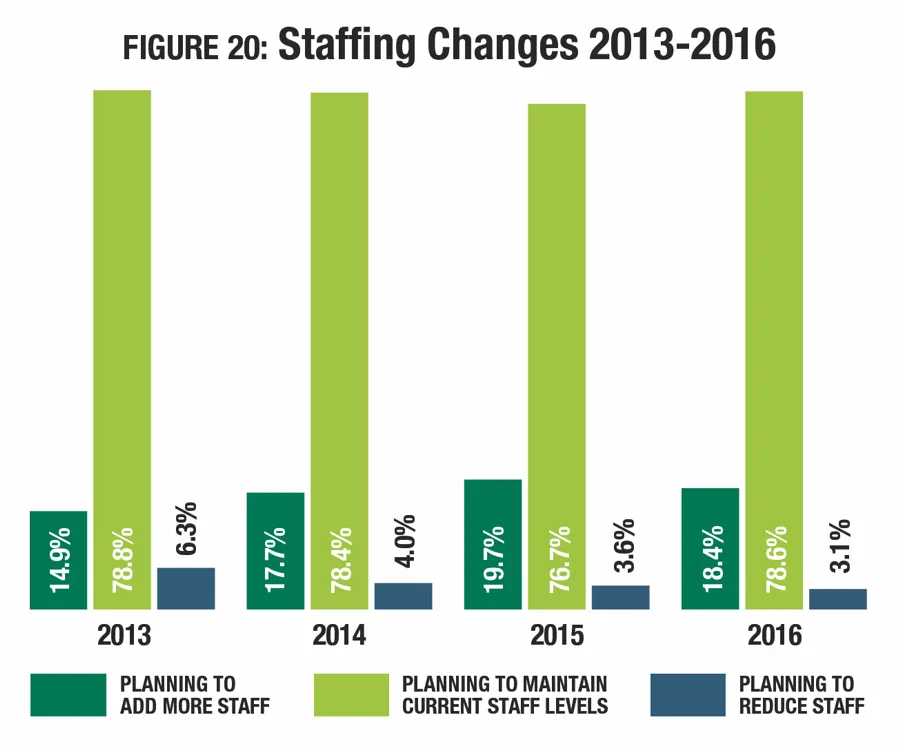
Over the past five years, the percentage of respondents planning to grow or maintain their current staff levels has been steadily increasing. While 7.1 percent of respondents in 2012 planned to reduce their staff, in 2016 that percentage has fallen to 3.1 percent. More than three-quarters (78.6 percent) of 2016 respondents said they will maintain existing staff numbers, and 18.4 percent plan to add more staff in the coming year. (See Figure 20.)
On average, respondents are planning to add 20.8 employees in the coming year, down slightly from 2015 when respondents planned to add 25.1 new employees This will include, on average, seven seasonal employees, 5.7 volunteers, 4.8 part-time workers, 2.7 full-time workers and 0.6 others. Those with the plans to hire the greatest number of employees in the coming year include YMCAs (who plan to hire 44.7, on average), parks (23.3) and community recreation centers (18.4).
Community recreation centers, parks and colleges are the most likely to report that they have plans to add any staff. Nearly a quarter (24.7 percent) of community recreation center respondents indicated that they had such plans. They were followed by parks respondents (20.6 percent will add staff) and colleges and universities (18.6 percent).
Respondents from YMCAs, camps and schools were the most likely to report that they had plans to reduce staff, though the number who had such plans was small in every case. Nearly one in 10 (9.5 percent) YMCA respondents said they had plans to reduce staff. They were followed by camps (5.1 percent of whom plan to reduce staff) and schools (4.1 percent).
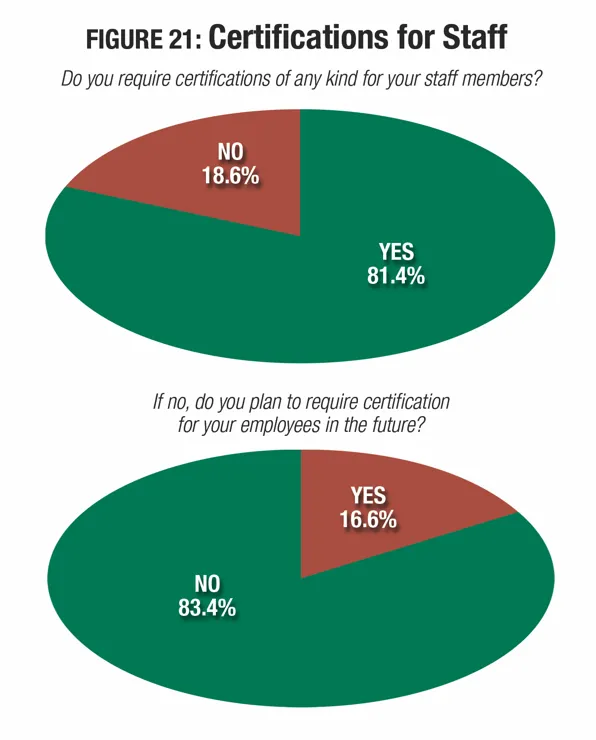
A majority of respondents require at least some of their staff members to earn and maintain specific certifications, often a tool for measuring and verifying specific types of knowledge and skill specific to a field. In 2016, 81.4 percent of respondents said they require certifications for their staff. Of those who do not currently require certification, 16.6 percent said they will require it in the future. (See Figure 21.)
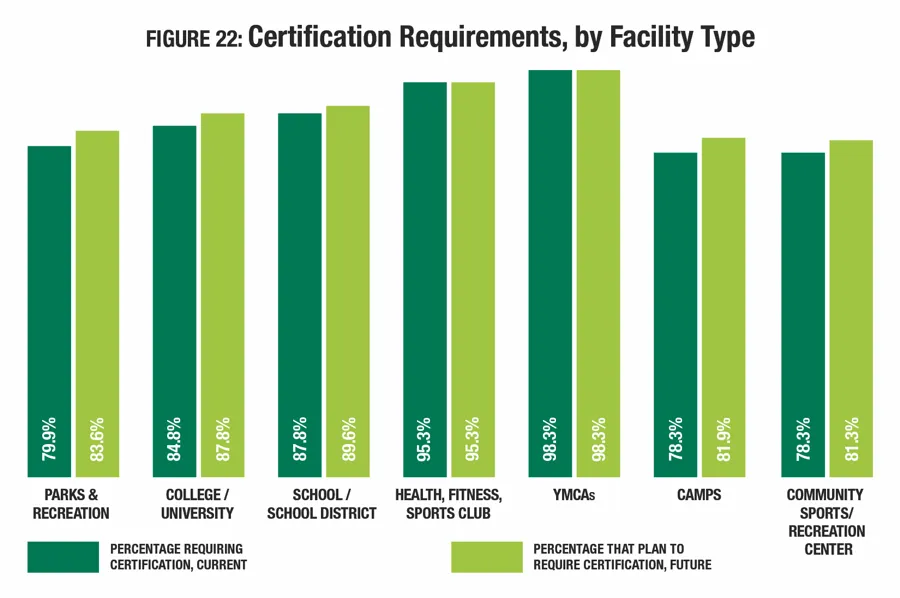
Respondents from YMCAs, health clubs and schools are the most likely to require certification of staff members, both now and in the future. Some 98.3 percent of YMCAs said they currently require certifications, and the same number will continue to require them in the future. They were followed by health clubs, where 95.3 percent currently require certifications and will continue to do so. Finally, 87.8 percent of school respondents said they currently require certification, and 89.6 percent will require it in the future. (See Figure 22.)
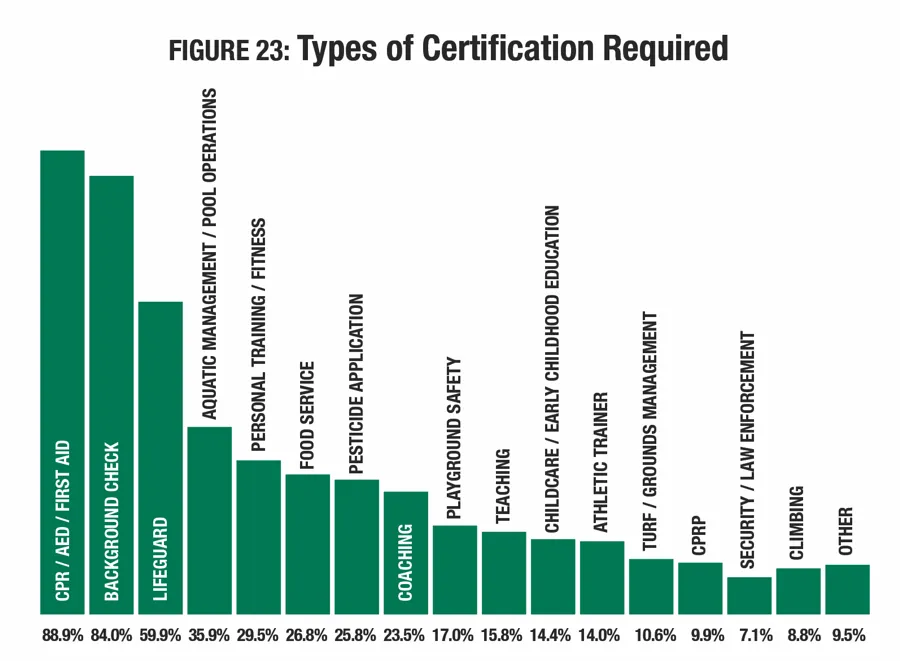
A majority of respondents that require certification of any kind require certification in CPR/AED/ First Aid, as well as a background check. (See Figure 23.) Some 88.9 percent of these respondents said they require CPR/AED/First Aid certification, and 84 percent require a background check. More than half (59.9 percent) require a lifeguard certification, and more than a third (35.9 percent) require aquatic management and pool operations certification. More than a quarter require personal training/fitness certification (29.5 percent), food service certification (26.8 percent) or pesticide application certification (25.8 percent).
Respondents from facilities that include aquatic elements are more likely to require lifeguard and aquatic management certifications. While 59.9 percent of all respondents who require certification ask that some staff members achieve lifeguard certification, for those with aquatic elements, that number jumps to 86.4 percent. And while 35.9 percent of all respondents require aquatic management/pool operations certifications, 56 percent of those with aquatics require this type of certification.
Just as they were most likely to require certification at all, YMCAs were the most likely to require many specific types of certification. YMCA respondents were more likely than others to require CPR/AED/First Aid certification (97.4 percent); background checks (94.7 percent); lifeguard certification (83.3 percent); aquatic management and pool operations certification (49.1 percent); and childcare/early childhood education certification (53.5 percent).
Respondents from health clubs were more likely than others to require personal training or fitness certification (77 percent); and athletic trainer certifications (39.3 percent).
Respondents from camps were the most likely to require foodservice certifications (55.6 percent); and climbing certifications (40.7 percent).
Respondents from parks were most likely to require pesticide application certification (41.9 percent); playground safety certification (35.6 percent); turf/grounds management certification (14.2 percent); Certified Parks and Recreation Professional (CPRP) certification (21.1 percent); and security or law enforcement certification (8.6 percent).
Finally, respondents from schools were more likely than others to require coaching certification (70.1 percent) and teaching certifications (67 percent).
Facilities & Construction Plans
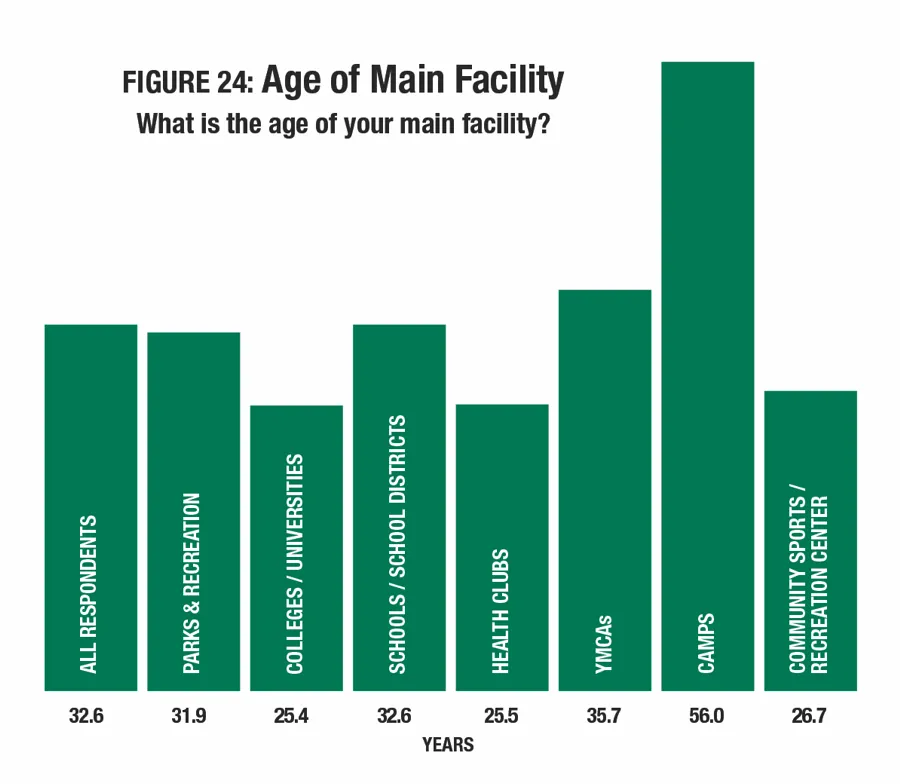
Beginning in 2013, we have asked survey participants how old their main facility is. In that time, facilities have aged from an average of 27.5 years in 2013 to 32.6 years in 2016. Only 6.6 percent of respondents said their main facility was 5 years old or less. Another 21.4 percent said their facilities were between 11 and 20 years old. Some 29.2 percent said their main facility was between 21 and 40 years old. A full 31.7 percent of respondents have facilities that are at least 41 years old. And 15.6 percent of all respondents said their main facility is 50 years old or older.
The newest facilities, on average, are found among colleges and universities, as well as health clubs. Respondents from colleges and universities said their main facility is 25.4 years old on average, while for health clubs, facilities average 25.5 years. (See Figure 24.)
The oldest facilities are found among camp respondents, who report that the average age of their main facility is 56 years old. They were followed by YMCAs, with an average facility age of 35.7 years, and schools and school districts, which averaged 32.6 years.
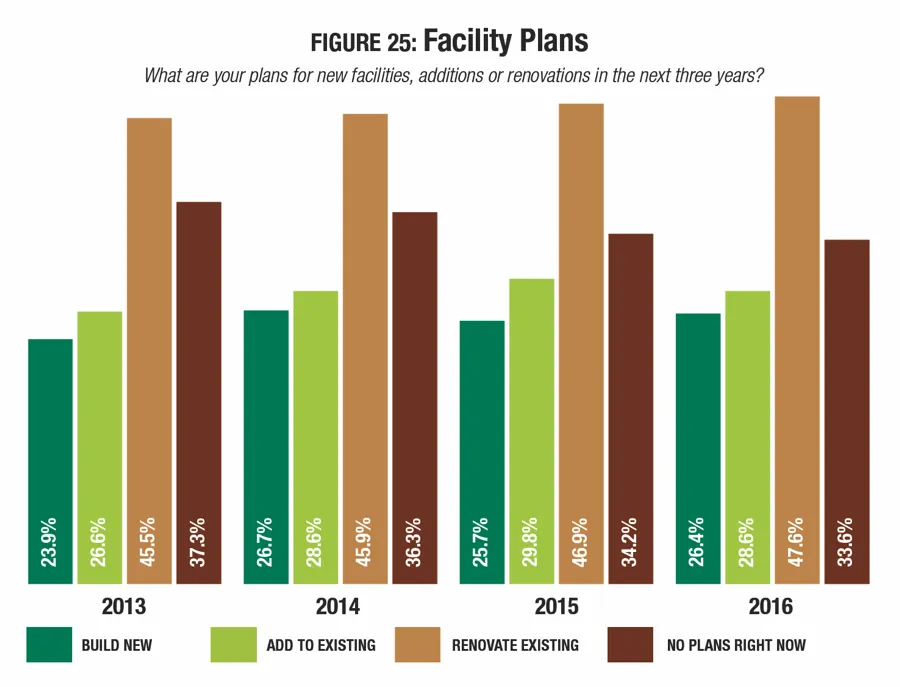
Considering the aging nature of the facilities covered in this report, it should come as no surprise that an increasing number of respondents are considering construction, whether that means building new facilities, or making additions or renovations to existing facilities. In fact, since 2013, the percentage of respondents who have any construction plans has grown from 62.7 percent to 66.4 percent. (See Figure 25.)
The number of respondents with plans to build new facilities grew this year from 25.7 percent in 2015 to 26.4 percent in 2016. Likewise, the number who are planning to renovate existing facilities increased, from 46.9 percent to 47.6 percent. There was a slight decrease in the number of respondents with plans to make additions, from 29.8 percent to 28.6 percent.
Given that they have the oldest facilities on average, it should come as no surprise that camp respondents are the most likely to report that they have plans for construction. More than eight out of 10 (81.2 percent) of camp respondents said they had plans for construction. They were followed by parks respondents (74.7 percent of whom have construction plans) and community recreation centers (68.1 percent).
Respondents from schools and from health clubs were the least likely to report that they had plans for construction. Some 52 percent of school respondents and 56.3 percent of health club respondents have plans for construction.
Camp respondents were the most likely to have plans to build new facilities. Some 39.9 percent of camp respondents said they had plans for new construction. They were followed by parks, one-third (33.3 percent) of whom said they would be building new, and colleges and universities, where 24.1 percent of respondents have such plans.
Additions are also most commonly planned by camp respondents, with well over one-third (35.5 percent) indicating they would be making additions to their existing facilities. They were followed by community recreation centers (33.1 percent) and parks respondents (30.1 percent).
Finally, renovations were also most commonly planned by camp respondents. In fact, a majority (63.8 percent) of camp respondents said they had plans for renovations to their existing facilities. They were followed by parks, where more than one-half (55.7 percent) had renovation plans, and YMCAs, where 45.7 percent had such plans.
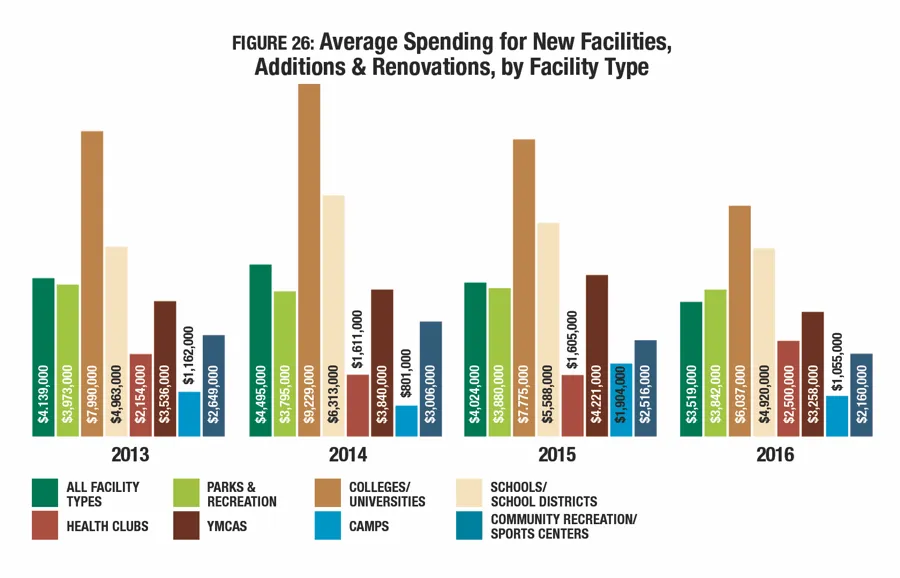
On average, respondents are planning to spend $3,519,000 on their construction plans, down 12.5 percent from 2015's average construction cost of $4,024,000. (See Figure 26.) Since 2011, the average budget for construction plans has wavered, but overall it has decreased by 10.7 percent, from $3,942,000 in 2011.
The only facility type that saw an increase in its average construction budget was health clubs. Among health club respondents, the average budget for construction grew 55.8 percent from $1,605,000 in 2015 to $2,500,000 in 2016. Respondents from camps reported the greatest decrease in average construction budgets, reporting a drop of 44.6 percent from $1,904,000 on average in 2015 to $1,055,000 in 2016. They were followed by YMCAs, which saw a drop of 22.8 percent and colleges and universities, with a decrease of 22.4 percent.
The highest spending on facilities is still found among colleges and universities, as well as schools and school districts. College respondents plan to spend 71.6 percent more on construction than the average for all facilities, while schools will spend 39.8 percent more. Parks respondents follow, spending 9.2 percent more than the average for all facilities.
The lowest spending is found among camps respondents, who plan to spend 70 percent less than the average for all facilities, followed by community recreation centers, spending 38.6 percent less, and health clubs at 29 percent.
Respondents from private nonprofit organizations saw the greatest decrease in their construction spending plans from 2015 to 2016, reporting a drop of 14 percent, from an average of $3,753,000 in 2015 to $3,227,000 in 2016. They were followed by private for-profit organizations, at 13.5 percent and public organizations, at 13.1 percent.
Public organizations planned to spend the most on their construction in 2016, as in past years, spending 10.2 percent more than the average for all organization types, at $3,877,000. Private nonprofits were planning to spend 8.3 percent less than the average for all organization types, while private for-profits were planning to spend 47.1 percent less.
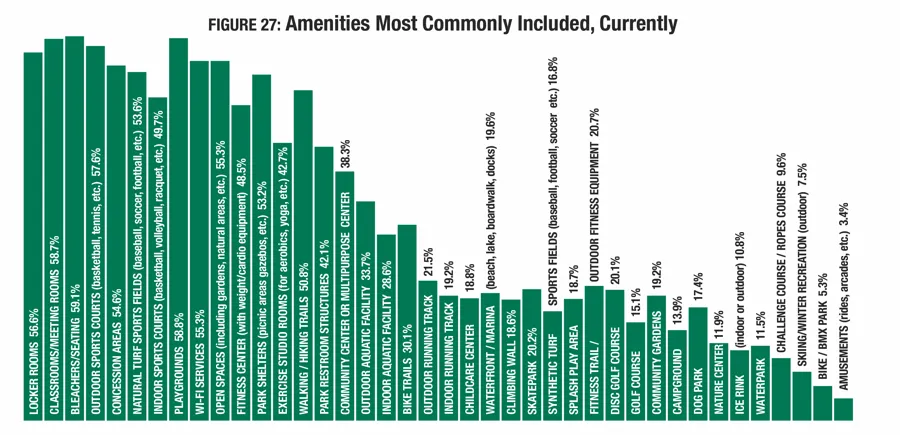
The top amenities included in respondents' facilities in 2016 include: bleachers and seating (59.1 percent of respondents have them in their facilities); playgrounds (58.8 percent); classrooms and meeting rooms (58.7 percent); outdoor sports courts (57.6 percent); locker rooms (56.6 percent); Wi-Fi services (55.3 percent); open spaces such as gardens and natural areas (55.3 percent); concession areas (54.6 percent); natural turf sports fields (53.6 percent); and park shelters (53.2 percent). (See Figure 27.)
There was an increase of at least 2 percent from 2014 to 2015 in the number of respondents whose facilities included: playgrounds, Wi-Fi services, open spaces, park shelters, walking and hiking trails, bike trails, skateparks, fitness trails or outdoor fitness equipment, disc golf courses, and dog parks.
Parks respondents were more likely than other facility types to include: playgrounds (83.7 percent of parks respondents had playgrounds); park shelters (83.5 percent); park restrooms (77.3 percent); outdoor sports courts (70.9 percent); community centers (55.5 percent); bike trails (50.1 percent); skateparks (41 percent); dog parks (34.8 percent); community gardens (32.9 percent); disc golf courses (31.4 percent); fitness trails or outdoor fitness equipment (30.9 percent); splash play areas (29.4 percent); golf courses (21.5 percent); waterparks (18.2 percent); ice rinks (17.8 percent); and bike or BMX parks (10.3 percent).
Respondents from colleges were more likely than others to include indoor sports courts (78.5 percent of college respondents included them); indoor walking/running tracks (52.3 percent); and synthetic turf sports fields (43.5 percent).
School respondents were more likely than other facilities to include: bleachers and seating (77.8 percent of school respondents had bleachers and seating); natural turf sports fields (71 percent); concessions (67.9 percent); and outdoor tracks (66.1 percent).
Respondents from health clubs were more likely than other types of facilities to include Wi-Fi, with 75 percent of health clubs indicating they offered Wi-Fi at their facility.
YMCAs were more likely than other facility types to include: locker rooms (89.7 percent of YMCA respondents included them); fitness centers (88.8 percent); exercise studios (84.5 percent); childcare facilities (72.4 percent); classrooms and meeting rooms (71.6 percent); and indoor aquatic facilities (69.8 percent).
Camp respondents were more likely than other facility types to report that they had: open spaces and natural areas (75.4 percent of camp respondents included open spaces); walking and hiking trails (74.6 percent); waterfront or marinas (54.3 percent); campgrounds (52.2 percent); challenge courses or ropes courses (47.8 percent); climbing walls (43.5 percent); outdoor aquatic facilities (43.5 percent); nature centers (28.3 percent); and skiing or winter recreation (13.8 percent).
Finally, community centers were more likely than others to include amusement, with 6 percent of community recreation center respondents saying their facilities included them.
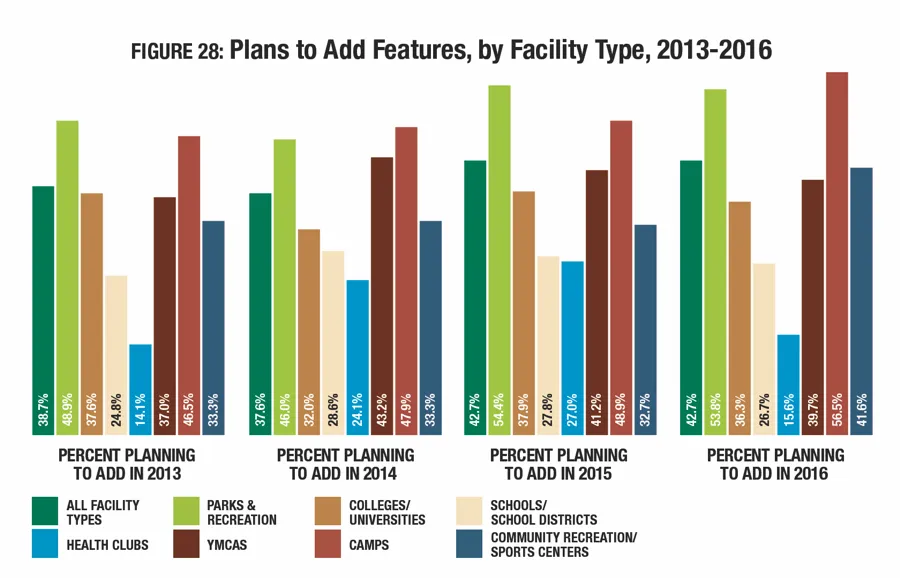
Some 42.7 percent of all respondents reported that they had plans to add features at their facilities over the next several years. (See Figure 28.) Camp respondents were the most likely to have such plans, with 56.5 percent indicating they would be adding features. They were followed by parks (53.8 percent) and community recreation centers (41.6 percent). Respondents from health clubs were the least likely to be planning to add features, with 15.6 percent reporting they had such plans.
Programming
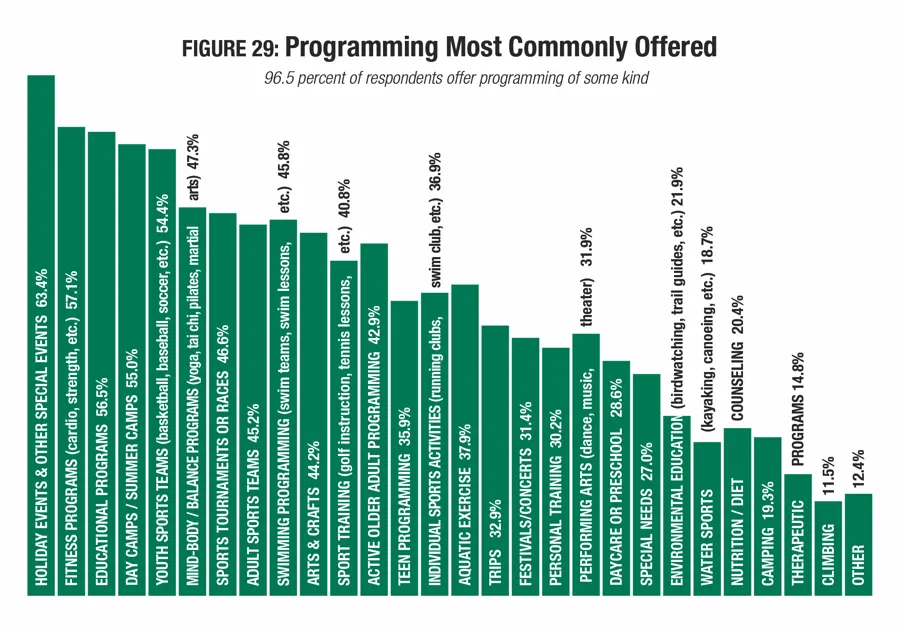
There was little change from 2015 to 2016 in the top types of programming most commonly found among respondents' facilities. These include: holiday events and other special events (provided by 63.4 percent of respondents); fitness programs (57.1 percent); educational programs (56.5 percent); day camps and summer camps (55 percent); youth sports teams (54.4 percent); mind-body/balance programs such as yoga and tai chi (47.3 percent); sports tournaments and races (46.6 percent); swimming programs (45.8 percent); adult sports teams (45.2 percent); and programs for active older adults (42.9 percent). (See Figure 29.)
YMCAs, health clubs and community recreation centers were the most likely to offer any kind of programming. A full 100 percent of YMCA respondents said they offer programming of some kind, followed by health clubs (98.4 percent) and community recreation centers (98.2 percent).
YMCA respondents were more likely than other facility types to include: holidays and other special events; fitness programs; educational programs; day camps and summer camps; youth sports teams; mind-body balance programs such as yoga; sports tournaments and races; swimming programs; arts and crafts; programs for active older adults; aquatic exercise; teen programming; trips; performing arts; personal training; day care or childcare; special needs programs; nutrition and diet counseling; and therapeutic programs.
Camp respondents were more likely than those from other facility types to offer: environmental education programs; camping; water sports such as kayaking; and climbing programs.
Respondents from park facilities were most likely to offer adult sports teams; sport training programs; and festivals or concerts.
College respondents were more likely than others to offer individual sports activities.
Some 31 percent of respondents said they had plans to add additional programs over the next several years, down slightly from 2015, when 32.2 percent had such plans. The 10 most commonly planned program additions in 2016 include:
- Educational programs (planned by 27.1 percent of those who will be adding programs)
- Fitness programs (26.1 percent)
- Mind-body/balance programs (25 percent)
- Teen programming (24.2 percent)
- Programs for active older adults (19.8 percent)
- Environmental education (19.7 percent)
- Arts & crafts (18.8 percent)
- Day camps and summer camps (18.3 percent)
- Sports tournaments and races (18.1 percent)
- Holiday events and other special events (17.7 percent)
More respondents in 2016 than in 2015 said they would be adding: fitness programs (26.1 percent vs. 24.9 percent); educational programs (27.1 percent vs. 24.3 percent); teen programming (24.2 percent vs. 20.4 percent); and active older adult programs (19.8 percent vs. 19.4 percent).
Respondents from community recreation centers, parks and YMCAs were the most likely to report that they had plans to add programs at their facilities over the next several years.
Some 38.6 percent of community recreation center respondents said they had plans to add programs. The most commonly planned programs among these respondents were teen programs (34.4 percent of those planning to add programs will add teen programs); fitness (31.3 percent); and mind-body balance programs (31.3 percent).
Among parks respondents, 38.2 percent said they had plans to add programming, with the most popular additions being teen programs (30.2 percent of those with plans to add programs); educational programs (28.4 percent); and environmental education (28.4 percent).
Nearly a third (32.8 percent) of YMCA respondents said they planned to add programs at their facilities, with the most commonly planned additions including performing arts (39.5 percent of those with plans to add programs); teen programs (34.2 percent); and environmental education (23.7 percent).
Challenges & Issues of Concern
While budgets and the economy always hold the top spot as the primary concern for most respondents, there are other issues that can arise to challenge facility managers as they operate and manage recreation sports and fitness facilities. Equipment and facility maintenance has been the top concern for several years running, and 2016 is no exception. Some 56.2 percent of respondents said this is a top concern for them right now. (See Figure 30.)
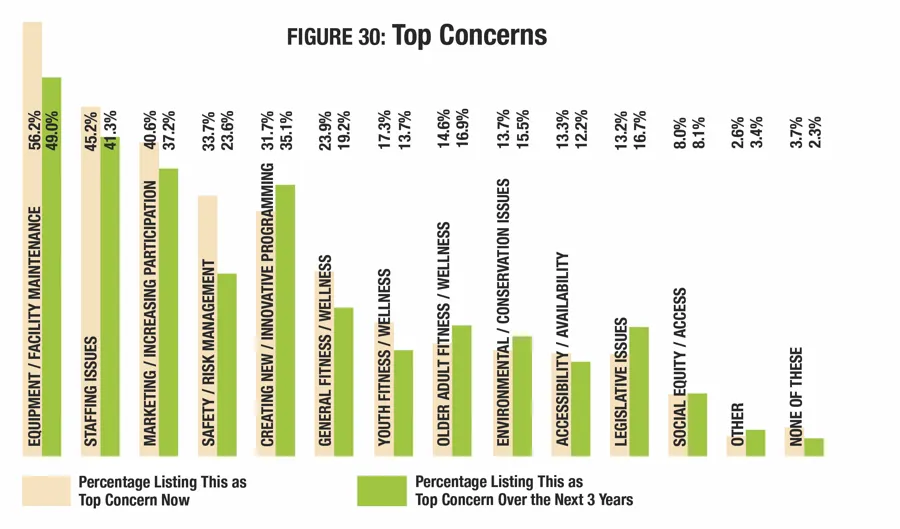
Staffing jumped back to the No. 2 spot in 2016, with 45.2 percent reporting it is a top concern, up from 42.9 percent in 2015.
No. 3 on the list was marketing and increasing participation, with 40.6 percent indicating this is their top concern, down from 43.9 percent in 2015.
Safety and risk management once again takes the No. 4 spot, with 33.7 percent calling this their top concern, up from 33.4 percent.
Finally, creating new and innovative programming is a top concern for 31.7 percent of respondents.
For the most part, the top current concerns drop off over the next three years, and fewer participants name them as a top issue. Exceptions to that rule in 2016 include: creating new and innovative programming, which increases from 31.7 percent who feel it is a concern now to 35.1 percent who believe it will be a top concern over the next three years; older adult fitness and wellness (14.6 percent vs. 16.9 percent); environmental and conservation issues (13.7 percent vs. 15.5 percent); legislative issues (13.2 percent vs. 16.7 percent); and social equity and access (8 percent vs. 8.1 percent).
