


A Look at What's Happening in Recreation, Sports and Fitness Facilities

Every June, we bring you the results of our extensive survey to present the State of the Industry Report. Now in its 11th year, the report summarizes the opinions and information provided by a wide range of professionals working in the recreation, sports and fitness industry. Here is our most up-to-date information, offering an in-depth glimpse into various facets of the market, including budgets, staffing, building plans, programs and more.
With the onset of the Great Recession nearly 10 years ago, the Industry Survey results reflected a big hit to operating budgets, revenues, construction plans and, let's face it, optimism about the future. But as the economy began to recover, things have gradually turned around. To be sure, things have recovered more quickly in some sectors of the industry than others, but at this point, across the board, most facilities have adapted to the new realities. This includes, in some cases, finding ways to reduce operating costs, partnering with other organizations to achieve more with less, and earning more revenue to support operations. But in terms of optimism, one can see in the growing number of respondents who plan to build new or renovate existing facilities, as well as those who plan to add staff and programs, that the recreation, sports and fitness industry is made up of innovative, evolving and forward-looking professionals.
Over the course of these 70- or 80-something pages, we'll provide a detailed look at the responses collected via our annual survey, showing you the current state of affairs, as well as providing an idea of future trends that will have an impact on the management, construction, planning, programming, marketing, staffing and operations of recreation, sports and fitness facilities, from parks and campgrounds to recreation centers and fieldhouses, from aquatic parks and sports fields to health clubs and community centers.
Before we get into the thick of it, let me take a moment to express my deepest gratitude to the readers who took the time to participate in our extensive survey. The fact that you will take the time to provide this detailed information makes it clear that this industry is important to you, and that the end result, which you hold in your hands, matters. We could never put together this report without you. Thank you!
Survey Methodology
This report is based on a survey conducted for Recreation Management by Signet Research Inc., an independent research company. An e-mail was broadcast and respondents were invited to participate. From the launch of the survey on Feb. 7, 2017, to the closing of the survey on Feb. 27, 2017, 1,743 returns were received. The findings of this survey may be accepted as accurate, at a 95 percent confidence level, within a sampling tolerance of approximately +/- 2.3 percent.
The report begins with a general summary of the survey results, considering how the entire survey population of more than 1,700 respondents answered. In addition, here and there we will break down survey responses to show how they vary in terms of organization type, community type and industry sector. Then, on the following pages, we'll break the data down and take a closer look at more specific information. This begins on page 40 with a look at the results broken down by regions of the country. From there, we'll take an in-depth look at the responses from participants whose facilities include aquatic elements (see page 50). After that, we'll break things down according to the largest segments of our survey population, which includes parks and recreation organizations (see page 64), colleges and universities (see page 72), schools and school districts (see page 78), health clubs (see page 84), and Ys, JCCs and Boys & Girls Clubs (see page 88). Once you've waded through all of this information, head over to our website at RecManagement.com, where we'll provide exclusive online stories looking more closely at camps and community centers. Also, stay tuned in to our Rec Report newsletter, where we'll provide additional information that is not published in this report. And finally, be sure to keep an eye out for the July 2017 issue, where we'll discuss career and salary trends in our annual Salary Survey report.
Who Are You?
For the most part, respondents typically represent higher-level positions within their organizations. Nearly one-third (32.7 percent) of respondents said their job title was "director." Just over one-fifth (20.8 percent) are in administration and management positions, including titles such as administrator, manager and superintendent. Some 16.5 percent of respondents are operations/facility managers, with titles including operations manager, facility manager, building manager or supervisor. Program and activity administration roles are held by 9.3 percent of respondents, including titles such as activity or program director, manager, coordinator, specialist, coach or instructor. Another 8.9 percent of respondents said they are the chairman, CEO, president, vice president or owner of their organization. Some 3.3 percent of respondents are faculty or teachers. Just 0.7 percent of respondents are in service roles, which includes planners, designers, architects and consultants. Finally, 7.8 percent of respondents said they have "other" job titles in their organization.
Given that the majority of respondents hold positions of higher responsibility and achievement, we can also assume that the majority of respondents have plenty of experience on the job. And, in fact, respondents reported that they have been in their current position for an average of 11.3 years, and have 21.7 years of experience in the recreation, sports and fitness industry.
The largest number of respondents in 2017 were from the Midwest, though that number did fall slightly from 2016. Nearly three in 10 (29.9 percent) of respondents in 2017 were from the Midwest, compared with 31.2 percent in 2016. This includes Illinois, Indiana, Iowa, Kansas, Michigan, Minnesota, Missouri, Nebraska, North Dakota, Ohio, South Dakota and Wisconsin. (See Figure 1.)
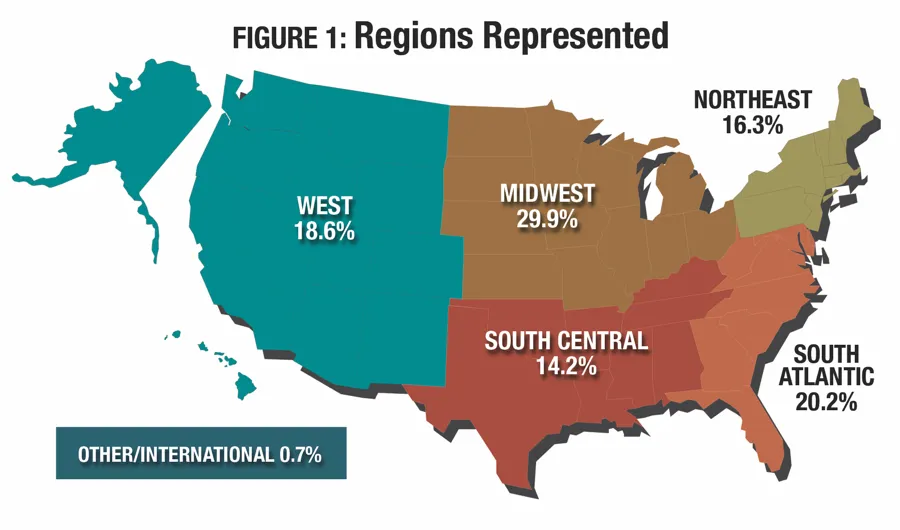
The second largest region, in terms of survey representation was the South Atlantic, which saw a jump from 16.8 percent of respondents in 2016 to 20.2 percent this year, the first time this region has reached the No. 2 spot in the survey. This includes Delaware, Florida, Georgia, Maryland, North Carolina, South Carolina, Virginia, Washington, D.C., and West Virginia.
The West was represented by 18.6 percent of respondents, down from 21.4 percent in 2016. This region includes Alaska, Arizona, California, Colorado, Hawaii, Idaho, Montana, Nevada, New Mexico, Oregon, Utah, Washington and Wyoming.
Some 16.3 percent of respondents said they were from the Northeast, a slight drop from 2016, when 17.6 percent of respondents came from this region. The Northeast includes Connecticut, Maine, Massachusetts, New Hampshire, New Jersey, New York, Pennsylvania, Rhode Island and Vermont.
Finally, the South Central region, though it was the smallest in terms of representation, saw a slight increase this year, with 14.2 percent of respondents calling this part of the country home (compared with 12.1 percent in 2016). This region includes Alabama, Arkansas, Kentucky, Louisiana, Mississippi, Oklahoma, Tennessee and Texas.
Finally, just 0.7 percent of survey respondents said they were from outside the United States.
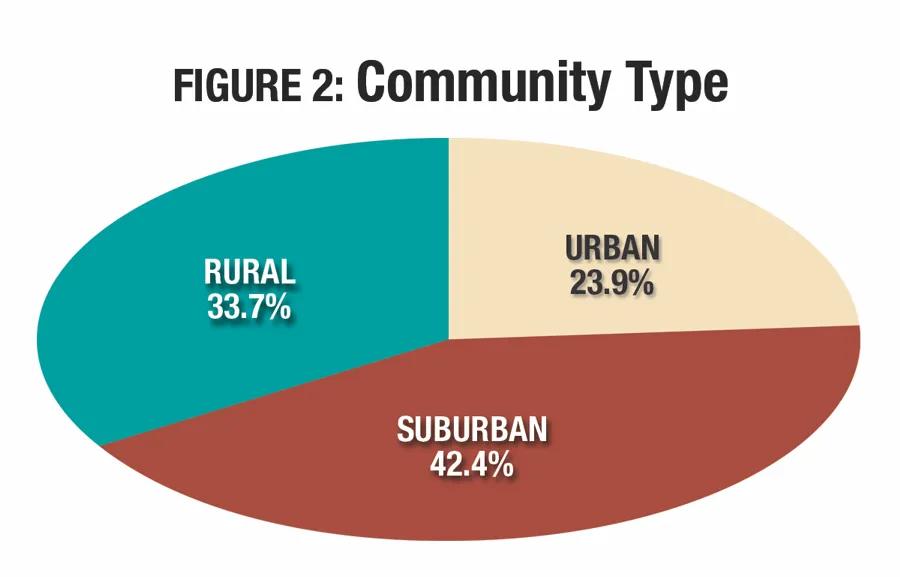
The largest percentage of respondents said that they were from suburban communities, with 42.4 percent reporting that they called the suburbs home. Just over a third (33.7 percent) of respondents said they were from rural areas, and 23.9 percent were from urban communities. (See Figure 2.)
On average, the facilities, districts and departments covered by the Industry Report survey serve a population of 98,400 people. (See Figure 3.) This is 18.3 percent higher than 2016, when the average population served was 83,200. Despite this, nearly two-thirds of respondents (65.4 percent) said their facilities reach an average of 50,000 or fewer people. More than one-third (34.9 percent) serve a population of less than 10,000. Another 12.6 percent said they reach a population of between 50,000 and 99,999 people. Some 8.5 percent said their facilities reach a population between 100,000 and 199,999. Finally, 13.5 percent said they reach a population of 200,000 or more.
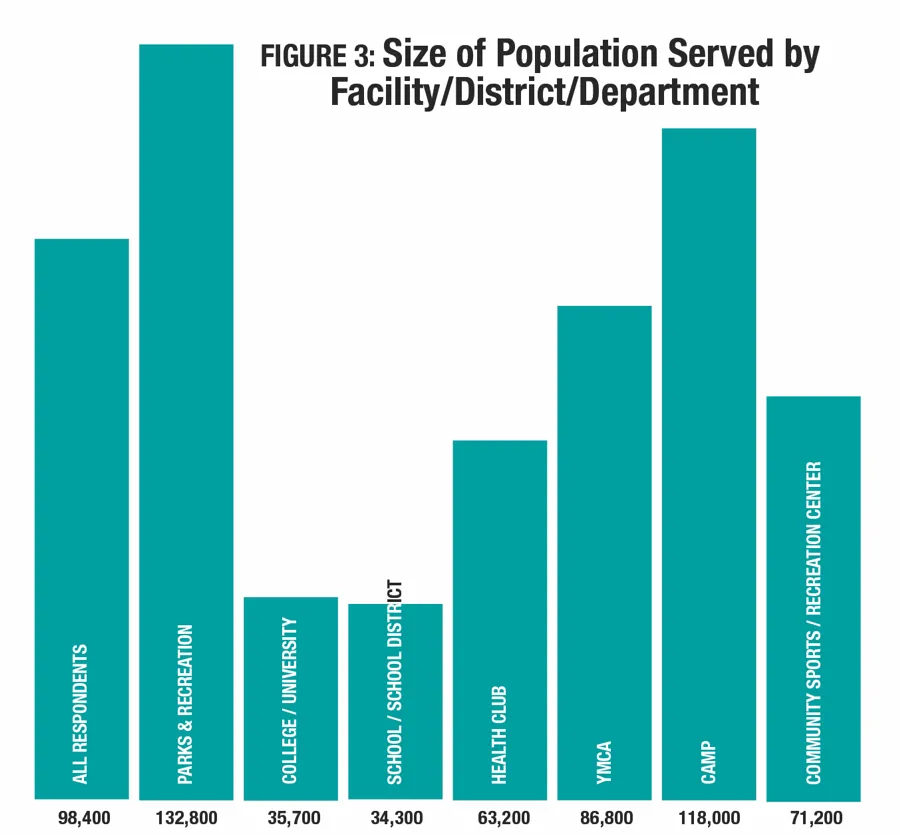
Parks and recreation respondents reach the largest populations with their facilities, on average, reaching 132,800, a significant increase from 2016 when these respondents reached 105,300, on average. They were followed by camps, with an average population served of 118,000; Ys, with 86,800; and community recreation and sports centers, with 71,200. The smallest populations served were found among schools and school districts (34,300) and colleges and universities (35,700).
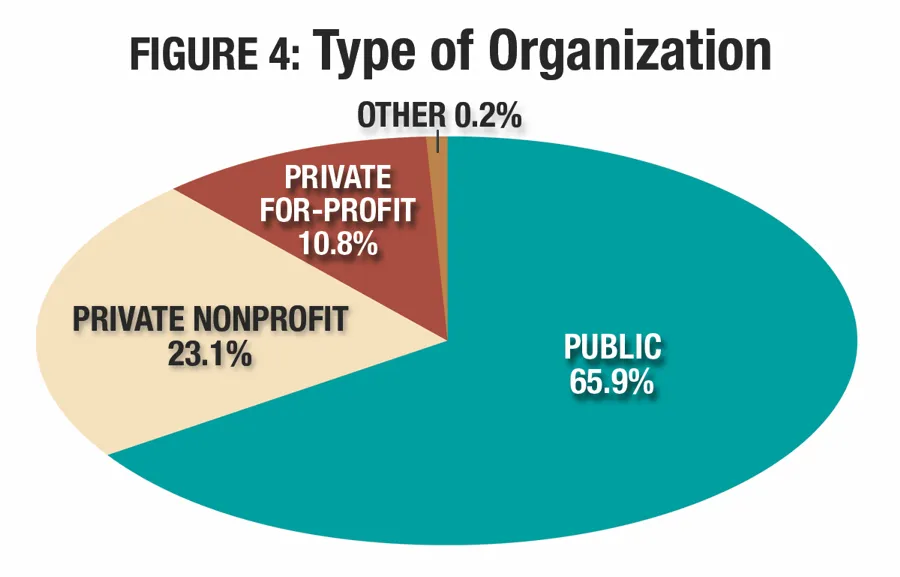
Given the large number of respondents from parks and schools, it comes as no surprise that the largest number of respondents work for public organizations. Nearly two-thirds (65.9 percent) of respondents said they are with public organizations, which includes parks and recreation departments, public schools and public universities, among others. (See Figure 4.) They were followed by those working for private, nonprofit organizations. Nearly a quarter (23.1 percent) of respondents fall into this category, which includes facilities like YMCAs and Boys & Girls Clubs. Finally, 10.8 percent of respondents said they were with private, for-profit organizations, such as health clubs or resorts.
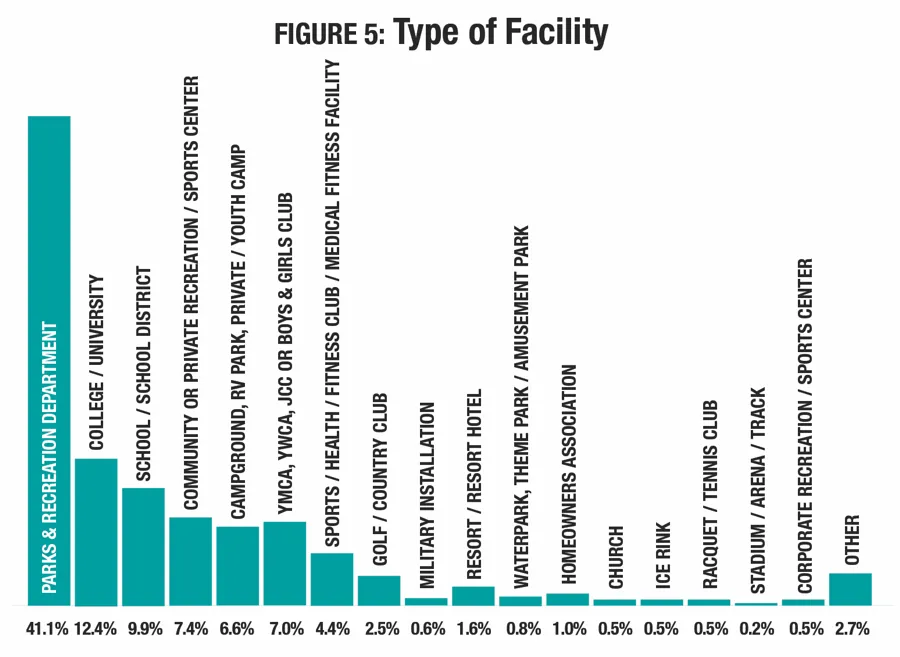
As in past years, the largest percentage of respondents were from parks and recreation departments, park districts and similar organizations. Some 41.1 percent of respondents said they worked for parks and recreation. (See Figure 5.) They were followed by respondents from colleges and universities (12.4 percent); schools and school districts (9.9 percent); community or private recreation and sports centers (7.4 percent); YMCAs, YWCAs, JCCs and Boys & Girls Clubs (7.0 percent); and campgrounds, RV parks, and youth and private camps (6.6 percent). Smaller numbers of respondents reported from other types of facilities, including: sports, health and fitness clubs, and medical fitness facilities (4.4 percent); golf facilities or country clubs (2.5 percent); resorts and resort hotels (1.6 percent); homeowners associations (1 percent); waterparks, theme parks and amusement parks (0.8 percent); military installations (0.6 percent); churches (0.5 percent); ice rinks (0.5 percent); racquet or tennis clubs (0.5 percent); corporate recreation or sports centers (0.5 percent), and stadiums, arenas and tracks (0.2 percent). Another 2.7 percent of respondents said they work for "other" types of facilities.
Different types of facilities are more typically found in certain areas, with some more prevalent in the suburbs and urban areas, and others being more common in rural areas.
For example, more than three-quarters (76.5 percent) of homeowners association respondents were from suburban communities. Other facility types most likely to be found in the suburbs include: golf facilities and country clubs (58.1 percent); military installations (54.5 percent); health, sports and fitness clubs (53.9 percent); and Ys (52.5 percent).
Respondents from camps and campgrounds, as one might expect, are most likely to be found in rural communities, with nearly three-quarters (74.6 percent) of these respondents indicating that they were located in rural areas. They were followed by resorts and resort hotels, 57.1 percent of which were in rural areas, and schools and school districts (50 percent).
Colleges and universities were the only facility type that was more commonly found in urban areas than in other types of communities. Some 37 percent of colleges were in urban communities.
When it comes to organization type, certain types of facilities are more likely to be managed by public organizations, while others are more likely to be owned by for-profit or nonprofit organizations. Respondents from parks and recreation facilities were the most likely to report that they were with public organizations, with 96.9 percent of these respondents indicating they were public. They were followed by schools and school districts (89.5 percent of which were public organizations), and colleges and universities (64.4 percent).
Respondents from Ys were the most likely to be with private, nonprofit organizations, with 92.6 percent of Ys and similar facilities like JCCs and Boys & Girls Clubs indicating they were this type of organization. They were followed by camps and campgrounds (65.8 percent of which were private nonprofits) and golf and country clubs (46.5 percent).
Finally, private, for-profit organizations were most common among resorts and resort hotels, 53.6 percent of which were this type of organization. They were followed by health clubs (52.6 percent).
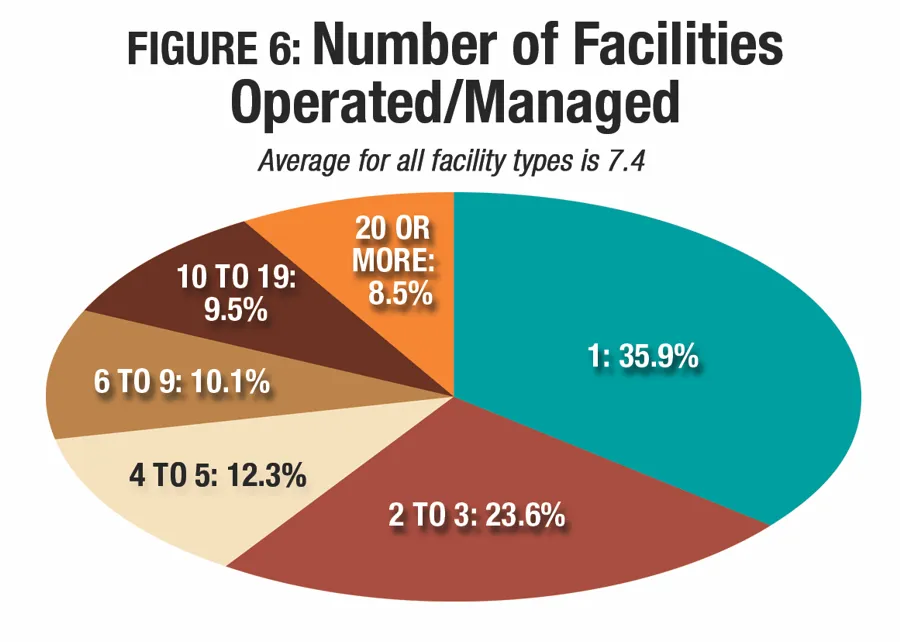
On average, survey respondents manage 7.4 facilities, which is consistent with past years, when the average has ranged from 6.4 to 7. Well over half (59.5 percent) reported that they manage between one and three facilities. Some 22.4 percent said they manage between four and nine facilities. Another 18 percent said they manage 10 or more facilities. (See Figure 6.)
Respondents from urban and suburban communities were more likely than those from rural communities to report that they managed a larger number of facilities, while rural respondents were most likely to report managing just a single facility. On average, urban respondents manage 9.8 facilities, suburban respondents manage 7.6, and rural respondents manage 5.4. More than one-quarter (26.1 percent) of urban respondents said they manage 10 or more facilities, compared with 17.6 percent of suburban respondents and 12.7 percent of rural respondents. Conversely, 43.5 percent of rural respondents said they manage just a single facility, compared with 32.5 percent of suburban respondents and 30 percent of urban respondents.
Respondents from parks facilities were the most likely to report that they manage a larger number of facilities. On average, parks respondents said they manage 11.1 facilities, with 30.3 percent reporting that they manage 10 or more. (See Figure 7.) They were followed by school respondents, who manage an average of 7.8 facilities, with 17.5 percent reporting that they manage 10 or more.
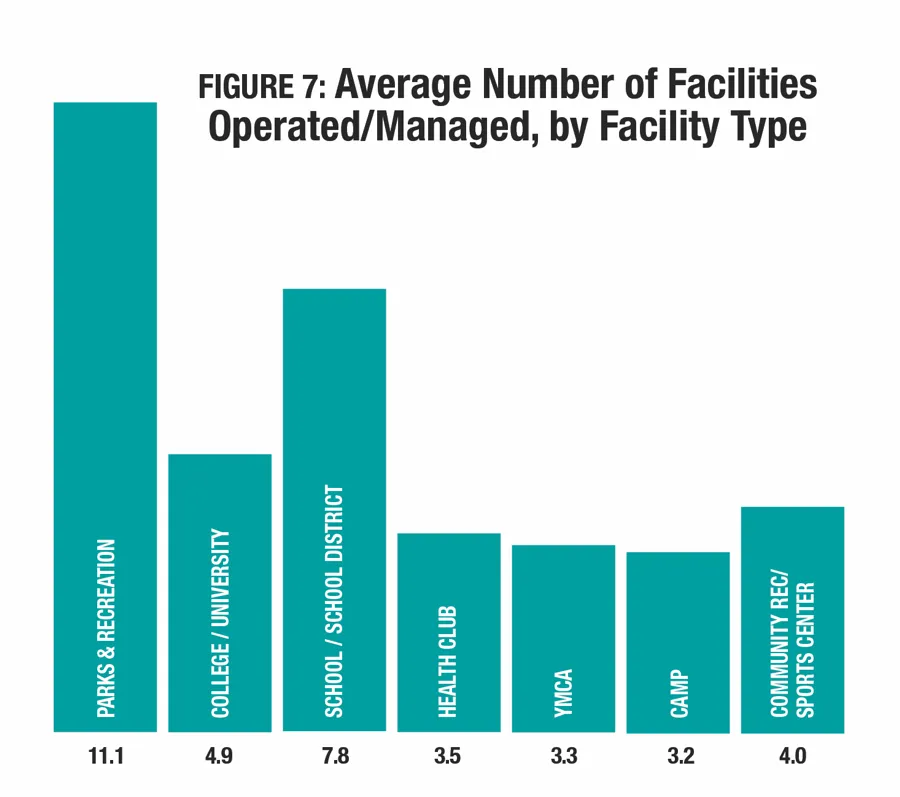
Respondents from camps and health clubs were the most likely to report that they manage just a single facility, with 68.1 percent of camp respondents and 61.8 percent of health club respondents indicating they manage only one facility. On average, camp respondents manage 3.2 facilities, and health club respondents manage 3.5.
Many recreation, sports and fitness facility owners will form partnerships with other organizations, as a means of expanding their reach, offering additional programming opportunities or as a way to share resources and increase funding. In fact, a majority of respondents (86.8 percent) said they form such partnerships, a number that has held fairly steady over time. (Some 87.2 percent in 2016 formed partnerships, and 85.6 percent of 2015 respondents did so).
Local schools continue to hold their spot as the most common partner for all facility types. Nearly six in 10 (59.8 percent) of respondents said they had partnered with local schools. (See Figure 8.) They were followed by local government (52.3 percent), nonprofit organizations (45.8 percent), colleges and universities (34.8 percent) and state government (32.9 percent).
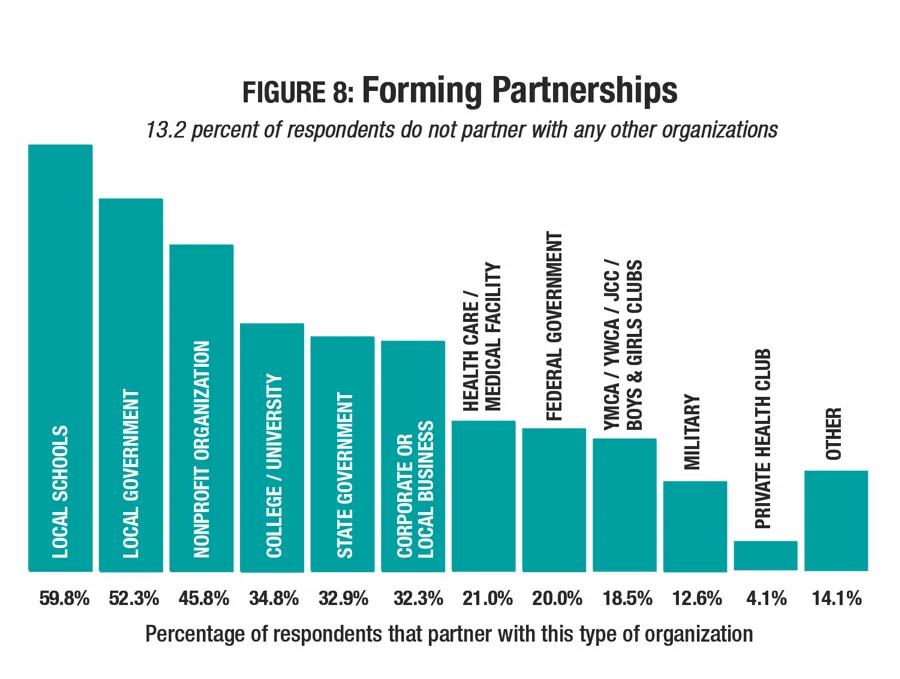
Interestingly, the percentage of respondents who report that they partner with health care and medical facilities has been increasing gradually since 2013. In 2013, 18.5 percent of respondents said they had partnered with health care and medical facilities. By 2015, that number had risen to 19.3 percent. And in 2017, 21 percent of respondents report that they have partnered with health care and medical facilities.
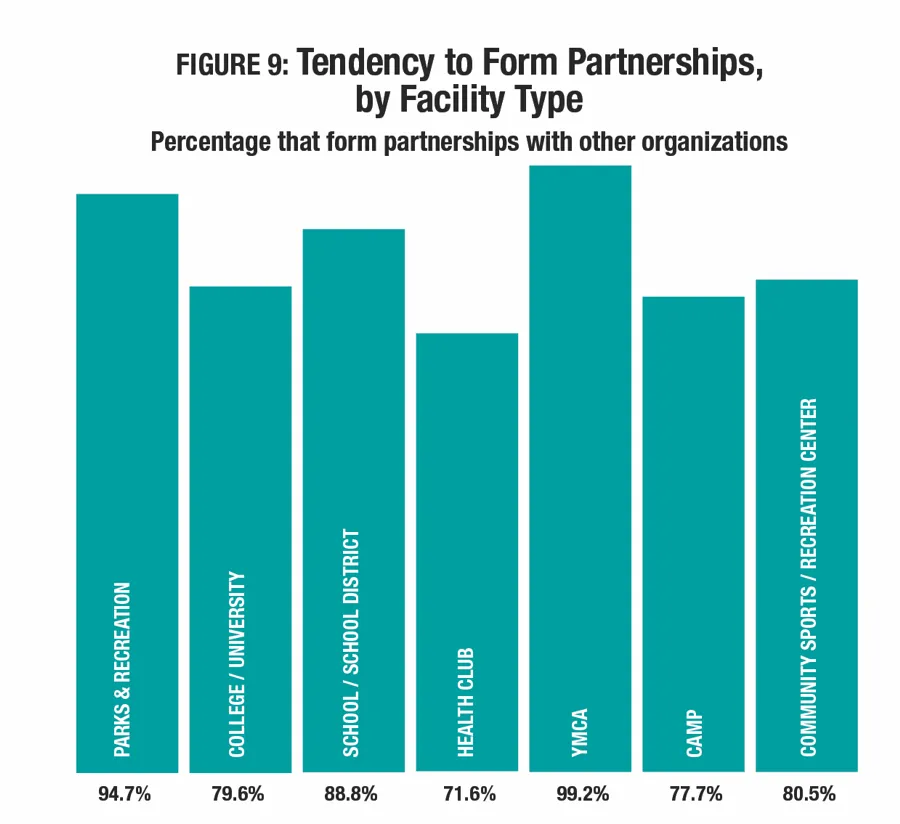
As was the case in 2016, respondents from Ys, parks and schools were the most likely to report that they had partnered with outside organizations, while those from health clubs were the least likely to form partnerships. Some 99.2 percent of Y respondents, 94.7 percent of park respondents and 88.8 percent of school respondents said they had formed partnerships, compared with 71.6 percent of health clubs. (See Figure 9.)
Respondents from Ys were the most likely to partner with many of the potential partners explored in the survey. They were the most likely to partner with local schools (87.6 percent of Y respondents had partnered with local schools), nonprofit organizations (75.2 percent), corporate and local businesses (63.6 percent), health care and medical facilities (63.6 percent), other Ys (55.4 percent), and the military (35.5 percent).
Respondents from parks were the most likely to report that they had partnered with local government, with 69.6 percent of park respondents reporting they had formed such partnerships. Colleges and universities were the most likely to report that they had partnered with other colleges and universities (57.8 percent). Respondents from schools were the most likely to report that they had partnered with state government (49.4 percent) or the federal government (32.9 percent). Finally, respondents from health clubs were the most likely to report that they had partnered with other health clubs (6.8 percent).
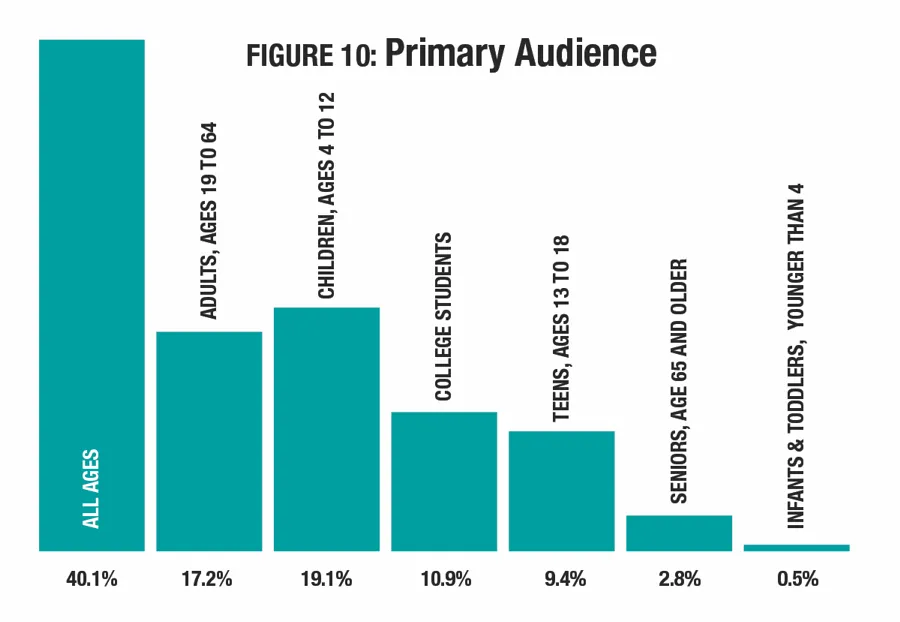
When it comes to the age groups primarily served by their facilities, most respondents report that they reach all ages. (See Figure 10.) Some 40.1 percent of respondents said their facilities are meant for an all-ages audience. Nearly one-fifth (19.1 percent) said that they primarily reach children between the ages of 4 and 12. Some 17.2 percent said adults from 19 to 64 years old are their main audience. Smaller numbers named college students (10.9 percent), teens between 13 and 18 (9.4 percent), seniors 65 and older (2.8 percent) or infants and toddlers (0.5 percent) as the primary audience they served.
Looking at the primary audience served by specific facility types, it is unsurprising that certain types of facilities are more likely to serve specific audiences than others. Ys were the most likely to report that they serve an all-ages audience. Some 58.2 percent of Y respondents said this was their primary audience. They were followed by park respondents (53 percent) and community centers (50.4 percent). Respondents from colleges were the least likely to serve all ages, with just 6 percent indicating that this was their primary audience.
Children ages 4 to 12 were most likely to be the primary audience for camp respondents, 37.7 percent of whom said they primarily reach children. They were followed by parks (26.8 percent) and Ys (20.5 percent). Unsurprisingly, no health club respondents said they primarily reached an audience between 4 and 12 years old.
Adults between 19 and 64 years old were most likely to be the primary audience for health club respondents, with 57.9 percent of these respondents indicating they primarily reach adults. They were followed, though not closely, by community centers (22 percent) and Ys (18 percent). Schools, obviously, were the least likely to serve adults as their primary audience.
College students were most likely to be the primary audience for colleges and universities, 83.8 percent of whom said this was their main audience. School respondents were the most likely to say that teens were their primary audience, with 52.9 percent indicating they mainly reach teens. Finally, seniors were more likely to be the primary audience for health clubs than for other facility types, with 9.2 percent of health club respondents indicating they mainly reach seniors. Infants and toddlers were unlikely to be the main audience for any facility type, though a handful of respondents, including some from Ys, parks, community centers and schools said that they mainly served infants and toddlers.
Revenues & Expenditures
As stated previously, the Industry Report survey results over the past 10 years have reflected the effects of the Great Recession, and a gradual recovery, which has taken place across the board, though some types of facilities have recovered more quickly than others.
The percentage of respondents who said their revenues have increased over the previous year has increased from 37 percent who saw such an increase from 2010 to 2011 to 43.9 percent who reported an increase from 2015 to 2016. At the same time, the percentage who reported a decrease to revenues has fallen, from 20.8 percent who saw revenues decrease from 2010 to 2011 to 11.3 percent reporting a decrease from 2015 to 2016.
From 2015 to 2016, a majority of respondents said their revenues either remained the same (44.8 percent) or increased (43.9 percent). For the first time since 2010, the percentage of respondents reporting lower revenues did not decrease, but held fairly steady at 11.3 percent (compared with 11.1 percent reporting a decrease in the previous year). (See Figure 11.)
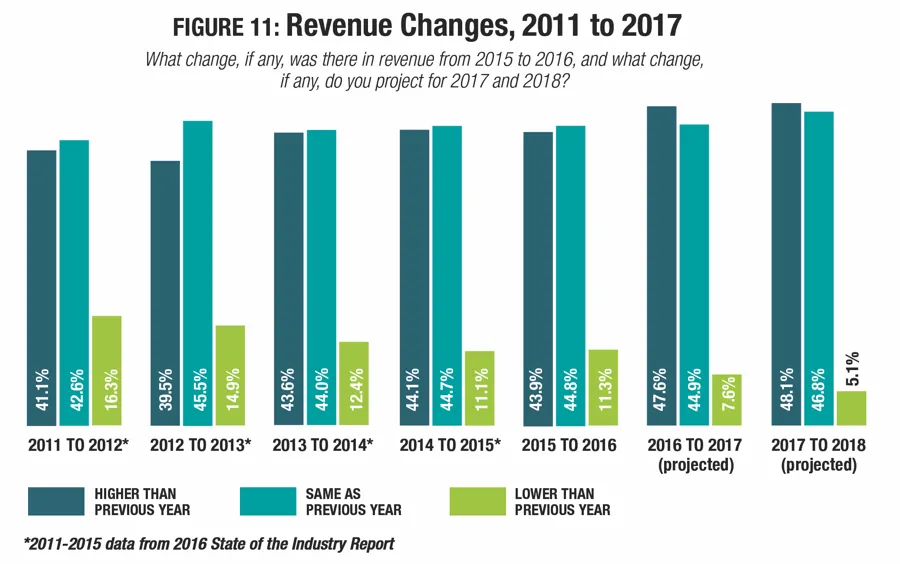
Looking forward, the vast majority of respondents said that they expect their revenues either to increase or to remain the same year-over-year. From 2016 to 2017, 47.6 percent of respondents said they expect revenues to increase, while 44.9 percent expect them to remain the same. Some 7.6 percent of respondents expect revenues to fall this year. From 2017 to 2018, 48.1 percent expect an increase and 46.8 percent expect revenues to hold steady, while 5.1 percent expect revenues to drop.
Respondents from suburban communities were the most likely to report change in their revenues from 2015 to 2016, being both most likely to report an increase in revenues and most likely to report a decrease in revenues. While 45.9 percent of suburban respondents said their revenues had increased in this time period, 11.9 percent reported a decrease. For urban respondents, 43.7 percent reported an increase to revenues in this time frame, while 10.6 percent saw a decrease. And among rural respondents, 41.7 percent said revenues had increased in 2016, while 11.3 percent reported a decrease.
Looking forward, respondents from suburban communities are the most likely to report that they expect their revenues will increase in 2017 and 2018, while respondents from urban areas are the most likely to expect a decrease. From 2016 to 2017, 53.5 percent of suburban respondents projected an increase to revenues, compared with 43.3 percent of urban respondents and 43 percent of rural respondents. At the same time, 9.1 percent of urban respondents projected a decrease, compared with 8.9 percent of rural respondents and just 5.8 percent of suburban respondents. From 2017 to 2018, 51.6 percent of suburban respondents projected an increase, followed by urban (49.7 percent) and rural (42.5 percent) respondents. In that same time period, 7 percent of urban respondents said they expect revenues to fall, compared with 6.9 percent of rural respondents, and just 2.8 percent of suburban respondents.
Respondents from camps, health clubs and community centers were the most likely to report that their revenues had increased from 2015 to 2016, while those from schools and colleges were the least likely to report an increase. At the same time, Ys were most likely to report a decrease in revenues. From 2015 to 2016, some 56.7 percent of camp respondents said their revenues had increased. They were followed by health clubs (55.4 percent of whom reported an increase), community centers (49.2 percent), Ys (47.9 percent) and parks (47.8 percent). In that same time period, only 21 percent of schools and 23 percent of colleges reported an increase. Some 20.7 percent of Y respondents said their revenues had fallen from 2015 to 2016. They were followed by schools (16.8 percent of whom reported a decrease), community centers (14.5 percent) and colleges (12.4 percent).
Looking forward, respondents from Ys, health clubs, camps and community centers were the most optimistic regarding revenue increases, while schools and colleges were the most likely to expect revenues to fall. From 2016 to 2017, 60.8 percent of Y respondents said they expect their revenues to increase, and from 2017 to 2018, 64.3 percent of Y respondents said they expect an increase. They were followed by health club respondents, 59.7 percent of whom expect an increase in 2017 and 63.8 percent of whom expect an increase in 2018. From 2016 to 2017, some 59.7 percent of community centers and 58.2 percent of camps expect an increase. And from 2017 to 2017, 56 percent of community centers and 61.5 percent of camps expect an increase. On the other side of the coin, from 2016 to 2017, 16.5 percent of school respondents and 13.6 percent of college respondents expect revenues to decrease. And from 2017 to 2018, 14.4 percent of school respondents and 9.2 percent of college respondents expect a drop in revenues.
After reporting a slight drop in operating expenditures from 2014 to 2015 in the 2016 Industry Report, this year saw a relatively significant increase. From 2015 to 2016, operating expenditures increased 17.5 percent, from an average of $1,740,000 to $2,044,000. (See Figure 12.) Reflecting the gradual recovery of the economy as the effects of the recession have faded, operating expenditures have increased by 43.2 percent since 2010.
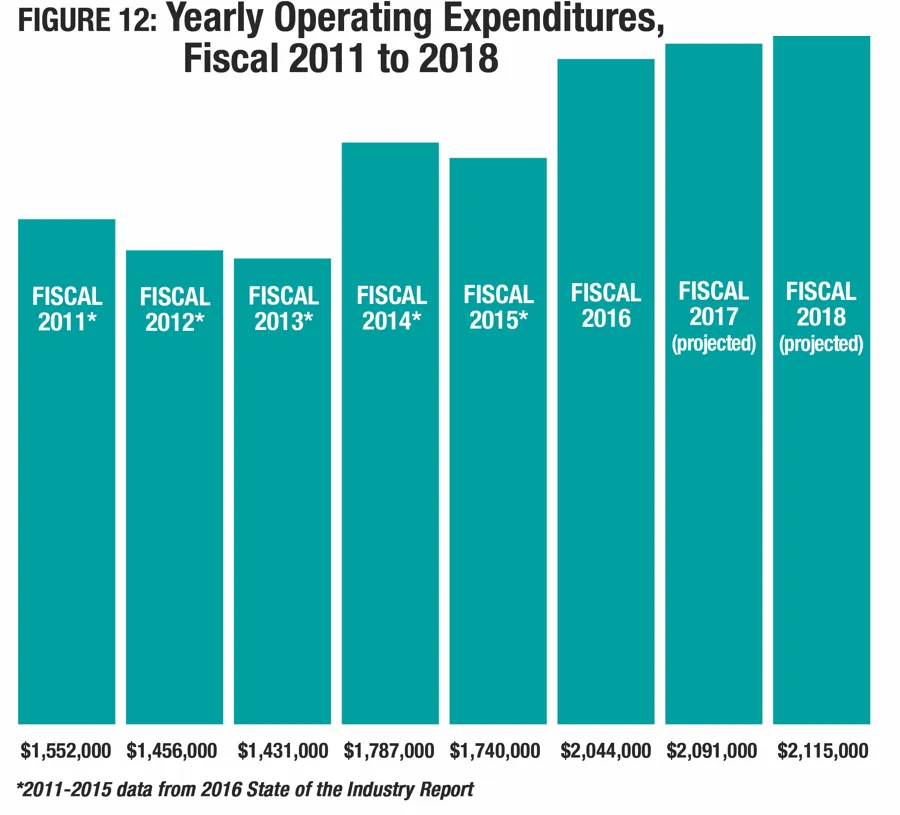
Looking forward, respondents are expecting further increases to their operating expenses. From 2016 to 2017, respondents said they expect their operating expenses to increase by 2.3 percent, to an average of $2,091,000. And from 2017 to 2018, they projected a further increase of 1.1 percent, to an average of $2,115,000.
Respondents from urban communities reported the highest average operating expenditures for 2016, with an average of $2,713,000. That said, suburban respondents reported the greatest increase in their operating expenses from 2015 to 2016. In that time period, suburban respondents saw their average operating expenditure increase by 26.8 percent, from $1,900,000 in 2015 to $2,409,000 in 2016. Urban respondents saw a more modest increase, with revenues rising by 9.9 percent, from $2,468,000 in 2015 to $2,713,000 in 2016. Rural respondents reported a 5 percent decrease in their operating expenses in this time frame, falling from an average of $1,113,000 in 2015 to $1,057,000 in 2016.
Looking forward, respondents from urban communities are expecting the greatest increase to operating expenditures between 2016 and 2018. In that time frame, they project their average operating cost to grow by 4.6 percent, from $2,713,000 to $2,839,000. They were followed by rural respondents, who projected a 4.3 percent increase from $1,057,000 in 2016 to $1,102,000 in 2018. Suburban respondents projected the smallest increase to operating expenses, with a 1.9 percent increase from $2,409,000 in 2016 to $2,454,000 in 2018.
Between fiscal 2013 and fiscal 2016, parks respondents reported the greatest increases in their average operating expenditures. Park respondents said their operating costs grew by 58 percent in that time, from an average of $1,537,000 in 2013 to $2,428,000 in 2016. They were followed by colleges and universities, with an increase of 43 percent, from $1,332,000 to $1,905,000; and health clubs, with a 23.7 percent increase, from $1,302,000 to $1,804,000. Only community centers reported a decrease to operating expenditures between 2013 and 2016, reporting a drop of 2.3 percent from an average of $1,215,000 to $1,187,000. Falling in between these extremes were camps, with a 5.5 percent increase, Ys (up 23.7 percent), and schools (up 26 percent).
Looking forward, Y respondents not only report the highest average operating expenditures of all facility types, but also expect the sharpest increase to their operating expenses between 2016 and 2018. (See Figure 13.) In that time period, Ys expect their operating costs to grow by 12 percent, from $3,058,000 in 2016 to $3,245,000 in 2018. They were followed by colleges, with a 7.1 percent increase from $1,905,000 to $2,040,000; and parks, with a 4.2 percent increase, from $2,428,000 to $2,531,000. More modest increases to operating expenditures were expected by respondents from camps (up 2.5 percent) and schools (up 1.8 percent).
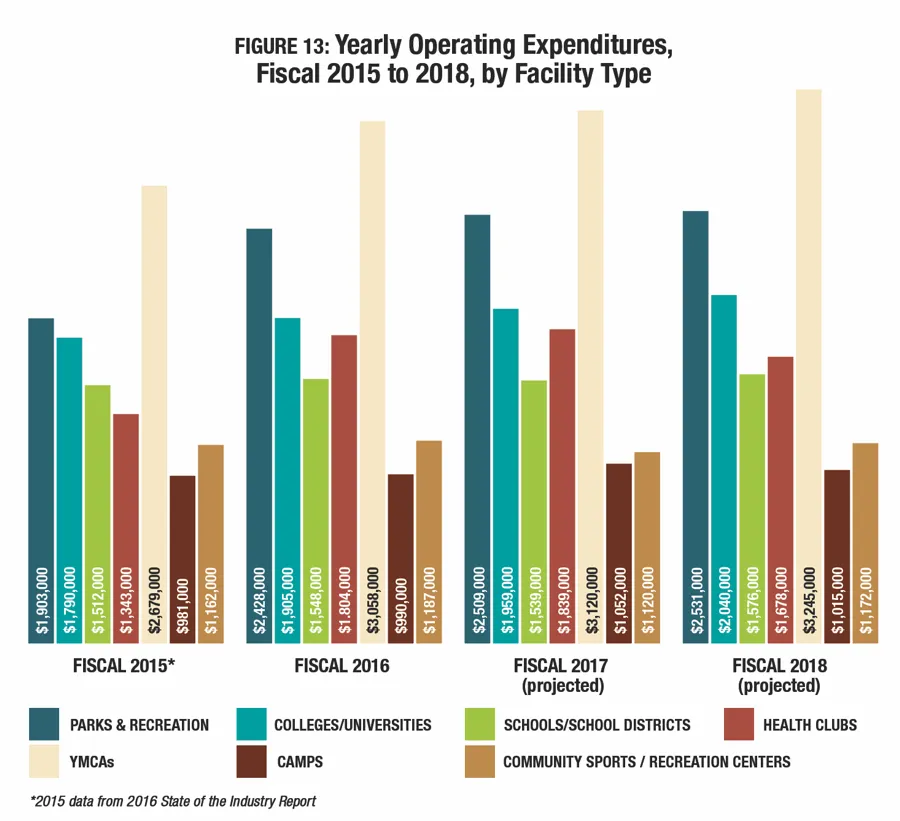
Respondents from health clubs and community centers were the only facility types to report that they expect their average operating costs to decrease between 2016 and 2018. Health club respondents projected a decrease of 7 percent to their average operating expenditures, from $1,804,000 in 2016 to $1,678,000 in 2018. And community center respondents said they expect their operating costs to fall by 1.3 percent, from $1,187,000 in 2016 to $1,172,000 in 2018.
Over the past couple of decades, there has been a growing expectation, particularly for public organizations like parks and recreation departments and districts, that facilities can be run like businesses. Many local leaders expect facilities to recover much of their operating costs via revenues. While this is the business model for for-profit facilities like health clubs, it's a relatively recent development for publicly owned facilities, which have typically been subsidized via tax dollars and other funding sources.
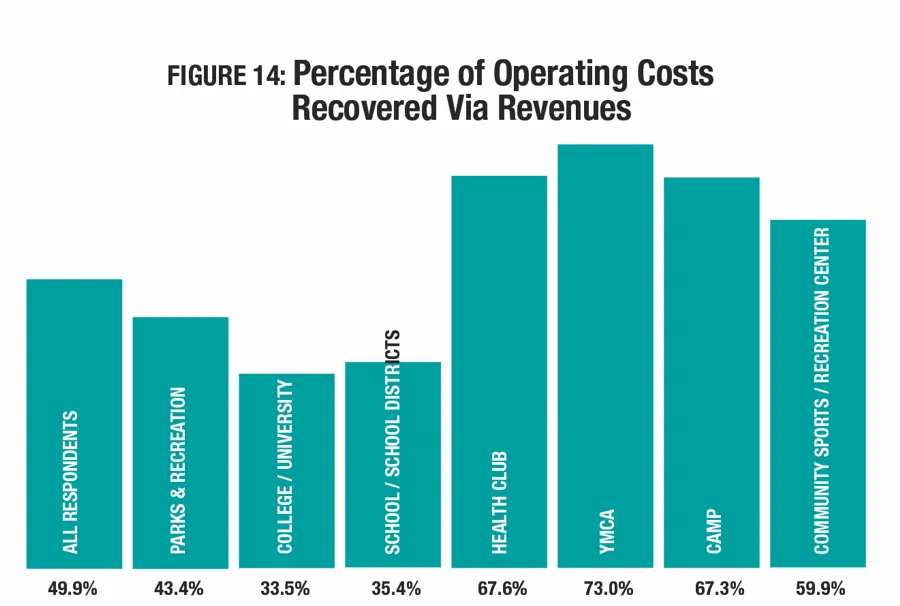
On average, for all respondents, 49.9 percent of costs are recovered via revenues, representing virtually no change from 2016, when 49.6 percent of costs were recovered. Interestingly, 23 percent of respondents said they recover only 0 to 20 percent of their costs via revenues. On the other end of the spectrum, 23.8 percent said they recover 80 percent or more of their costs via revenue. And, 18.2 percent said they recover at least 90 percent of their costs via revenues.
There is quite a bit of variability in cost recovery, depending on the industry segment one is considering. Respondents from Ys, health clubs, are the most effective at using their revenues to cover their operating costs. Y respondents said they recover nearly a quarter (73 percent) of their operating costs, while health clubs cover 67.6 percent, and camps cover 67.3 percent. (See Figure 14.) Colleges and schools recover the smallest percentage of their operating costs via revenues, with colleges earning back 33.5 percent and schools earning back 35.4 percent.
From 2016 to 2017, only schools and community centers saw an increase in the percentage of operating costs recovered via revenues. For school districts, that percentage grew from 32.4 percent to 35.4 percent, and for community centers, it increased from 55.6 percent to 59.9 percent.
As one might expect, respondents from private, for-profit organizations reported earning the greatest share of their operating costs back via revenues, at 70.4 percent. They were followed by private nonprofits, at 60.2 percent. Those from public organizations reported earning the smallest share of operating costs back via revenues, at 43.2 percent. These numbers changed very little from 2016, when 42.9 percent of costs were earned via revenues by public organizations, 61.5 percent for private nonprofits, and 69 percent for private for-profit organizations
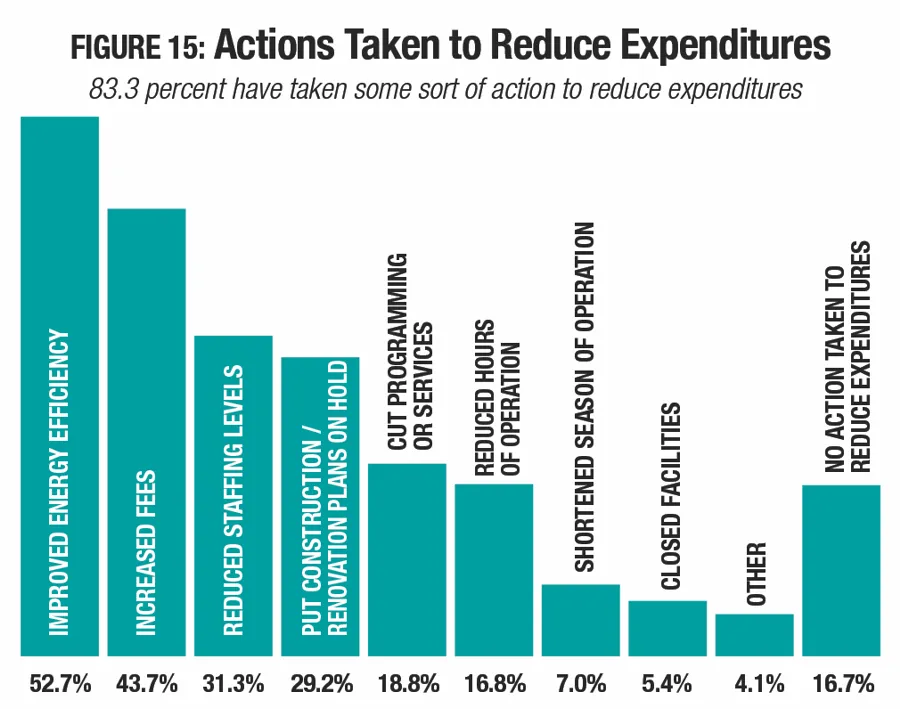
While a majority of respondents (83.3 percent) reported that they had taken action to reduce their operating expenses, that number has fallen gradually from a high of 90.3 percent in 2011. Perhaps as the economy has recovered, and revenues have increased, facilities have less need to reduce expenses.
The most common action taken to reduce expenditures, as in past years, was improving energy efficiency. More than half (52.7 percent) of respondents said that they had improved energy efficiency in order to reduce operating expenses, up slightly from 51.6 percent in 2016. Other commonly used methods of reducing expenditures included: increasing fees (43.7 percent); reducing staffing levels (31.3 percent); putting construction and renovation plans on hold (29.2 percent); and cutting programs or services (18.8 percent). (See Figure 15.) Smaller numbers of respondents said they had reduced their hours of operation (16.8 percent), shortened their season of operation (7 percent) or closed facilities entirely (5.4 percent).
Respondents from camps, Ys and parks were the most likely to report that they had taken action to reduce their expenditures. Some 90.1 percent of camps, 88.4 percent of Ys and 84.8 percent of parks respondents said they had taken such actions. School respondents were the least likely to indicate that they had acted to reduce operating expenses, though 77 percent had done so. In the middle were colleges (80.5 percent), health clubs (80.8 percent) and community centers (80.8 percent).
Camps were more likely than other facility types to report that they had improved energy efficiency (61.3 percent), increased fees (62.2 percent) or put construction plans on hold (37.8 percent). Ys were the most likely to report that they had reduced staffing levels (51.2 percent) or cut programs and services (27.3 percent). Colleges and universities were the most likely to report that they had reduced their hours of operation (27.6 percent) or closed facilities (7.6 percent). Finally, parks were the most likely to report that they had shortened their season of operation (11.4 percent).
Facility Usage & Membership
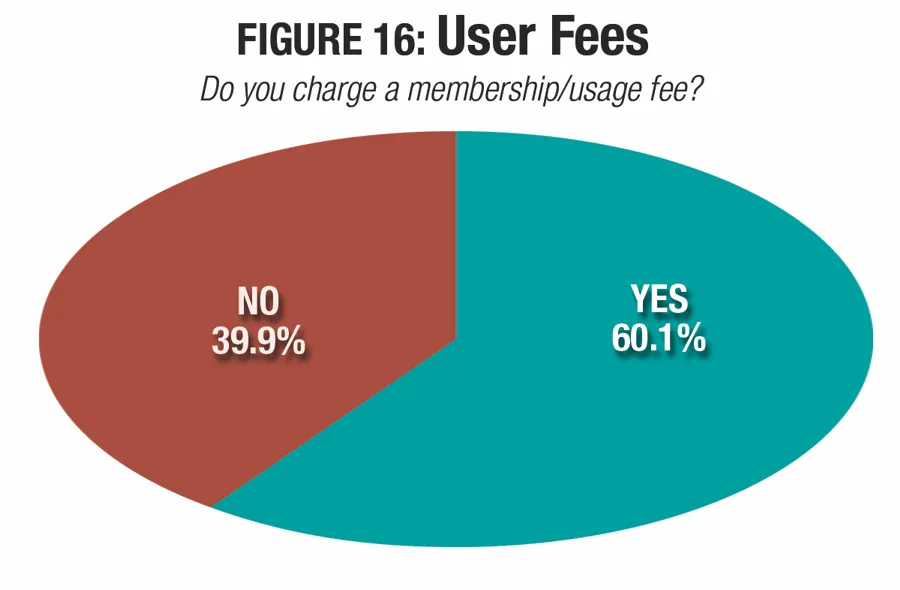
The percentage of respondents who charge a fee for membership or for using their facilities has grown slightly over the past four years. Some 60.1 percent of this year's survey respondents said they charge a membership/usage fee (see Figure 16), compared with 59.7 percent last year, 58.4 percent in 2015, and 55.7 percent in 2014.
Respondents from Ys, health clubs and community sports and recreation centers were the most likely to charge a fee for membership or usage of their facilities. Some 99.2 percent of Y respondents, 86.8 percent of health club respondents and 71.9 percent of community center respondents said that they charge a fee for usage of their facilities.
Conversely, schools, parks and colleges were less likely to charge such a fee. Some 20.9 percent of schools, 58.7 percent of parks and 59.3 percent of colleges said they charge a membership/usage fee. Camps fell in the middle, with 64 percent indicating that they charge a fee.
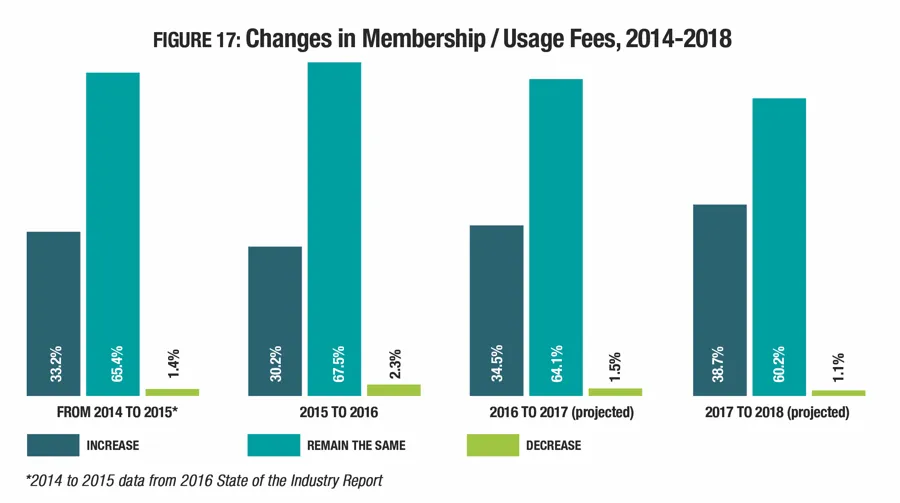
The majority of respondents who charge a fee for membership said they plan to keep those fees the same from 2015 to 2018. While 67.5 percent said their fees remained unchanged from 2015 to 2016, 64.1 percent have no plans to change their fees in 2017, and 60.2 percent will not change their fees in 2018. Around three in 10 (30.2 percent) said their fees had increased in 2016. A growing number expect fees to increase further in 2017 (34.5 percent) and 2018 (38.7 percent). (See Figure 17.)
Of those facilities that charge a fee for membership or usage, those from camps, Ys, health clubs and community centers were the most likely to report that they had raised their fees from 2015 to 2016, while those from schools were least likely to have raised fees in that time frame. Some 43.5 percent of camp respondents who charge a fee said they had raised that fee in 2016 (down from 53.7 percent of camp respondents who raised fees in 2015). They were followed by Ys (36.7 percent), health clubs (33.3 percent) and community centers (33 percent). Just 13.9 percent of school respondents said they had raised their fees in 2016.
Looking forward, camps continue to be the most likely to report that they are planning future increases to fees, with 50 percent indicating they would be raising their fees in 2017, and 52.9 percent planning such an increase in 2018. They were followed by community centers, 43.5 percent of whom plan an increase for 2017 and 40.2 percent of whom plan to increase fees in 2016; and by Ys (42.9 percent and 40 percent, respectively).
In 2016, 54.6 percent of respondents said they expected usage of their facilities to increase from 2015 to 2016. Slightly fewer (53.5 percent) of 2017 respondents indicated that such an increase had taken place. Another 38.8 percent said the number of people using their facilities had remained the same, while 7.7 percent said they'd seen a drop in the number of people using their facilities from 2015 to 2016. (See Figure 18.)
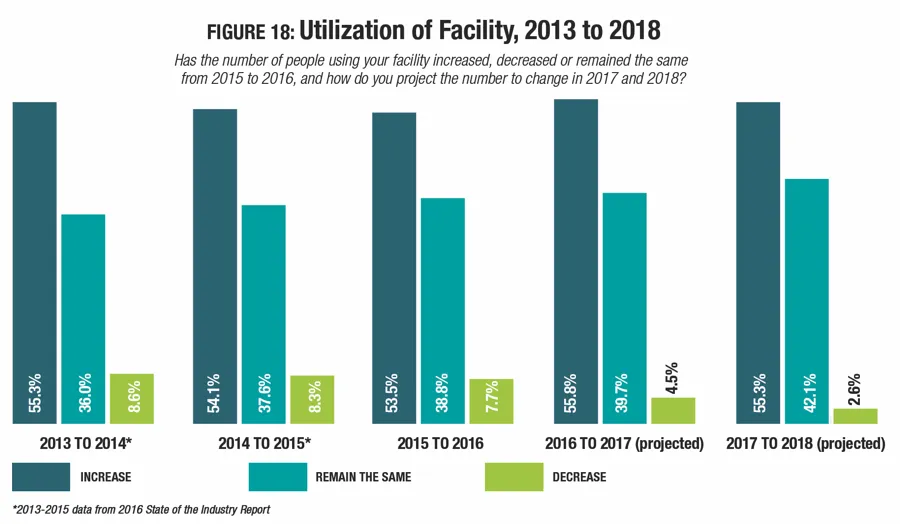
Looking forward, more than half of respondents expect to see further increases in the number of people using their facilities, while the number of respondents expecting usage to decrease falls. From 2016 to 2017, 55.8 percent of respondents said they expect usage to increase, while 4.5 percent are expecting a decrease. And from 2017 to 2018, 55.3 percent projected an increase, while 2.6 percent are expecting a decrease.
Respondents from urban communities were the most likely to report an increase in the number of people using their facilities from 2014 to 2015, and were the most likely to expect further increases in 2017 and 2018. Some 59.2 percent of urban respondents said usage had increased in 2015, compared with 53.5 percent of suburban respondents and 50.2 percent of rural respondents. From 2016 to 2017, 62.2 percent of urban respondents projected an increase in the number of people using their facilities, compared with 57.4 percent of suburban and 49.6 percent of rural respondents. And from 2017 to 2018, 63.9 percent of urban respondents are expecting an increase in usage, compared with 55.9 percent of suburban respondents and 48.8 percent of rural respondents.
From 2015 to 2016, respondents from parks, community centers and health clubs were the most likely to report that the number of people using their facilities had increased, while those from schools and colleges were the least likely to report an increase. Some 61.4 percent of parks respondents said usage of their facilities increased from 2015 to 2016. They were followed by community recreation centers (61.1 percent) and health clubs (55.3 percent). Just 34.5 percent of schools and 41.3 percent of colleges said that the number of people using their facilities went up from 2015 to 2016.
Looking forward, Ys, community recreation and sports centers, and health clubs were the most likely to expect the number of people using their facilities to increase. From 2016 to 2017, some 66.1 percent of Y respondents, 65 percent of community center respondents and 64.9 percent of health club respondents said they expect increasing numbers of users at their facilities. From 2017 to 2018, 68.2 percent of Y respondents, 64.3 percent of community center respondents and 62.9 percent of health club respondents said they expect an increase.
Staffing
The average number of people employed at the organizations covered by the survey has seen steady growth over the past three years, rising 16.9 percent, from an average of 126.3 in 2014 to 147.6 in 2017. This includes 30.2 full-time employees, 40.9 part-time employees, 39.5 seasonal employees, 34.9 volunteers and 2.1 "other" workers. (See Figure 19.)
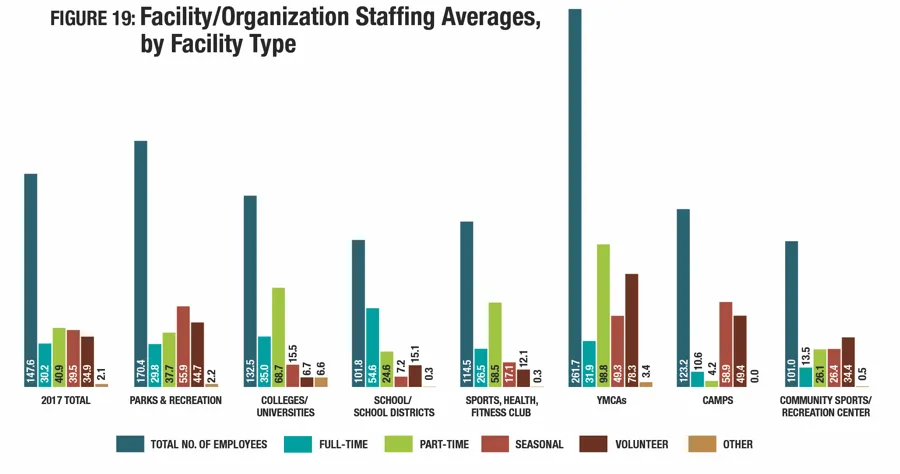
Ys continue to employ far more people than any other type of facility, with an average of 261.7 employees. They were followed by parks and recreation respondents, with an average of 170.4 employees, and colleges and universities, with 132.5. Community recreation and sports centers, and schools & school districts employ the smallest staffs, with 101 and 101.8 employees, respectively.
Schools and school districts have the largest number of full-time workers, with an average of 54.6. They were followed by colleges, with 35, and Ys with 31.9. Community recreation and sports centers have the fewest full-time employees, with an average of 13.5
Ys employ the most part-time workers with an average of 98.8. They were followed by colleges and universities with 68.7, and health clubs with 58.5.
Camp and park respondents have the greatest number of seasonal employees. Camps employ 58.9 seasonal employees, on average, while parks employ 55.9 on average.
The highest number of volunteers were to be found among Ys, followed by camps and parks. Ys had 78.3 volunteers, on average, while parks had 44.7 and camps had 49.4.
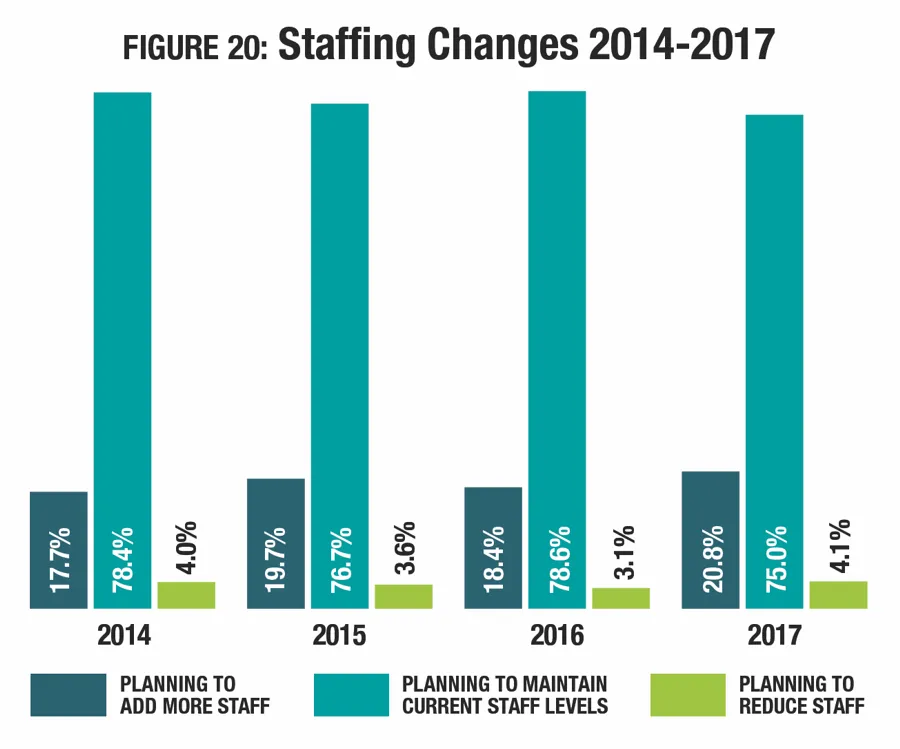
Over the past five years, the percentage of respondents who report that they are planning to add more staff has grown, from 14.9 percent in 2013 to 20.8 percent in 2017. At the same time, the percentage planning to cut staff has fallen from 6.3 percent in 2013 to 4.1 percent in 2017. (See Figure 20.) Three-quarters of respondents (75 percent) say that they will maintain their current staff levels.
On average, respondents with plans to bring on additional help are planning to add 21 employees, on average, in 2017. This is virtually the same as 2016, when respondents were planning to add 20.7 employees. Respondents in 2017 are planning to add, on average, 2.5 full-time employees, 5.8 part-time employees, 5.5 seasonal employees and 7.1 volunteers. Those facilities that are planning to bring on the greatest number of workers in the coming year include Ys, which plan to hire 36.7, on average, parks (23.8) and camps (23.7). Community centers and health clubs will add the fewest additional workers, with an average of 9.9 and 10.5, respectively.
Parks, community centers and camps were the most likely to report that they have plans to add staff in 2017. Nearly a quarter (24.8 percent) of parks respondents said they had such plans. They were followed by community center respondents (23.4 percent of whom said they will be adding staff) and camps (20.2 percent).
Respondents from colleges and schools were the most likely to report that they had plans to reduce staff, though less than one in 10 had such plans. Some 6.9 percent of college respondents and 5.2 percent of school respondents said they would be cutting staff in 2017.
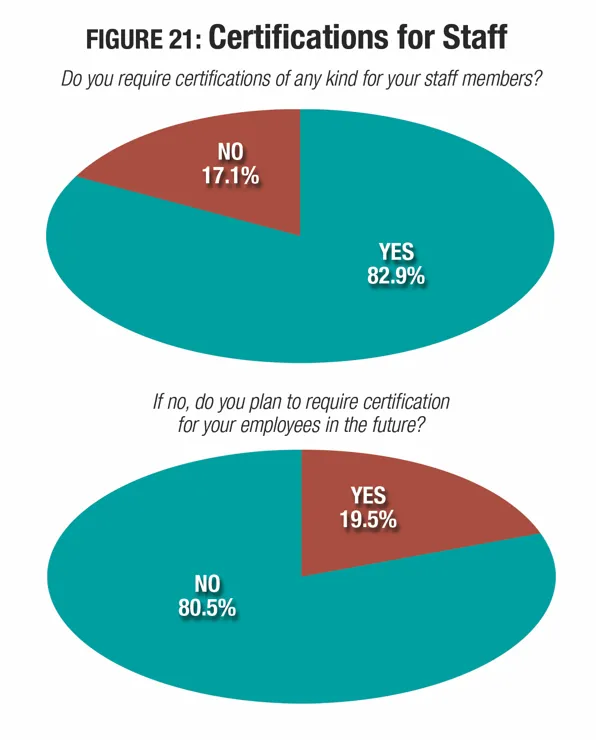
Certifications are often used to help measure and verify specific types of professional knowledge and skill. From lifeguard certification to pesticide application certification, there are many types of professional development that are useful in the recreation, sports and fitness industry. A majority of respondents (82.9 percent) said that they do require certifications for some of their staff members, up from 81.4 percent in 2016. Of those who do not currently require any certifications, 19.5 percent indicated that they plan to require it in the future. (See Figure 21.)
Respondents from Ys and health clubs are the most likely to require certification for some of their employees, both now and looking forward. Some 97.5 percent of Ys currently require certification, and the same number plan to require it going forward; and 96.1 percent of health clubs currently require certification, and the same number plan to require it going forward. (See Figure 22.)
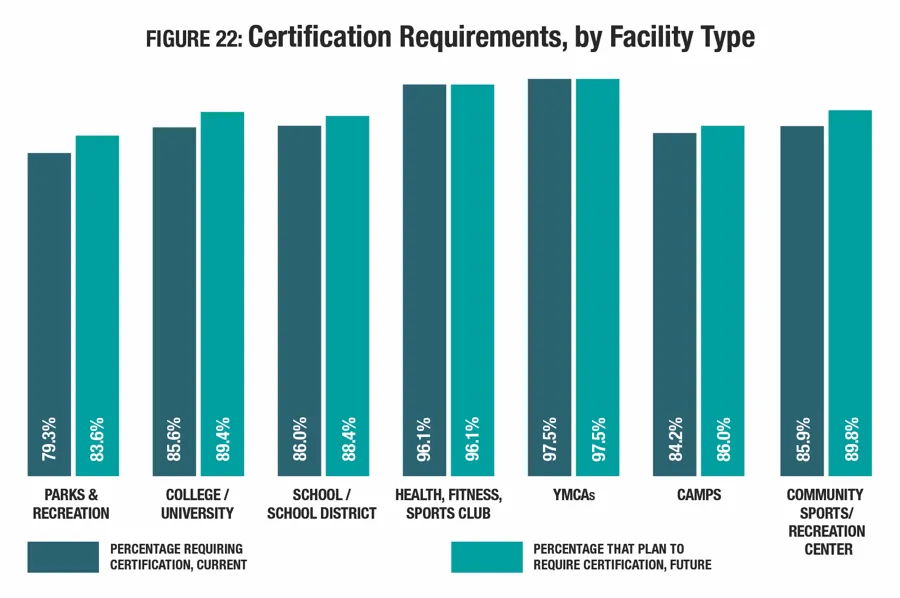
Some 86 percent of schools, 85.9 percent of community sports and recreation centers, 85.6 percent of colleges and universities, and 84.2 percent of camps currently require certification of some of their employees. Parks respondents were the least likely to require certification, though a majority (79.3 percent) do so.
Looking forward, Ys and health clubs were followed by community center respondents, 89.8 percent of whom said they plan to require certification in the future. They were followed by colleges and universities (89.4 percent), schools and school districts (88.4 percent), camps (86 percent) and parks (83.6 percent).
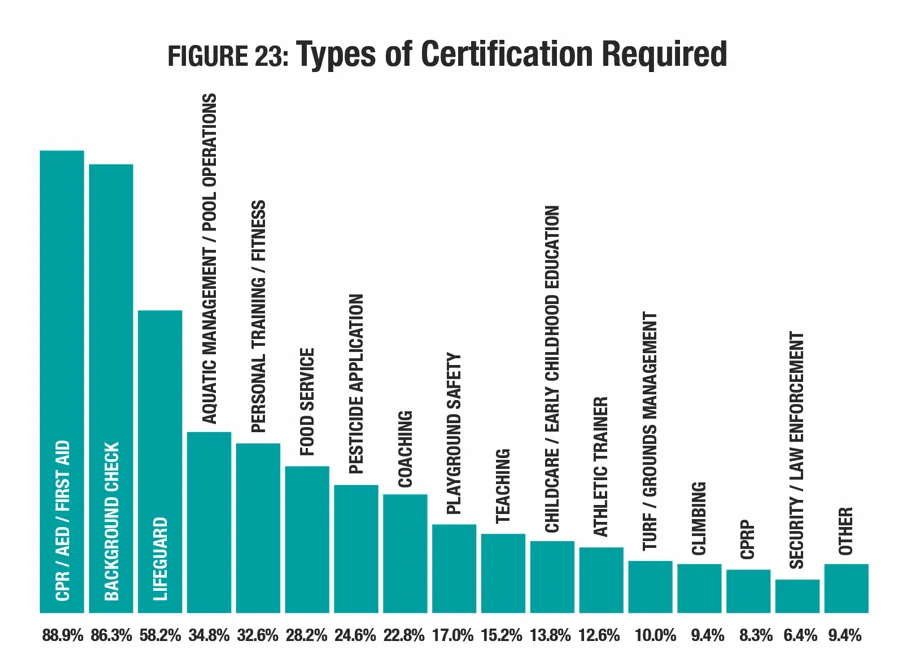
Of those respondents that require certification, the most common types of certification required included CPR/AED/First Aid (required by 88.9 percent of those who said they require some staff members to be certified), background checks (86.3 percent), and lifeguard certification (58.2 percent). (See Figure 23.) More than a quarter of respondents also require an aquatic management or pool operations certification (34.8 percent), personal training or fitness certification (32.6 percent), or foodservice certification (28.2 percent). More than one in five require a pesticide application certification (24.6 percent) or coaching certification (22.8 percent).
Respondents from facilities that include aquatic elements were obviously much more likely to require lifeguard and aquatic management or pool operations certifications. While 58.2 percent of all respondents who require certification ask that some staff members achieve lifeguard certification, for those with aquatic elements, that number jumps to 87.3 percent. And while 34.8 percent of all respondents require aquatic management and pool operations certification, 55.8 percent of those with aquatic elements do so.
Just as they are the most likely to require certification at all, Ys were the most likely to require many specific types of certification. Y respondents were more likely than others to report that they require: CPR/AED/First Aid certification (100 percent); background checks (98.3 percent); lifeguard certification (86.6 percent); aquatic management and pool operations certification (63.9 percent); and childcare/early childhood education certification (58.8 percent).
Respondents from health clubs were more likely than others to require personal training or fitness certification (89 percent).
Respondents from camps were the most likely to require foodservice certifications (59.4 percent), and climbing certifications (40.6 percent).
Respondents from parks were the most likely to require pesticide application certification (40.2 percent), playground safety certification (36 percent), Certified Parks and Recreation Professional (CPRP) certification (17.6 percent), turf/grounds management certification (14.9 percent), and security or law enforcement certification (9 percent).
Respondents from schools were more likely than others to require coaching certification (67.6 percent) and teaching certification (60.1 percent).
Finally, respondents from colleges and universities were the most likely to require athletic trainer certification (31.9 percent).
Facilities & Construction Plans
Beginning in 2013, we have asked survey participants how old their main facility was. In that time, facilities have aged from an average of 27.5 years in 2013 to 33.1 years in 2017. Only 6 percent of respondents said their main facility was 5 years old or less. Another 8.8 percent said their facilities are between 6 and 10 years old. Nearly a quarter (23.7 percent) said their main facility is between 11 and 20 years old. Another 29.4 percent said their main facility is between 21 and 40 years old. Nearly one-third (32.1 percent) said their main facility is 41 years or older. And, more than half of those (16.5 percent of all respondents) said their main facility is at least 50 years old.
The newest facilities, on average, are found among health clubs, as well as colleges and universities. Respondents from health clubs said their main facility is 24.3 years old, on average, while college respondents' main facilities averaged 25.4 years. (See Figure 24.)
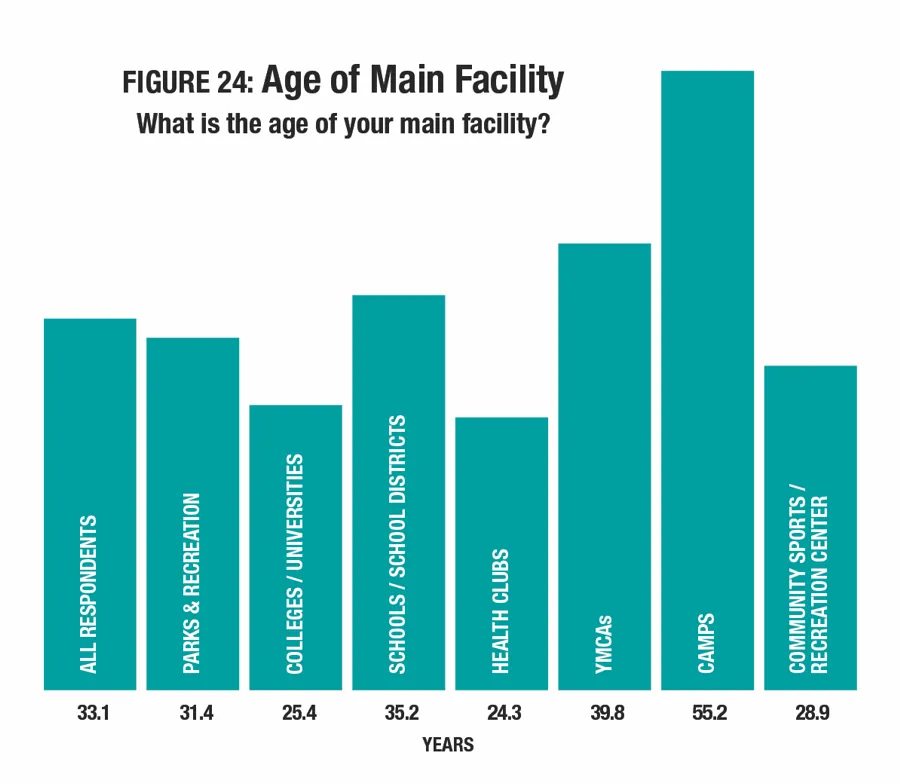
The oldest facilities are found among camp respondents, who said the average age of their main facility is 55.2 years. They were followed by Ys, with an average facility age of 39.8, and schools, which averaged 35.2 years.
Over the past five years, the percentage of respondents who indicate that they have plans for construction, whether new facilities or additions or renovations to their existing facilities, has grown steadily, from 62.7 percent in 2013 to 68.3 percent in 2017. In fact, this is the first time since the beginning of the recession that less than a third of respondents (31.7 percent) have said they have no immediate plans for construction. (See Figure 25.)
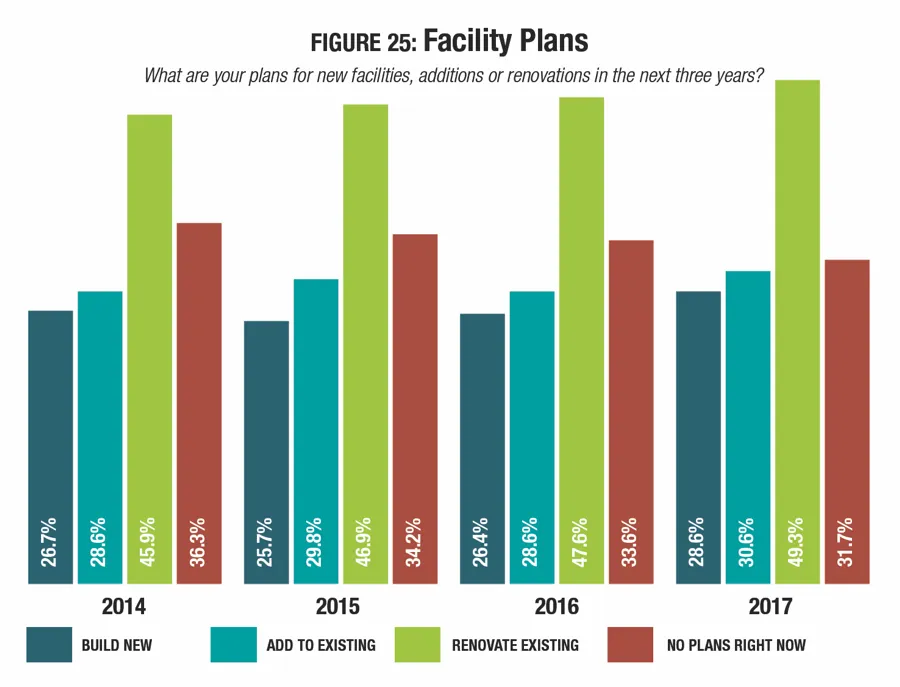
The number of respondents with plans to build new facilities grew this year, from 26.4 percent in 2015 to 28.6 percent in 2017. Likewise, the number who are planning additions increased, from 28.6 percent to 30.6 percent, and the number planning renovations also increased, from 47.6 percent to 49.3 percent.
Camp respondents were the most likely to report that they have plans for construction, which should come as no surprise, given that these respondents also have the oldest facilities, on average. More than eight out of 10 (84.2 percent) camp respondents said they have plans for construction. They were followed by parks (75.9 percent) and Ys (72.1 percent). Respondents from schools and colleges were the least likely to have construction plans in the works, though more than half in each case (55.2 percent and 57.4 percent, respectively) did have plans for construction.
Construction plans of all kinds were most commonly planned by camps. Some 41.2 percent of camp respondents were planning new facilities, while 43.9 percent are planning additions, and 63.2 percent are planning renovations.
On new construction, camps were followed by parks (35.7 percent of whom were planning to build new), Ys (30.3 percent), and colleges (21.8 percent). Health club respondents were the least likely to be planning new construction, with just 14.5 percent indicating they would be building new facilities.
When it comes to additions, camps were followed by Ys (36.9 percent of whom were planning additions), parks (34.9 percent), and colleges (26.4 percent). Respondents from health clubs were the least likely to be planning to build new, with just 17.1 percent indicating they had such plans.
After camps, renovations were most commonly planned by Ys (58.2 percent of whom were planning renovations) and parks (55.9 percent). Respondents from colleges were the least likely to be planning renovations, though 38 percent of these respondents said they had such plans.
After a decrease last year of 12.5 percent, the average amount respondents are planning to spend on construction rose again in 2017. On average, respondents are planning to spend $4,299,000 on their construction plans, an increase of 22.2 percent from 2016. (See Figure 26.) Since 2011, the average budget for construction plans has not steadily grown, but rather has been variable. However, it has increased, by 9.1 percent, from $3,942,000 in 2011.
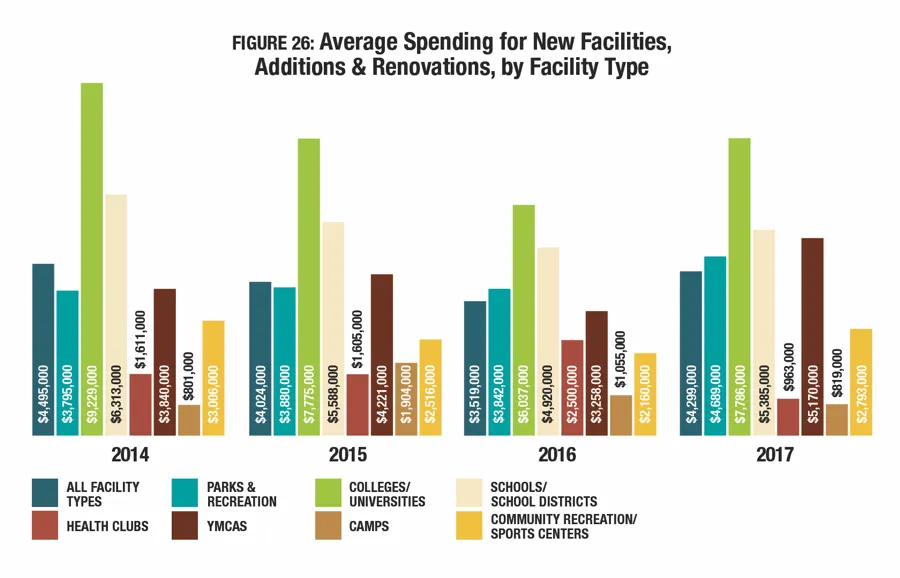
From 2016 to 2017, respondents from Ys reported the greatest increase to their average construction budget. Among Y respondents, the average budget for construction grew 58.7 percent, to $5,170,000. Other respondents reporting an increase to their construction budgets included community recreation and sports centers (up 29.3 percent to an average $2,793,000), colleges and universities (up 29 percent to $7,786,000), parks and recreation (up 22 percent to $4,689,000), and schools and school districts (up 9.5 percent to $5,385,000).
Respondents from health clubs reported a substantial drop in their construction budgets, with the average falling 61.5 percent to $963,000. But it is important to note that numbers can be more volatile in this sector due to the smaller sample size. Respondents from camps also reported a drop in their average construction budget, which fell 22.4 percent to $819,000 in 2017.
The highest spending on construction is found among colleges and universities, followed by schools and school districts, and Ys. College respondents plan to spend 81.1 percent more than the average for all facility types, while schools will spend 25.3 percent more, and Ys will spend 20.3 percent more. Park respondents also have a higher average construction cost (by 9.1 percent) than the average for all facility types.
Respondents who plan to spend less than the average for all facility types are led by those from camps, who will spend 80.9 percent less. They were followed by health clubs (at 77.6 percent less than the average for all respondents), and community recreation and sports centers (at 35 percent less).
Public organizations saw the sharpest increase to their construction budgets from 2016 to 2017, with an increase of 28 percent, from $3,877,000 in 2016 to $4,962,000 in 2017. They were followed by private nonprofits, with a much smaller increase of 8.7 percent, from $3,227,000 in 2016 to $3,508,000 in 2017. Respondents from private for-profit facilities reported that their average planned budgets for construction would drop by 9 percent, from $1,863,000 in 2016 to $1,695,000 in 2017.
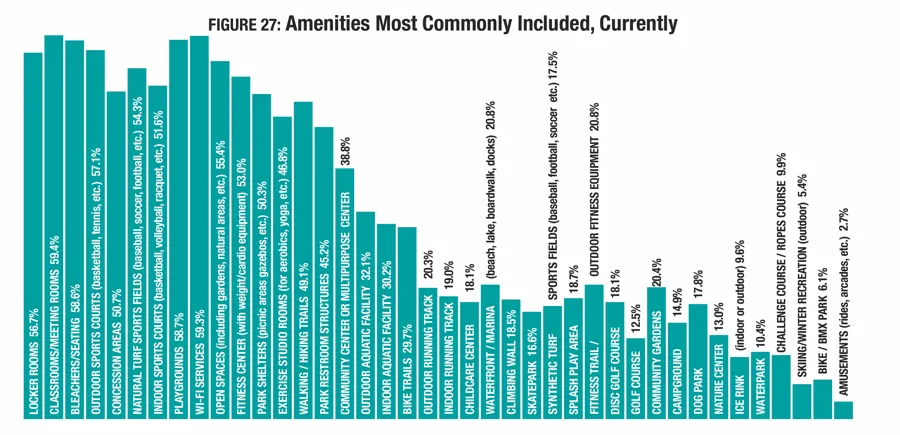
The top amenities included in respondents' facilities in 2017 include: classrooms and meeting rooms (59.4 percent); Wi-Fi services (59.3 percent); playgrounds (58.7 percent); bleachers and seating (58.6 percent); outdoor sports courts for basketball or tennis (57.1 percent); locker rooms (56.7 percent); open spaces including gardens and natural areas (55.4 percent); natural turf sports fields (54.3 percent); fitness centers (53 percent); and indoor sports courts (51.6 percent). (See Figure 27.)
For the most part, the percentage of respondents in 2017 with various sorts of amenities was fairly similar to 2016. There was an increase of at least 2 percent from 2016 to 2017 in the number of respondents whose facilities included: Wi-Fi services (up from 55.3 percent); fitness centers (up from 48.5 percent); exercise studios (up from 42.7 percent); and park restroom structures (up from 42.1 percent).
Looking back as far as 2014, there has been an increase of at least 2 percent in the number of respondents whose facilities included: playgrounds (up from 54.5 percent); open spaces (up from 51.8 percent); walking and hiking trails (up from 44 percent); community centers or multipurpose centers (up from 44 percent); indoor aquatic facilities (up from 28.2 percent); splash play areas (up from 15.4 percent); and dog parks (up from 13.2 percent).
Parks respondents were more likely than other facility types to include: playgrounds (85.5 percent of parks respondents had playgrounds); park shelters and gazebos (83.5 percent); park restrooms (79.9 percent); outdoor sports courts (69.4 percent); community and multipurpose centers (57.5 percent); bike trails (51.4 percent); dog parks (37.9 percent); community gardens (36 percent); skateparks (35.2 percent); fitness trails and outdoor fitness equipment (34.2 percent); splash play areas (31.8 percent); disc golf courses (30.1 percent); golf courses (18.8 percent); ice rinks (17.1 percent); waterparks (16.8 percent); bike and BMX parks (12.6 percent); skiing and winter recreation areas (8.5 percent); and amusements like rides and arcades (2.8 percent).
Respondents from colleges and universities were more likely than those from other facility types to include: indoor sports courts (84.1 percent of college respondents' facilities included them); indoor tracks (53.4 percent); and synthetic turf sports fields (36.1 percent).
School respondents were more likely than other facilities to include: locker rooms (86.4 percent); bleachers and seating (79.3 percent); concessions (72.8 percent); natural turf sports fields (71 percent); and outdoor tracks (64.5 percent).
Respondents from health clubs were more likely than other types of facilities to include fitness centers, with 94.7 percent indicating they had them.
Ys were more likely than other facility types to include: exercise studios (85.1 percent of Ys included them); Wi-Fi services (81.8 percent); indoor aquatic facilities (70.2 percent); classrooms and meeting rooms (68.6 percent); and childcare centers (59.5 percent).
Finally, camps were more likely than other facility types to include: open spaces such as gardens and natural areas (85.5 percent of camp respondents included them); walking and hiking trails (83.6 percent); waterfronts, marinas and beaches (65.5 percent); campgrounds (64.5 percent); challenge courses and ropes courses (50 percent); outdoor aquatic facilities (47.3 percent); climbing walls (47.3 percent); and nature centers (24.5 percent).
Some 41.5 percent of all respondents said that they had plans to add features at their facilities over the next several years. This is down slightly from 2015 and 2016, when 42.7 percent of respondents had such plans (See Figure 28.)
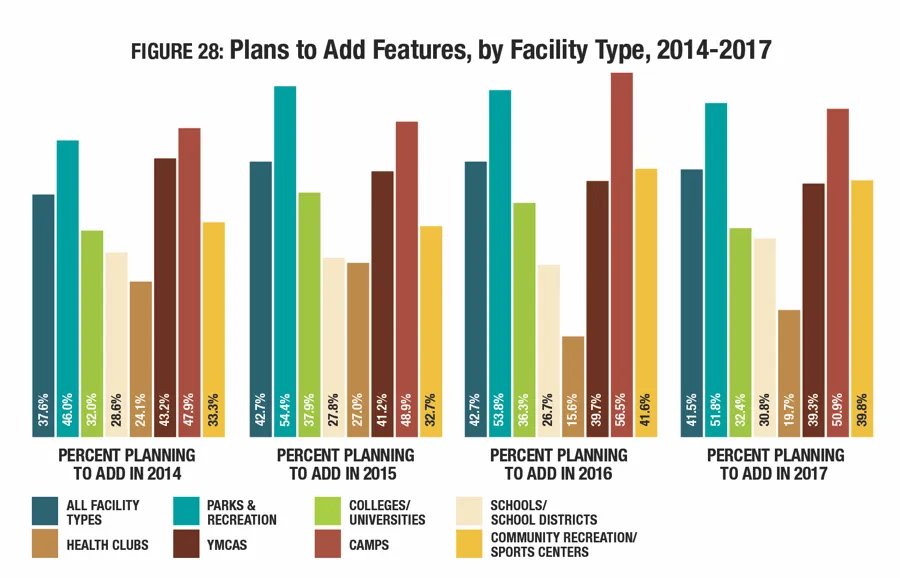
Respondents from parks and camps were the most likely to report that they had plans to add features at their facilities. Some 51.8 percent of park respondents and 50.9 percent of camp respondents said they had such plans. They were followed by community centers and Ys, 39.8 percent and 39.3 percent of which were planning to add features at their facilities, respectively.
Health clubs and schools saw an increase in the percentage of respondents planning to add features between 2016 and 2017. While 15.6 percent of health clubs and 26.7 percent of schools in 2016 said they would be adding features, in 2017, those numbers increased to 19.7 percent and 30.8 percent, respectively.
The top 10 planned features for all facility types include:
- Splash play areas (22.5 percent of those with plans to add features will add splash play)
- Fitness trails and/or outdoor fitness equipment (18.5 percent)
- Park shelters (16.5 percent)
- Playgrounds (15.6 percent)
- Synthetic turf sports fields (14.2 percent)
- Wi-Fi services (14.1 percent)
- Walking/hiking trails (14 percent)
- Fitness centers (13.8 percent)
- Restroom structures (13.3 percent)
- Bleachers and seating (11.8 percent)
Programming
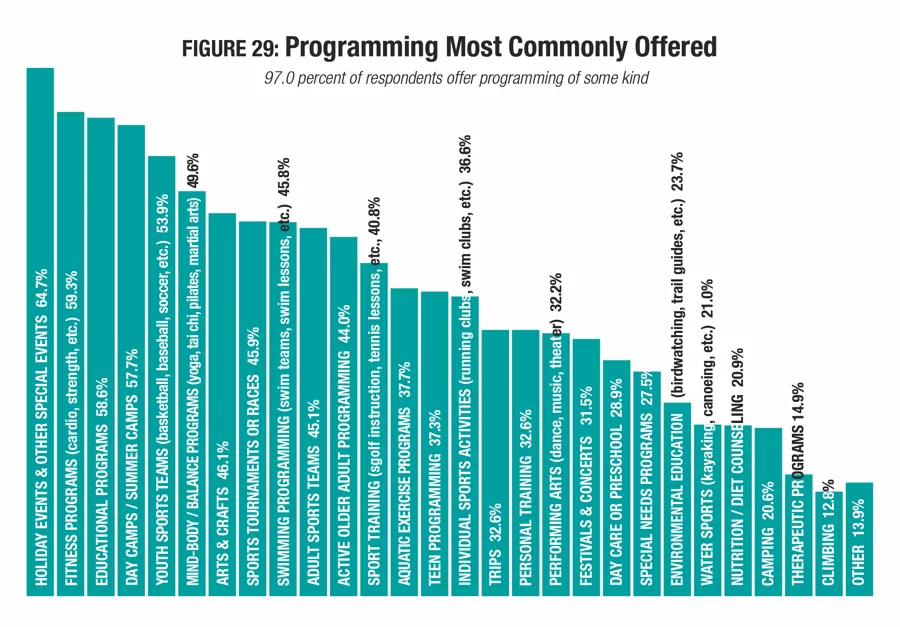
Once again, there was little change from last year's survey in the top types of programs commonly offered by survey respondents' facilities. These include: holiday events and other special events (provided by 64.7 percent of respondents); fitness programs (59.3 percent); educational programs (58.6 percent); day camps and summer camps (57.7 percent); youth sports teams (53.9 percent); mind-body balance programs such as yoga or martial arts (49.6 percent); arts and crafts (46.9 percent); sports tournaments and races (45.9 percent); swimming programs (45.8 percent); and adult sports teams (45.1 percent). (See Figure 29.)
Ys, health clubs and parks were the most likely to offer any type of programming. A full 100 percent of Y respondents said they offer programming, followed by health clubs (97.4 percent) and parks (97.3 percent). That being said, 96.5 percent of camps, 96.1 percent of community centers, 95.9 percent of schools, and 94.4 percent of colleges provide programming of some kind.
Just as they were the most likely to offer programs, respondents from Ys were the most likely to offer the most different types of programs. They were more likely than those from other types of facilities to provide: holidays and other special events; fitness programs; educational programs; day camps and summer camps; youth sports teams; mind-body balance programs like yoga and martial arts; swimming programs, programs for active older adults; aquatic exercise programs; teen programs, individual sports activities like running clubs and swim clubs; trips; performing arts; daycare and preschool; and special needs programs.
Camp respondents were more likely than those from other types of facilities to offer: arts and crafts; environmental education; water sports like canoeing and kayaking; camping; and climbing programs.
Respondents from park facilities were more likely than others to offer: sports tournaments and races; adult sports teams; sport training programs; and festivals or concerts.
Respondents from health clubs were more likely than other facility types to provide: personal training; nutrition and diet counseling; and therapeutic programs.
Nearly a third (32.2 percent) of respondents said they had plans to add more program offerings to their facilities over the next several years, up from 2016, when 31 percent said they had such plans. The 10 most commonly planned program additions in 2017 include:
Fitness programs (planned by 27.4 percent of those who will be adding programs)
Mind-body balance programs (27 percent)
Educational programs (24.2 percent)
Teen programs (24 percent)
Programs for active older adults (21.9 percent)
Environmental education (20.6 percent)
Day camps and summer camps (20.1 percent)
Holidays and other special events (19.9 percent)
Individual sports activities (18.1 percent)
Sports tournaments and races (17.6 percent)
More respondents in 2017 than in 2016 said they would be adding: fitness programs (27.4 percent vs. 26.1 percent); mind-body balance programs (27 percent vs. 25 percent); programs for active older adults (21.9 percent vs. 19.8 percent); environmental education (20.6 percent vs. 19.7 percent); day camps and summer camps (20.1 percent vs. 18.3 percent); holidays and other special events (19.9 percent vs. 17.7 percent); and adult sports teams (17.4 percent vs. 16.6 percent).
Respondents from community centers, parks and health clubs were the most likely to report that they had plans to add programs at their facilities over the next few years. Some 41.4 percent of community center respondents said they had plans to add programs, while 38.4 percent of park respondents and 32.9 percent of health club respondents said they had such plans. Schools and college respondents were the least likely to report that they would be adding programs. Some 18.6 percent of school respondents and 25.9 percent of college respondents said they would be adding programs at their facilities.
Challenges & Issues of Concern
While concerns about budgets generally are the top concern for most respondents, there are other issues that arise and create challenges for facility managers. Equipment and facility maintenance has been the top concern for several years, and continues to hold that place in 2017. Some 55.1 percent of respondents said this is a top concern for them now. (See Figure 30.)
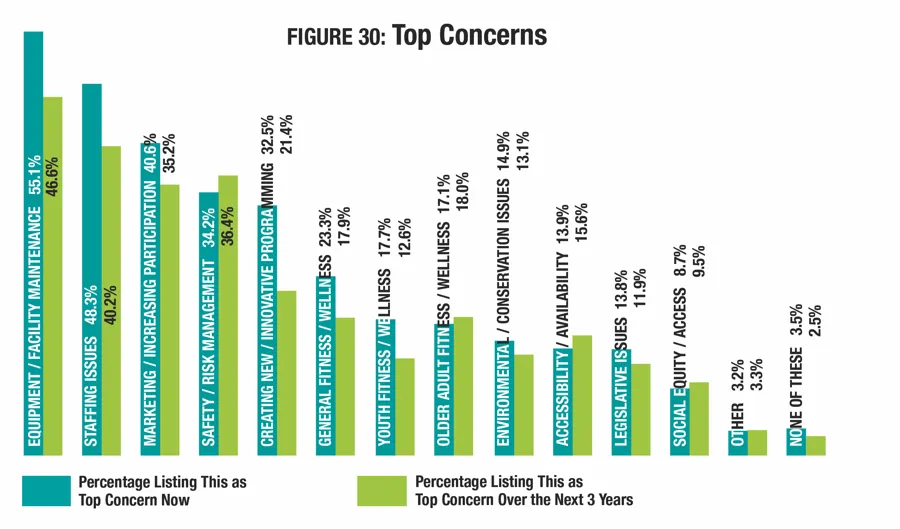
Staffing was the second most common concern, with 48.3 percent reporting this was their top concern. It was followed by marketing and increasing participation (40.6 percent); creating new and innovative programming (34.2 percent); and safety and risk management (32.5 percent).
There was an increase of at least 1.5 percentage points from 2015 to 2016 in the number of respondents who listed the following as top concerns: staffing (up 3.1 points from 45.2 percent); and older adult fitness and wellness (up 2.5 points from 14.6 percent).
For the most part, the top current concerns drop off over the next three years, with fewer participants naming them as their top issue. Exceptions to this rule in 2017 include: creating new and innovative programming, which increases from 34.2 percent to 36.4 percent; older adult fitness and wellness (from 17.1 percent to 18 percent); legislative issues (from 13.9 percent to 15.6 percent); and social equity and access (from 8.7 percent to 9.5 percent).
