


A Look At What's Happening in Recreation, Sports & Fitness Facilities
It's June, and that means it's time once again to add up the results of our extensive survey to present the State of the Industry Report. Now a dozen years running, this report highlights the opinions and summarizes the information provided by a range of professionals, mostly decision-makers, working in the recreation, sports and fitness industry. Here we offer you the most up-to-date information and trends in the industry, providing a deep look into various aspects of the market, from budgets and staffing to construction plans, programming and much more.
Around a decade ago, as the Great Recession took hold, it was fascinating to watch as the Industry Report survey results shifted, reflecting the various timelines when facilities began to feel the squeeze in their operating budgets, revenues, construction plans and even membership. As the economy has recovered, so have most of the facilities we cover here, though some have recovered more slowly than others, and facilities like colleges and universities, as well as schools and school districts still face unique challenges to their budgets and operations.
Over time, respondents have generally grown more optimistic, and the past few years have seen budgets increase, revenues rise, staffing cuts drop off and construction plans and budgets grow.
Over the course of these pages, we provide you with a detailed look at the responses collected via our annual 50-question survey, allowing you a peek into the current state of affairs, while also providing a hint to future trends that will have an impact on the management, construction, planning, programming, marketing, staffing and operations of recreation, sports and fitness facilities, from parks and summer camps to aquatic parks and college recreation centers, from YMCAs and health clubs to schools and more.
But before we dig in, allow me to take this moment to sincerely thank each and every reader who took the time to participate in our extensive survey. We know it's daunting, and the fact that you took the time to provide this detailed information illustrates how important the industry is to you, and that the results, which you are reading now, are meaningful. We couldn't do it without your enthusiasm and cooperation, reader! Thank you!
The report begins with a general summary of the survey results, considering how the entire survey population of nearly 1,600 respondents answered. In addition, here and there we will break down survey responses to show how they vary in terms of organization type, community type and industry sector. Then, on the following pages, we'll break the data down and take a closer look at the more specific information gleaned from your responses. This begins on page 40 with a look at the results broken down by regions of the country. From there, we take an in-depth look at the responses from participants whose facilities include aquatic elements (see page 50).
After that, we break things down according to the largest segments of our survey population, which includes parks and recreation organizations (see page 64), colleges and universities (see page 72), schools and school districts (see page 78), health clubs (see page 84), and Ys, JCCs and Boys & Girls Clubs (see page 88). Once you've waded through all of this information, head over to our website at RecManagement.com, where we provide exclusive online stories looking more closely at camps and community centers. Also, stay tuned in to our Rec Report newsletter, where we'll be providing additional information throughout the year that is not published in this report, highlighting a different statistic every week. And finally, be sure to keep an eye out for the July 2018 issue, where we'll discuss career and salary trends in our annual Salary Survey report.
Survey Methodology
This report is based on a survey conducted for Recreation Management by Signet Research Inc., an independent research company. An e-mail was broadcast and respondents were invited to participate. From the launch of the survey on Jan. 30, 2018, to the closing of the survey on Feb. 26, 2018, 1,581 returns were received. The findings of this survey may be accepted as accurate, at a 95 percent confidence level, within a sampling tolerance of approximately +/- 2.5 percent.
About the Respondents
Respondents to the survey represent a variety of positions within their organizations, with a majority employed in higher-level positions. More than one-third (36.1 percent) of respondents said their job title was "director," up from 32.7 percent in 2017. Nearly one-fifth (19.7 percent) are in administration and management positions, including titles such as administrator, manager and superintendent. A similar number (18.2 percent) of respondents are operations/facility managers, with titles including operations manager, facility manager, building manager or supervisor. Some 9.4 percent of respondents are in program and activity administration roles, including activity and program directors, managers, coordinators, specialists, coaches and instructors. Another 7.3 percent of respondents said they are the chairman, CEO, president, vice president or owner of their organization. Some 2.4 percent of respondents are faculty or teachers. Just 0.4 percent of respondents are in service roles, including planners, designers, architects and consultants. Finally, 6.5 percent of respondents said they have "other" job titles in their organization.
With so many respondents representing career-level positions in the recreation, sports and fitness industry, it comes as no surprise that they rack up a lot of experience, both in their current positions and in the industry, in general. On average, respondents have held their current jobs for 11.2 years, and have an average of 21.3 years of experience in the recreation, sports and fitness industry.
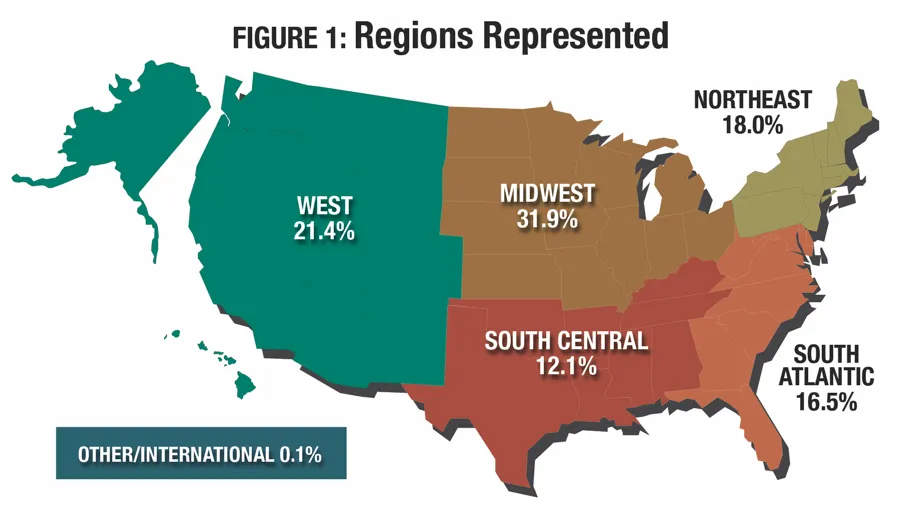
The largest number of respondents in 2018 are from the Midwest, with nearly one-third (31.9 percent) of respondents. (See Figure 1.) This includes Illinois, Indiana, Iowa, Kansas, Michigan, Minnesota, Missouri, Nebraska, North Dakota, Ohio, South Dakota and Wisconsin.
The second largest region, in terms of survey representation is the West, with 21.4 percent. This includes Alaska, Arizona, California, Colorado, Hawaii, Idaho, Montana, Nevada, New Mexico, Oregon, Utah, Washington and Wyoming.
The Northeast is home to 18 percent of survey respondents. This includes Connecticut, Maine, Massachusetts, New Hampshire, New Jersey, New York, Pennsylvania, Rhode Island and Vermont.
Some 16.5 percent of respondents said they are from the South Atlantic states, down from 20.2 percent in 2017. The South Atlantic includes Delaware, Florida, Georgia, Maryland, North Carolina, South Carolina, Virginia, Washington, D.C., and West Virginia.
Finally, the South Central region is represented by 12.1 percent of respondents. This region includes Alabama, Arkansas, Kentucky, Louisiana, Mississippi, Oklahoma, Tennessee and Texas.
Finally, just 0.1 percent of survey respondents said they are from outside the United States.
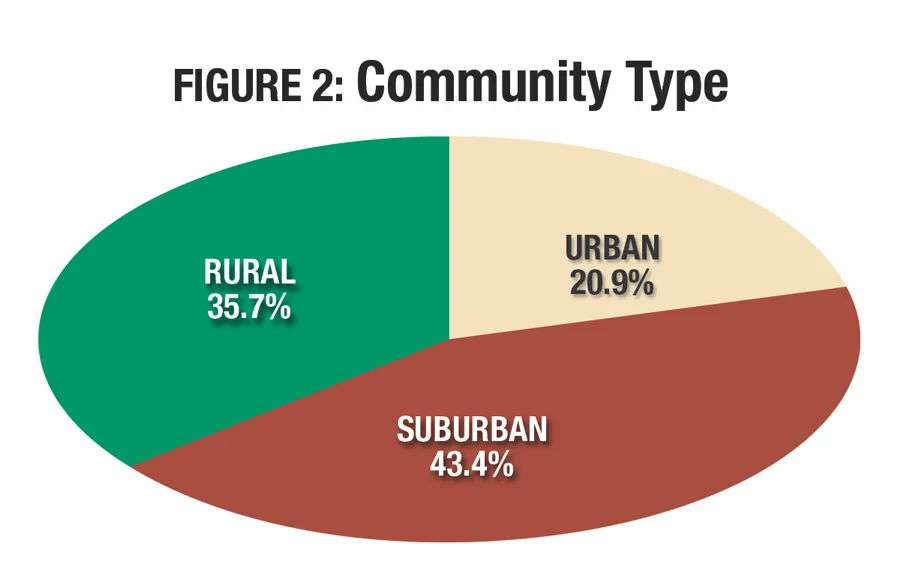
As is generally the case, the largest percentage of respondents said they are from suburban communities. Some 43.4 percent of respondents said they call the suburbs home. More than one-third (35.7 percent) said they are from rural communities, and 20.9 percent are from urban communities. (See Figure 2.)
On average, the districts, departments, facilities and organizations covered by the Industry Report survey serve a population of 83,730 people. (See Figure 3.) Well over two-thirds of respondents (68.4 percent) said their facilities reach an average of 50,000 or fewer people, and more than a third (34.5 percent) reach fewer than 10,000. Another 13.7 percent of respondents said they serve a population of between 50,000 and 99,999 people. Some 7.1 percent said their facilities reach an average population between 100,000 and 199,000. Finally, 10.8 percent said they reach a population of 200,000 or more.
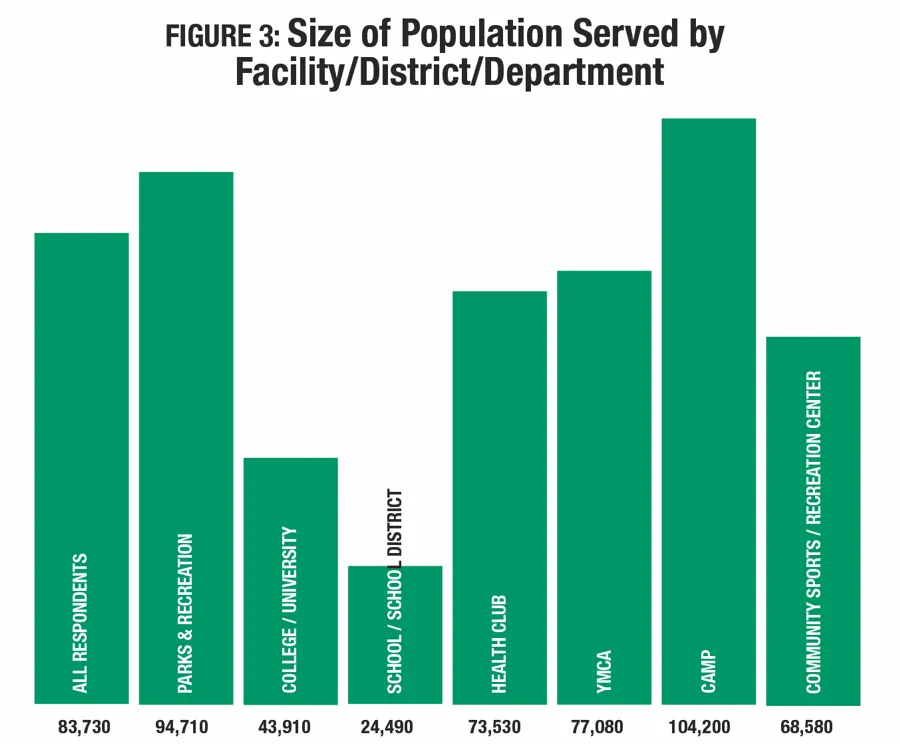
Respondents from camp facilities reach the largest populations with their facilities, serving an average of 104,200. They were followed by parks and recreation respondents, with an average population size of 94,710; Ys, with 77,080; and health clubs, with 73,530. The smallest-sized audiences are found among schools and school districts (24,490) and colleges and universities (43,910).
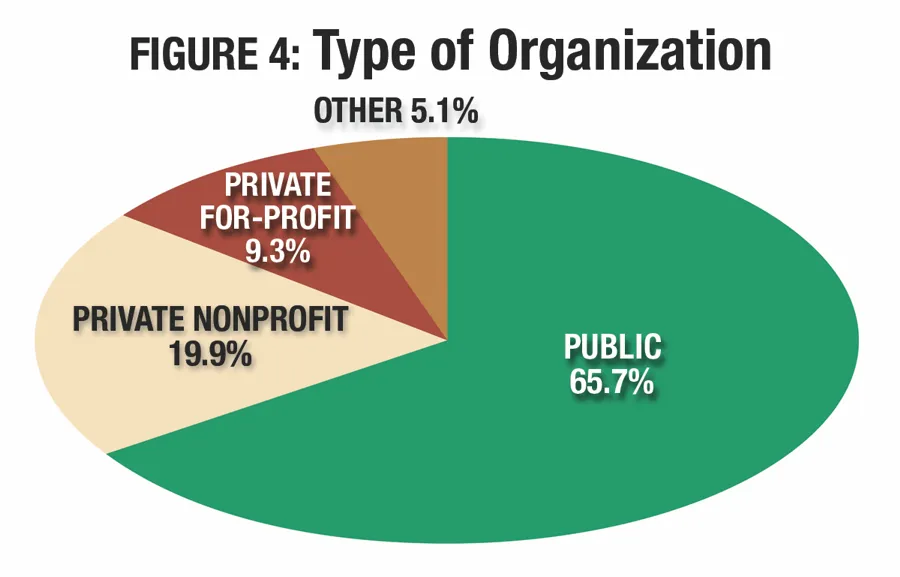
Given the large number of respondents who report from park districts and departments, universities and school districts, it is no surprise to find that nearly two-thirds of respondents (65.7 percent) said they work for public organizations. This typically includes parks and recreation departments, public schools, public universities, and other government-run facilities, such as state parks and some community recreation centers. (See Figure 4.) They were followed by those working for private nonprofit organizations. Some 19.9 percent of respondents fall into this category, which includes facilities like YMCAs, Boys & Girls Clubs, JCCs and more. Finally, 9.3 percent of respondents are with private, for-profit organizations, such as health clubs and resorts.
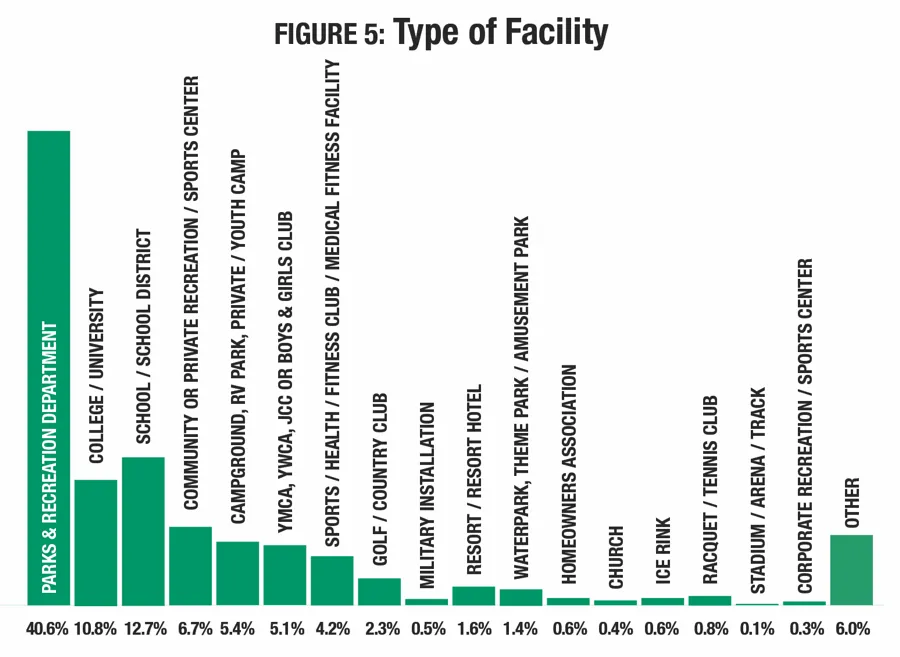
As always, the largest percentage of respondents are from parks and recreation departments, park districts and similar organizations. Some 40.6 percent of respondents said they work for parks. (See Figure 5.) They were followed by respondents from schools and school districts (12.7 percent), colleges and universities (10.8 percent); community or private recreation and sports centers (6.7 percent); campgrounds, RV parks and private or youth camps (5.4 percent); YMCAs, YWCAs, JCCs and Boys & Girls Clubs (5.1 percent); and sports, health, fitness clubs and medical fitness clubs (4.2 percent). Smaller numbers of respondents reported from other types of facilities, including: golf and country clubs (2.3 percent); resorts and resort hotels (1.6 percent); waterparks, theme parks and amusement parks (1.4 percent); racquet and tennis clubs (0.8 percent); homeowners associations (0.6 percent); ice rinks (0.6 percent); military installations (0.5 percent); churches (0.4 percent); corporate recreation and sports centers (0.3 percent), and stadiums, arenas and tracks (0.1 percent). Another 6 percent of respondents said they work for "other" types of facilities.
Some types of facilities are more typically found in certain types of communities, with some being more prevalent in the suburbs or in rural areas.
For example, 61.1 percent of golf and country clubs in the survey are found in suburban communities. Other facility types that are more typically found in the suburbs include health clubs (58 percent are in suburban communities), parks (49.9 percent) and YMCAs (41.9 percent).
Respondents from camps and campgrounds are most likely to be located in rural communities. Nearly three-quarters (74.1 percent) of camp respondents said they are located in rural areas. Other facility types that are more commonly found in rural areas than in other community types include schools and school districts (59 percent are in rural communities) and resorts and resort hotels (53.8 percent).
Colleges and universities are the only facility type that was more commonly found in urban areas than in other types of communities. Some 35.3 percent of college respondents said they are located in urban areas.
Likewise, when it comes to organization types, some kinds of facilities are more likely to be managed by public, or government-based organizations, while others are more likely to be owned by for-profit or nonprofit organizations. Respondents from parks were the most likely to report that they are with public organizations, with 95.3 percent of these respondents indicating that they are public. They were followed by schools and school districts (91.5 percent), and community sports and recreation centers (68.8 percent). More than half of college and university respondents (52.9 percent) said they are with public organizations, while 38.2 percent said they are private nonprofits.
Respondents from Ys were the most likely to be from private nonprofits, with 95.1 percent of Ys and similar facilities, such as JCCs and Boys & Girls Clubs, indicating that they are with this type of organization. They were followed by medical fitness facilities (68.8 percent), and camp facilities (60 percent).
Finally, private for-profit organizations were most common among resorts and resort hotels, 69.2 percent of which are with this type of organization. They were followed by health clubs (60 percent), and waterparks, theme parks and amusement parks (54.5 percent).
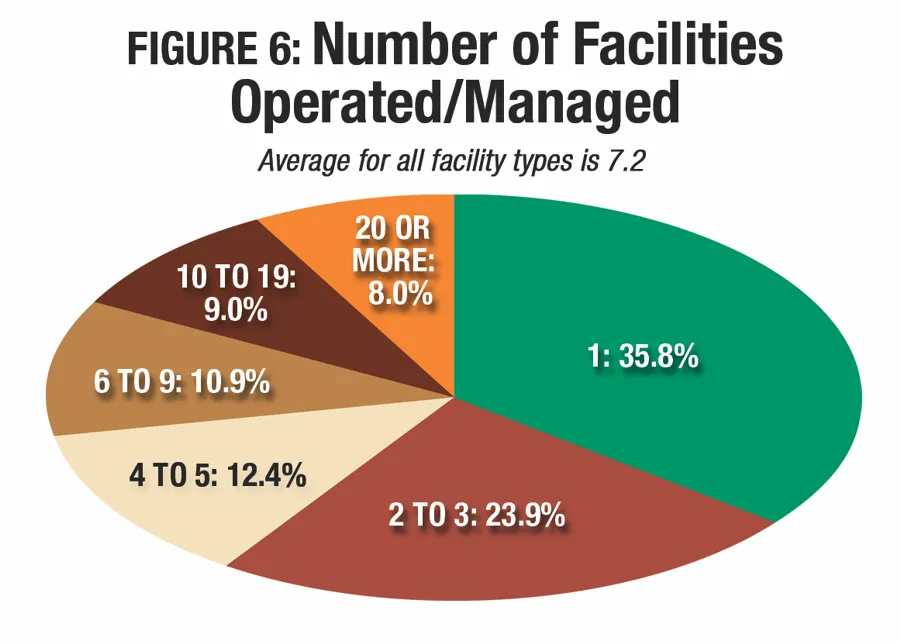
On average, survey respondents manage 7.2 facilities, which is consistent with past years, when the average has ranged from 6.4 to 7.4. Well over half (59.7 percent) reported that they manage between one and three facilities. Nearly a quarter (23.3 percent) said they manage between four and nine facilities. And another 17 percent manage 10 or more facilities. (See Figure 6.)
Respondents from urban and suburban communities were more likely than those from rural communities to report that they manage a larger number of facilities, while rural respondents were most likely to report that they manage a single facility. On average, urban respondents manage 8.1 facilities, suburban respondents manage 7.7, and rural respondents manage 5.8. Some 19.6 percent of urban respondents and 19.3 percent of suburban respondents said they manage 10 or more facilities, compared with just 12 percent of rural respondents. Conversely, 41 percent of rural respondents said they manage a single facility, compared with 34.6 percent of urban and 32.6 percent of suburban respondents.
Respondents from parks facilities were the most likely to report that they manage a larger number of facilities. On average, parks respondents manage 9.9 facilities, with 27 percent reporting that they manage 10 or more. (See Figure 7.) They were followed by school respondents, who manage an average of 8.2 facilities, with 19.5 percent reporting that they manage 10 or more.
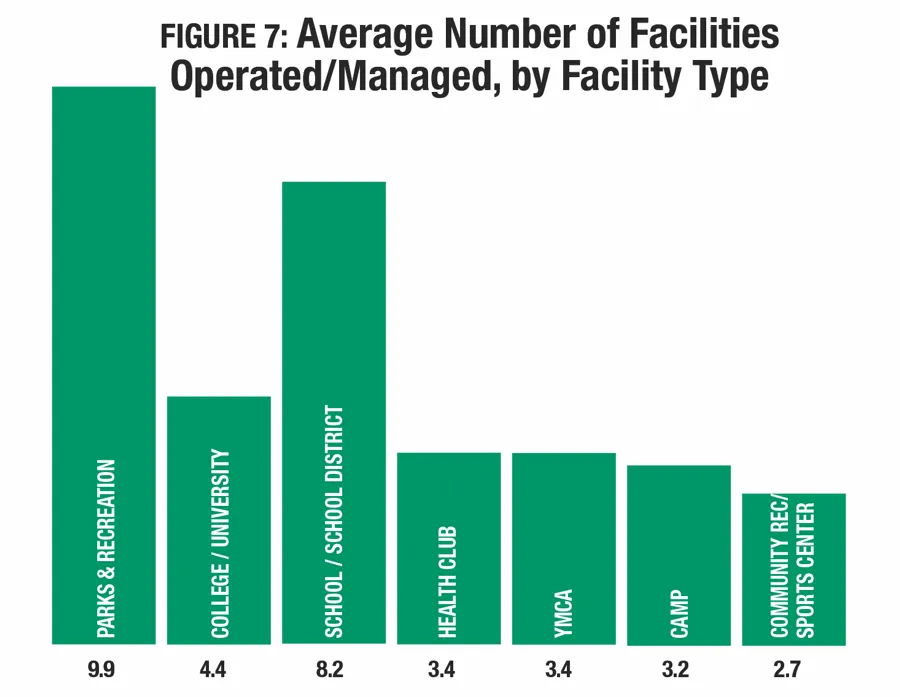
Respondents from camps, health clubs and Ys were the most likely to report that they manage just a single facility, with 62.4 percent of camp respondents, 56.1 percent of health club respondents and 53.1 percent of Y respondents indicating that they manage just a single facility. However, community recreation and sports centers had the lowest average number of facilities, with 2.7.
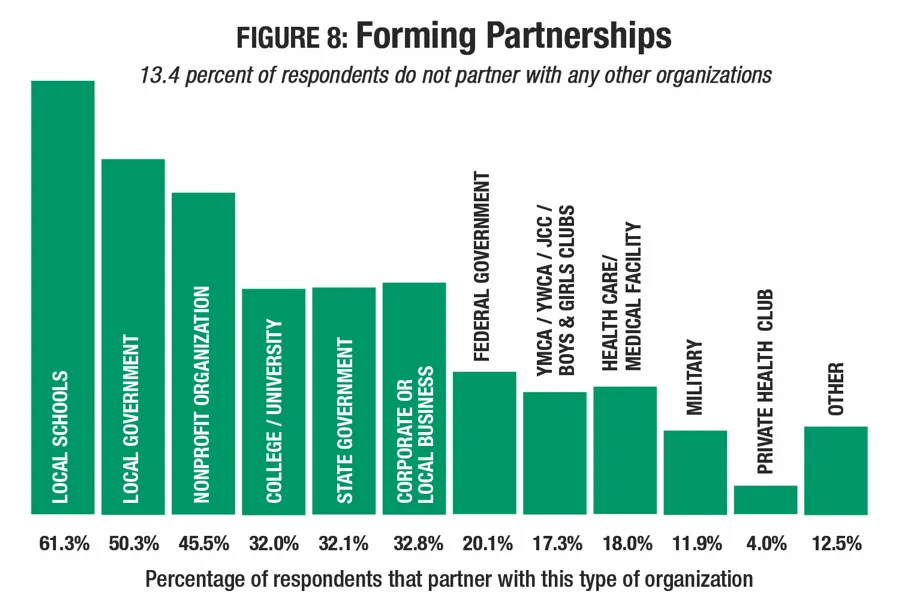
Forming partnerships with other organizations is a common strategy for recreation, sports and fitness facility owners, providing them with additional opportunities and resources to expand programming and capabilities. In fact, a substantial majority (86.6 percent) of respondents said they form such partnerships, a number that has held fairly steady over time (86.8 percent in 2017 said they had partnered, and 87.2 percent had done so in 2016).
Local schools continue to hold the top spot as the most common type of partner for all facility types. More than six in 10 (61.3 percent) of survey respondents said they had partnered with local schools. (See Figure 8). They were followed by local government (50.3 percent), nonprofit organizations (45.5 percent), corporate or local businesses (32.8 percent), and state government (32.1 percent).
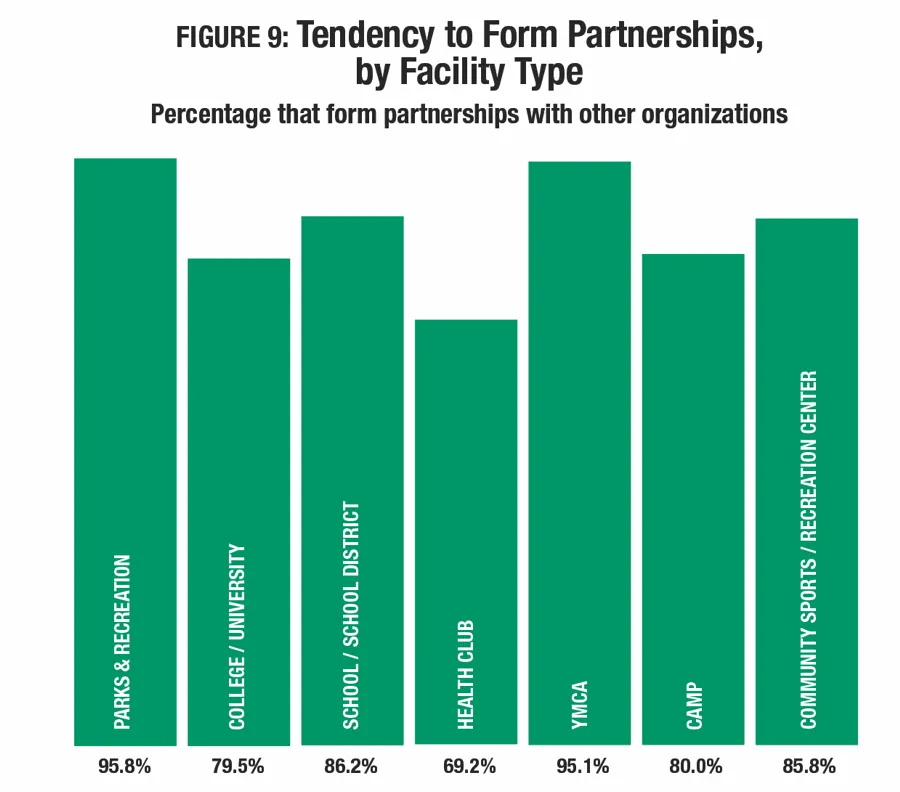
Respondents from parks and recreation organizations were the most likely to report that they had partnered with outside organizations, while those from health clubs were the least likely to form partnerships. Some 95.8 percent of park respondents, 95.1 percent of Ys and 86.2 percent of school respondents said they had formed partnerships, compared with 69.2 percent of health clubs. (See Figure 9.)
As usual, respondents from Ys were the most likely to report that they had partnered with many of the different types of organizations included in the survey. Of the various market segment groups, Ys were the most likely to partner with local schools (87.7 percent of Ys had partnered with local schools), nonprofit organizations (80.2 percent), corporate and local businesses (67.9 percent), other Ys (51.9 percent), the military (34.6 percent), and the federal government (22.2 percent).
Respondents from parks were the most likely to report that they had partnered with local government, with 67.4 percent of park respondents reporting they had formed such partnerships. They were also more likely than others to partner with state government (37.3 percent). Respondents from health clubs were the most likely to have partnered with health care or medical facilities (41.5 percent) and other private health clubs (10.6 percent). Finally, respondents from colleges and universities were the most likely to indicate that they had partnered with other colleges and universities, with 60 percent indicating they had formed such partnerships.
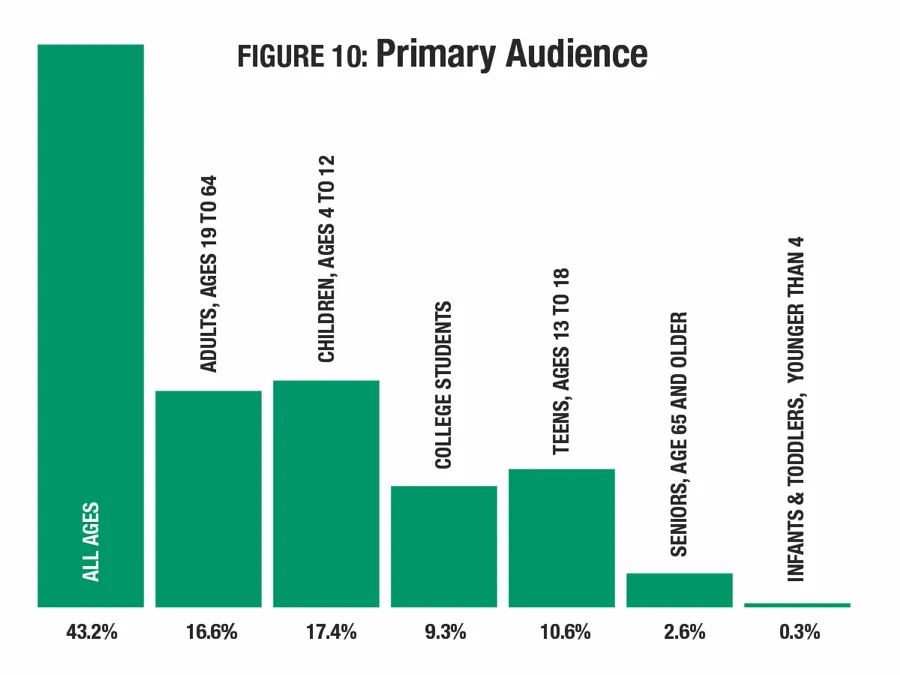
When it comes to the age groups primarily served by their facilities, the largest number of respondents indicate that they reach all ages. (See Figure 10.) Some 43.2 percent of respondents said their facilities are meant primarily for an all-ages audience. Some 17.4 percent said they primarily reach children ages 4 to 12, and 16.6 percent mainly serve adults ages 19 and up. Much smaller numbers of respondents reach more specific audiences, including teens age 13 to 18 (10.6 percent of respondents named this as their primary audience), college students (9.3 percent), seniors ages 65 and up (2.6 percent), and infants and toddlers younger than 4 (0.3 percent).
When the primary audience is looked at through the lens of specific facility types, it comes as no surprise to find that certain types of facilities are more likely to serve specific audiences than others.
Respondents from Ys were the most likely to report that they serve all ages, with 55.6 percent indicating that this is their primary audience. They were followed by parks (54.9 percent), and community centers (48.1 percent).
Children ages 4 to 12 are most likely to be the primary audience for camp respondents, 30.6 percent of whom said they primarily reach children. They were followed by parks (26 percent) and community centers (23.6 percent).
Adults from 19 to 64 years old are most likely to be the primary audience for health club respondents. Nearly three-quarters (71.2 percent) of health club respondents said they primarily reach adults. They were followed by Ys, at 22.2 percent.
Teens are most likely to be the primary audience for school respondents. Some 54 percent of schools said they primarily reach teens. They were followed by camps (21.2 percent).
College students are obviously most likely to be the primary audience for colleges and university respondents, 83.4 percent of whom said this was their main audience. Health clubs are more likely than other facility types to reach seniors, with 10.6 percent naming this as their primary audience. Finally, community centers are more likely than others to have an audience of infants and toddlers (1.9 percent said this was their primary audience).
Revenues & Expenditures
Since 2010, the percentage of respondents who report that their revenues are increasing year-over-year has risen, while the percentage reporting revenues has fallen. From 2010 to 2011, 37 percent of respondents to the 2012 Industry Report said that they had seen revenues increase, while 20.8 percent reported a decrease in revenue.
In 2018, 41 percent of respondents to the survey said that revenues increased from 2016 to 2017, while 11.1 percent reported a decrease. (See Figure 11.)
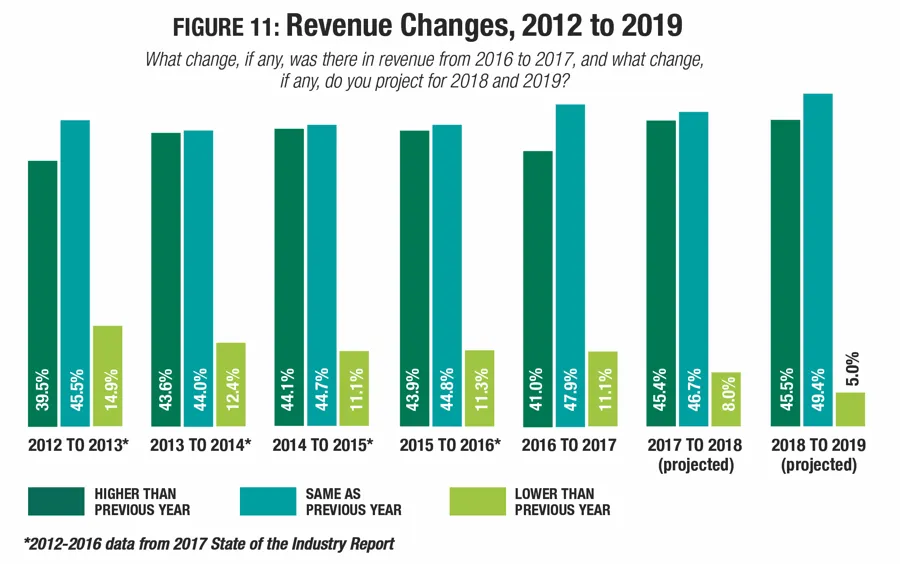
Looking forward, respondents are even more hopeful, with 45.4 percent expecting an increase to revenues in 2018, and 45.5 percent in 2019, while 8 percent and 5 percent, respectively, project a decrease.
Suburban respondents were more likely to report positive changes to revenues in both 2017 and 2018, while respondents from urban and rural communities were slightly less optimistic. From 2016 to 2017, 44.1 percent of suburban respondents said they expect revenues to increase, compared with 39 percent of rural respondents and 38.3 percent of urban respondents. Similarly, from 2017 to 2018, 49.7 percent of suburban respondents are expecting revenues to increase, compared with 42.1 percent of urban and 42.1 percent of rural respondents.
Looking forward, respondents from urban communities are more optimistic about positive changes to revenues, while rural respondents are not. From 2018 to 2019, 50 percent of urban respondents expect revenues to increase, and just 4.3 percent project a decrease. For rural respondents, 41.6 percent are expecting an increase, while 7.2 percent project a decrease. Suburban respondents are least likely to expect revenues to fall in that time frame. Just 3.5 percent project a decrease, and 46.7 percent expect revenues to increase.
Respondents from camps, Ys and community centers were the most likely to report that their revenues had increased from 2016 to 2017, while those from schools and colleges were the least likely to report an increase. At the same time, health clubs were the most likely to report a decrease in revenues. From 2016 to 2017, 63.1 percent of camp respondents said their revenues had increased (up from 56.7 percent who saw an increase in 2016). They were followed by Ys (53.8 percent of whom reported an increase), community centers (47.6 percent), health clubs (46.9 percent), and parks (44.2 percent). In that same time frame, only 16.3 percent of school respondents said their revenues had increased (down from 21 percent in 2016), while 26.3 percent of college respondents reported an increase. Some 21.9 percent of health club respondents said their revenues had fallen, indicating less stability in revenues.
Looking forward, respondents from camps, Ys, parks, health clubs and community centers were the most optimistic regarding revenue increases, while colleges and schools were the most likely to expect revenues to fall. From 2017 to 2018, 63 percent of camp respondents said they expect revenues to increase, and from 2018 to 2019, 63.6 percent expect an increase. They were followed in 2017-18 by Ys (58.2 percent of whom expect an increase) and parks (51 percent), and in 2018-19 by health clubs (56.5 percent) and community centers (52 percent).
Conversely, from 2017 to 2018, 15.4 percent of college respondents and 12.2 percent of school respondents said they expect their revenues to decrease. And, from 2018 to 2019, 12 percent of school respondents projected a decrease, followed by college respondents (7.6 percent).
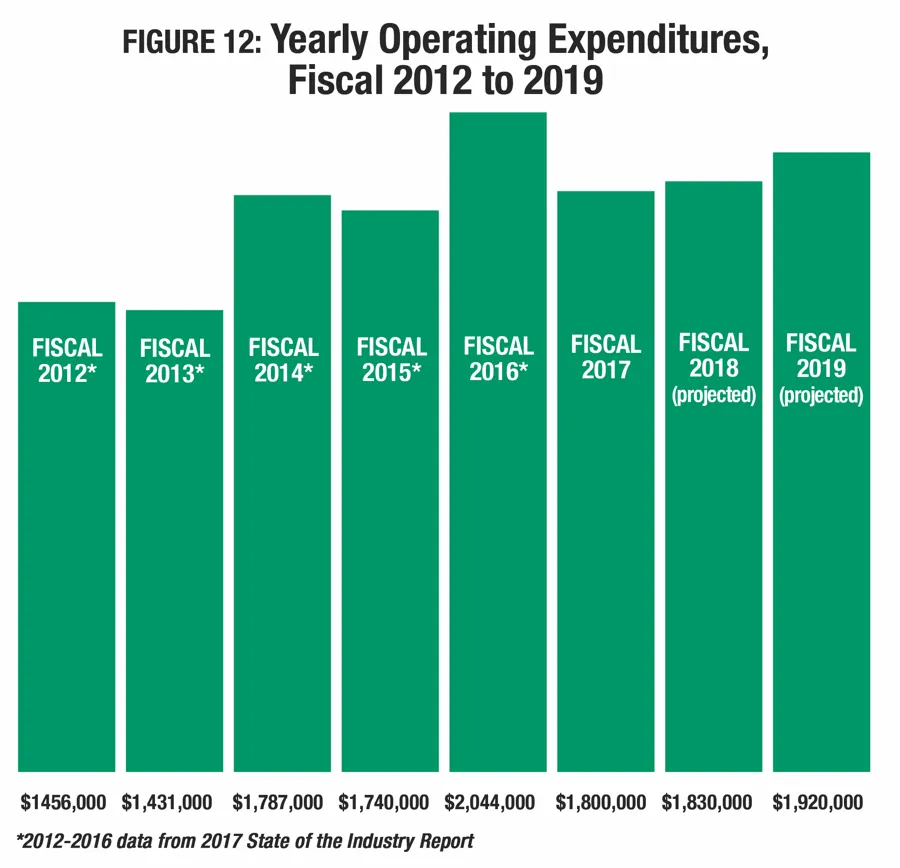
After a significant increase in operating expenditures in fiscal 2016, costs have fallen again in 2017, and are expected to rise more steadily over the next two years, though not to the high reported last year. (See Figure 12.) Following a 17.5 percent increase in operating expenditures in 2016, from 2016 to 2017, the average operating expenditures fell 11.9 percent to $1,800,000. This represents a 23.6 percent increase since 2012.
Respondents from urban communities reported the greatest decrease to their operating expenses from 2016 to 2017, while suburban and rural respondents reported a more moderate decrease. For urban respondents, average operating expenditures fell 22.6 percent, from $2,713,000 in fiscal 2016 to $2,100,000 in 2017. They were followed by suburban respondents, who reported a 6.2 percent decrease from $2,409,000 in 2016 to $2,260,000 in 2017. Finally, respondents from rural communities saw a 1.6 percent decrease, from an average of $1,057,000 in 2016 to $1,040,000 in 2017.
Looking forward, rural respondents bucked the usual trend to report the greatest increase to average operating expenditures over the next two years. From 2017 to 2019, rural respondents said they expect their average operating expense to grow 11.5 percent, to $1,160,000. They were followed by urban respondents, who projected a 10 percent decrease, to $2,310,000. Suburban respondents projected a 4 percent increase in average operating expenditures from 2017 to 2019, to an average of $2,350,000.
Between fiscal 2016 and 2017, community centers, schools, and colleges and universities reported increases to their average operating expenditure, while all other types of facilities reported decreases. The greatest increase was seen by community center respondents, who saw their average operating expense rise 10.4 percent, to $1,310,000. They were followed by schools, with a 9.2 percent increase, to $1,690,000; and colleges, with a 1.3 percent increase, to $1,930,000. (See Figure 13.)
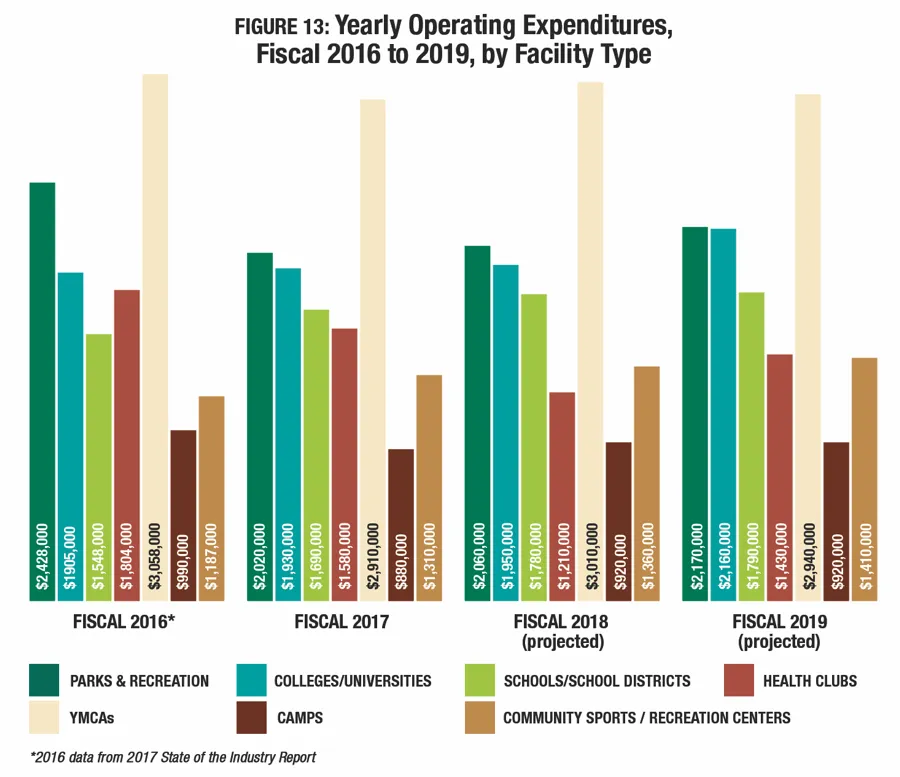
The greatest decrease in average operating costs from 2016 to 2017 was reported by parks and recreation respondents. They saw their operating expenses fall 16.8 percent in that time frame, to an average of $2,020,000. They were followed by health clubs, with a 12.4 percent decrease, to $1,580,000; and camps with an 11.1 percent decrease, to $880,000. Ys also reported a decrease, with operating expenses falling 4.8 percent, to an average of $2,910,000.
Looking forward, only health clubs expect their operating expenses to decrease between 2017 and 2019. The greatest increases are expected by colleges and universities, who projected their operating expenses to rise 11.9 percent, to an average of $2,160,000. They were followed by community centers, where a 7.6 percent increase will raise operating expenses to an average of $1,410,000 by 2019; and parks, with a 7.4 percent increase resulting in an average cost of $2,170,000. More modest increases are expected among respondents from schools (5.9 percent), camps (4.5 percent) and Ys (1 percent). Health club respondents projected a 9.5 decrease to operating expenses from 2017 to 2019.
When it comes to costs and revenues, few facilities covered by the survey reported that they recover more than 90 percent of their operating costs via revenue. The percentage recovered tends to depend upon the type of organization covered, with private organizations recovering a much higher percentage of operating costs than public organizations.
Typically, the average percentage of costs recovered for all respondents tends to hover near 50 percent, and this year is no exception. On average, respondents in 2018 said they recover 48.5 percent of operating costs in revenue. This is down slightly from 2017, when the average was 49.9 percent. Some 22.5 percent of respondents said they recover just 0 to 20 percent of their operating costs via revenues, while 20.3 percent said they recover 80 percent of more of their operating costs via revenues. More than one in 10 (15 percent) respondents earn back at least 90 percent of their operating costs via revenues, down from 18.2 percent in 2017.
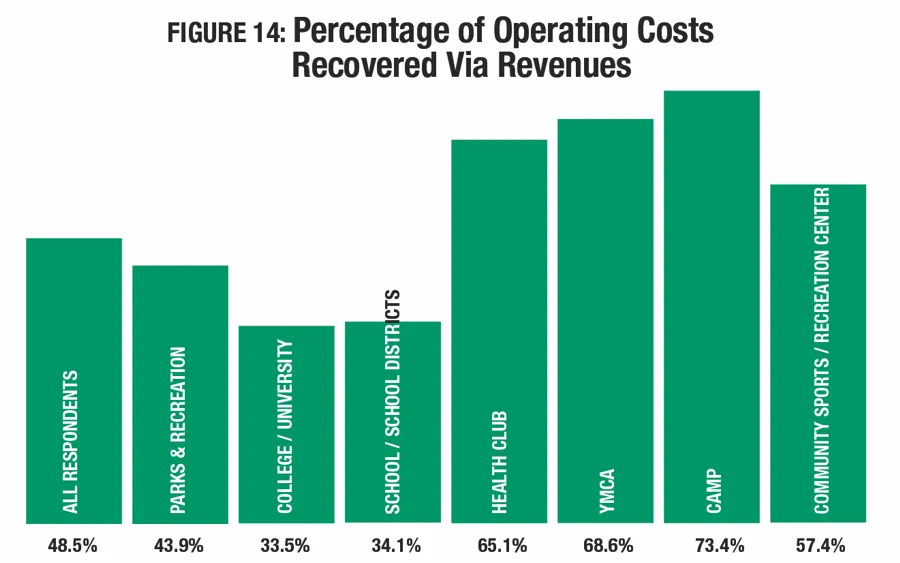
As always, there is a lot a variance in cost recovery, with some industry segments obviously relying more heavily on tax dollars, and others receiving very little outside support. Respondents from camps, Ys and health clubs are the most effective at covering their operating costs with revenues. Camp respondents said they recover nearly a quarter (73.4 percent) of their operating costs, while Ys earn back 68.6 percent, and health clubs earn back 65.1 percent. (See Figure 14.) Colleges and schools recover the smallest percentage of their operating costs, with colleges earning back 33.5 percent and schools earning back 34.1 percent.
From 2017 to 2018, only camps and parks saw an increase in the percentage of operating costs recovered via revenues. For camps, that percentage grew from 67.3 percent to 73.4 percent; and for parks, it increased from 43.4 percent to 43.9 percent.
Predictably, respondents from private, for-profit organizations earn back the greatest share of their operating costs via revenues, at 63 percent. However, this is down significantly from 2017, when these respondents said they earned back 70.4 percent of their costs. Nonprofits in 2018 said they recover 60.5 percent of their costs via revenues, representing very little change from 2017, when they recovered 60.2 percent of costs. Public organizations also reported very little change, reporting an average cost recovery of 43 percent in 2018, compared with 43.2 percent in 2017.
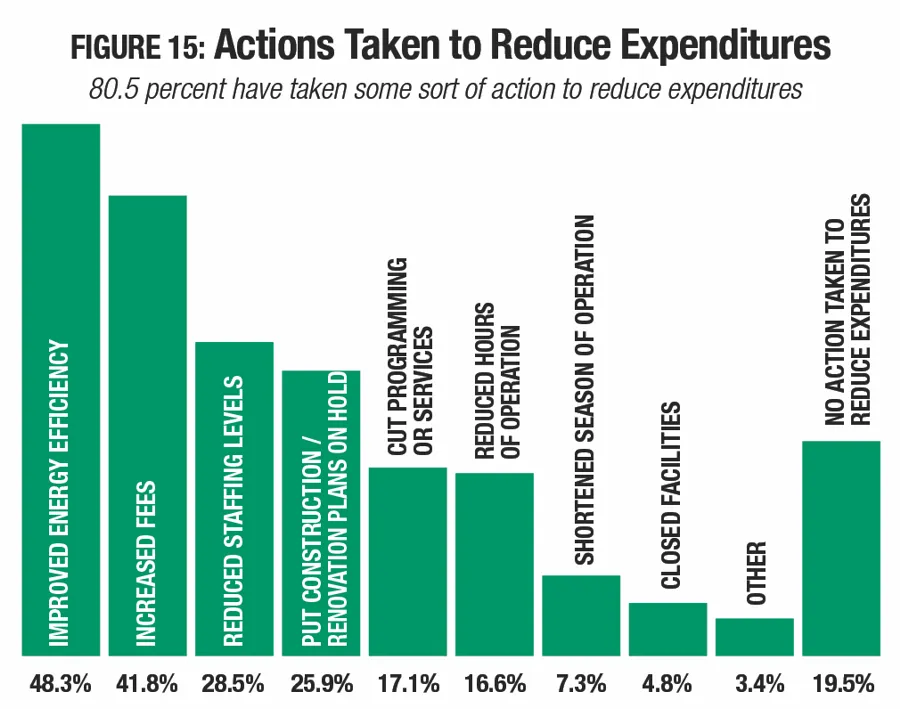
While a majority of respondents (80.5 percent) reported that they had taken action to reduce their operating expenses in the past year, that number fell from 83.3 percent in 2017. In fact, the number of respondents who report taking action to reduce expenses has fallen gradually from a high of 91.4 percent in 2010. Respondents may have been more likely to act then in order to address budgetary challenges created by the downturn in the economy, while as the economy has recovered, such projects, while still common, take on less urgency.
The most common action taken to reduce expenditures, as always, was by improving energy efficiency. Nearly half (48.3 percent) of respondents said they had improved energy efficiency in the past year in order to reduce operating expenses, down from 52.7 percent last year. Other common methods respondents turned to in order to reduce their operating costs included: increasing fees (41.8 percent), reducing staffing levels (28.5 percent), and putting construction or renovation plans on hold (25.9 percent). (See Figure 15.) Smaller numbers of respondents said they had cut programming or services (17.1 percent), reduced their hours of operation (16.6 percent), shortened their season (7.3 percent) or closed facilities entirely (4.8 percent).
Respondents from Ys, community centers and health clubs were the most likely to report that they had taken action to reduce their expenditures. Some 88.9 percent of Ys, 87.5 percent of community centers and 86.4 percent of health clubs said they had taken such action. They were followed by camps (82.1 percent had taken action to reduce expenses), parks (80.9 percent) and colleges and universities (76.2 percent). Respondents from schools were the least likely to report that they had taken action to reduce operating expenses, though nearly three-quarters (72 percent) had done so.
Respondents from Ys were the most likely to report taking several different kinds of action in order to reduce their operating expenses, including improving energy efficiency (63 percent of Ys had done so in the past year), increasing fees (54.3 percent), reducing staff (39.5 percent) and cutting programming or services (24.7 percent). Camps were the most likely to report that they had put construction plans on hold (35.7 percent). Colleges were the most likely to indicate that they had reduced their hours of operation (25.6 percent). Parks were the most likely to have shortened their season of operation (10.8 percent). And finally, schools were the most likely to report that they had closed facilities (6.7 percent).
Facility Usage & Membership
Around six in 10 respondents said they currently charge a fee for membership or for using their facilities. Some 59.5 percent said they charge a fee, down slightly from 60.1 percent in 2017. (See Figure 16.)
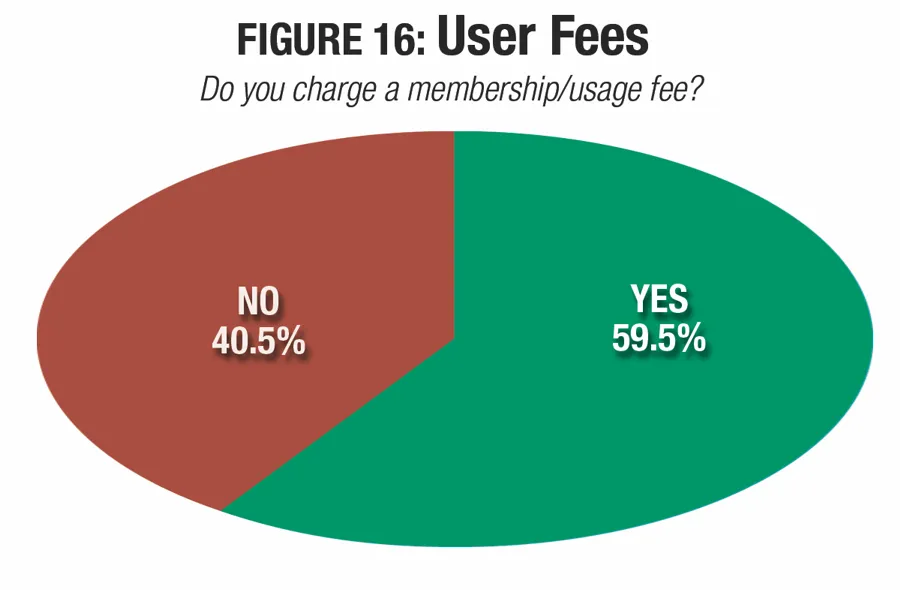
Respondents from Ys, health clubs and community sports and recreation centers were the most likely to report that they charge a fee for membership or for using their facilities. Some 97.5 percent of Y respondents, 86.4 percent of health club respondents and 69.2 percent of community center respondents said that they charge a fee for membership or use. They were followed by parks, 59.5 percent of which charge a fee.
Conversely, schools, colleges and camps were the least likely to charge a fee. Some 22.5 percent of schools, 57.1 percent of colleges and 58.8 percent of camps said they charge a fee for using their facilities.
Of those respondents who currently charge a fee for membership, more than two-thirds said they neither increased nor decreased those fees from 2016 to 2017. Some 67.5 percent said their fees remained the same over that time period, while 31 percent reported that they had increased fees. (See Figure 17.)
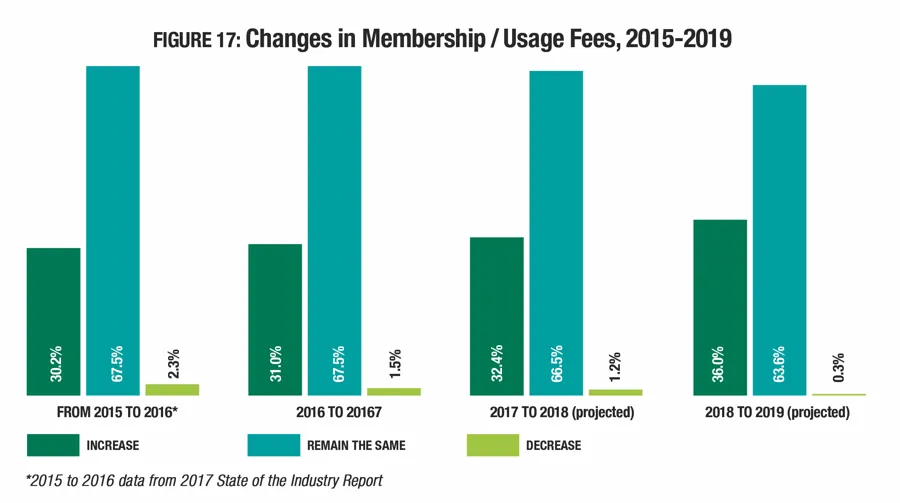
Looking forward, similar numbers plan to make no increase or decrease in their fees over the next two years, with 66.5 percent saying fees will remain the same in 2018, and 63.6 percent keeping fees the same in 2019.
Among facilities that charge a fee for membership or usage, those from camps, Ys and community centers were the most likely to report that they had raised their fees from 2016 to 2017, while school respondents were the least likely to have raised fees. Some 47.9 percent of camp respondents who charge a fee said they had raised that fee in 2017. They were followed by Ys (39.2 percent) and community centers (35.1 percent). Just 9.5 percent of school respondents who charge a fee said the fee had increased from 2016 to 2017.
The next two years will see similar trends, with camps continuing to be the most likely to plan fee increases, while schools are least likely to do so. From 2017 to 2018, 54 percent of camp respondents said fees will increase, and 48.9 percent of these respondents expect an increase in 2019. Among school respondents, 13.3 percent said they plan a fee increase for 2018, and 19.5 percent will increase fees in 2019.
In 2017, 55.8 percent of respondents said they expected usage of their facilities to increase from 2016 to 2017. Slightly fewer (50.7 percent) respondents to the 2018 survey indicated that such an increase had taken place. Another 40.8 percent said that the number of people using their facilities had remained the same, while 8.5 percent said the number of people using their facilities had decreased from 2016 to 2017. (See Figure 18.)
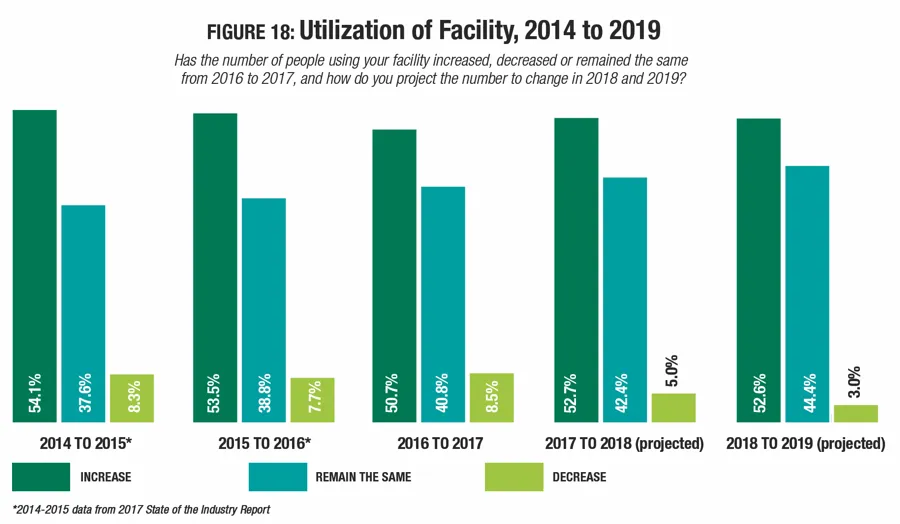
Looking forward, more than half of respondents expect to see further increases in the number of people using their facilities over the next two years, while the percentage of respondents expecting usage to decrease falls. From 2017 to 2018, 52.7 percent of respondents said they expect an increase in the number of people using their facilities, while 5 percent expect a decrease. And from 2018 to 2019, 52.6 percent of respondents said they expect an increase, while 3 percent projected a decrease.
Respondents from suburban communities were the most likely to report an increase in the number of people using their facilities from 2016 to 2017, while those from urban communities were the most likely to expect increases in 2018 and 2019. From 2016 to 2017, 53 percent of suburban communities said usage at their facilities had increased, compared with 51.4 percent of urban respondents and 47.7 percent of rural respondents. Looking forward, 57.3 percent of urban respondents said they expect an increase in 2018, while 56.2 percent expect an increase in 2019. Among suburban respondents, 54.6 percent expect increases in 2018 and 55.2 percent expect increases in 2019. Finally, 47.6 percent of rural respondents said they expect the number of people using their facilities to increase in 2018, and 47.4 percent expect an increase in 2019.
From 2016 to 2017, respondents from community centers, camps and parks were the most likely to report that the number of people using their facilities had increased, while those from schools were the least likely to see an increase. Some 61.7 percent of community center respondents said the number of people using their facilities had increased from 2016 to 2017. They were followed by camps (60 percent) and parks (56.4 percent). Less than one-third of schools (32.8 percent) said the number of people using their facilities increased in this time frame.
Looking forward, Ys, health clubs, camps, community centers and parks are most likely to project further increases, while schools continue to be least likely to expect an increase. From 2017 to 2018, 64.6 percent of Ys are expecting increases, followed by camps (59.8 percent) and parks (58.3 percent), while just 32.8 percent of schools expect an increase. And from 2018 to 2019, 63.3 percent of health clubs expect to see usage of their facilities increase. They were followed by camps (61.8 percent) and community centers (59.2 percent), while just 31.1 percent of schools expect an increase that year.
Staffing
This year saw a fairly significant drop in the average number of people employed at the organizations covered by the survey. After several years of steady growth, to a high of 147.6 employees in 2017, the average number of employees dropped in 2018, to 115.6. This represents a decrease of 21.7 percent in the past year. On average, this year's survey respondents employ 28.2 full-time workers, 39.8 part-time employees, 44.8 seasonal workers, 43.2 volunteers, and 9.1 employees of some other designation. (See Figure 19.)
As usual, Ys employ far more people than any other facility type, with an average of 200.5 employees. They were followed by parks and recreation respondents, with an average of 126.2 employees, and colleges and universities, with 110.3. Health clubs and camps employ the fewest, with an average of 78.5 and 91.2 employees, respectively.
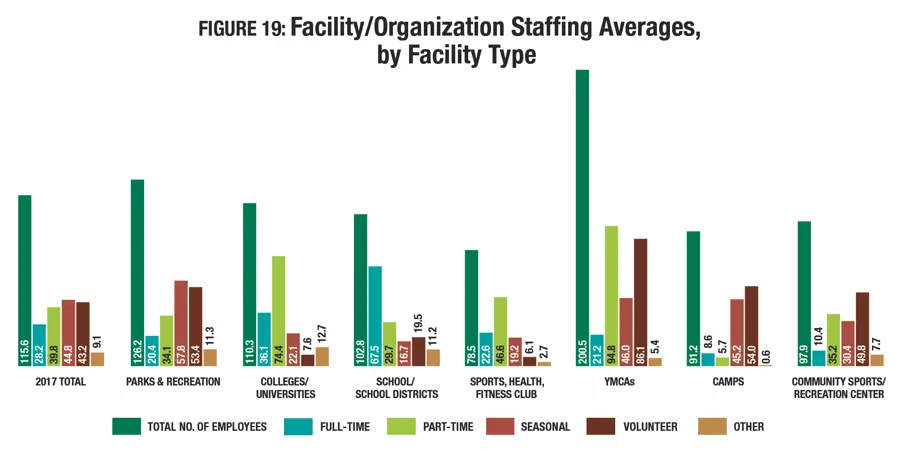
Schools and school districts have the largest number of full-time workers, with an average of 67.5. They were followed by colleges, with 36.1, and health clubs, with 22.6. Camps had the smallest number of full-time employees, with an average of 8.6.
Ys employ the most part-time workers, with an average of 94.8. They were followed by colleges and universities, with 74.4, and health clubs, with 46.6.
The greatest number of seasonal employees are employed by parks. On average, park respondents said they employ 57.8 seasonal employees. They were followed by Ys (46) and camps (45.2).
Finally, as usual, volunteers are most common among Ys, where respondents employ 86.1 volunteers on average. They were followed by camps, with 54, and parks, with 53.4 volunteers, on average.
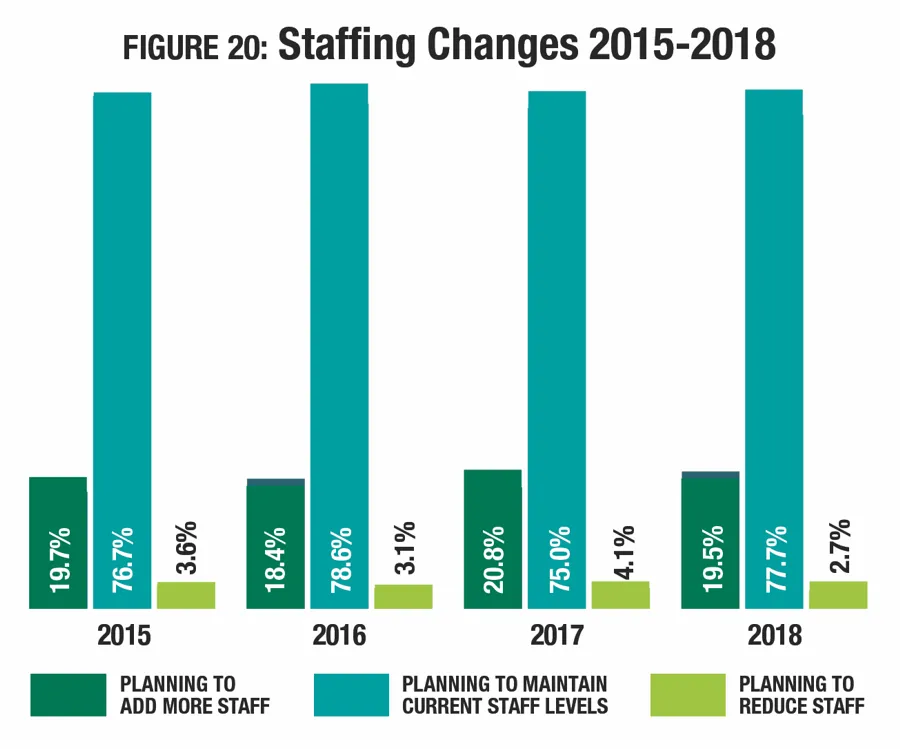
Over the past four years, the percentage of respondents who report that they are planning to add more staff has hovered around 20 percent. In 2018, more than three-quarters (77.7 percent) of respondents said they plan to maintain existing staff levels, up from 75 percent in 2017. At the same time, the percentage who plan to cut staff fell from 4.1 percent to 2.7 percent. (See Figure 20.)
On average, respondents who are planning to add additional staff will be bringing on 25.6 employees in 2018, up from 21 in 2017. Respondents in 2018 are planning to add an average of 4.2 full-time employees, 9.1 part-time employees, 9.6 seasonal employees, 15.8 volunteers, and 0.7 others.
Respondents from health clubs, parks and Ys were the most likely to report that they have plans to add staff in 2018. More than three-quarters (28.8 percent) of health club respondents said they had such plans. They were followed by parks (23.9 percent) and Ys (21 percent). Schools were the least likely to be planning to add staff. Fewer than one in 10 (9.5 percent) respondents from schools said they will be adding staff this year.
Respondents from community centers and colleges were the most likely to have plans to reduce staff, though only a minority said they will do so. Some 4.7 percent of community centers and 4.1 percent of colleges said they will be cutting staff in 2018.
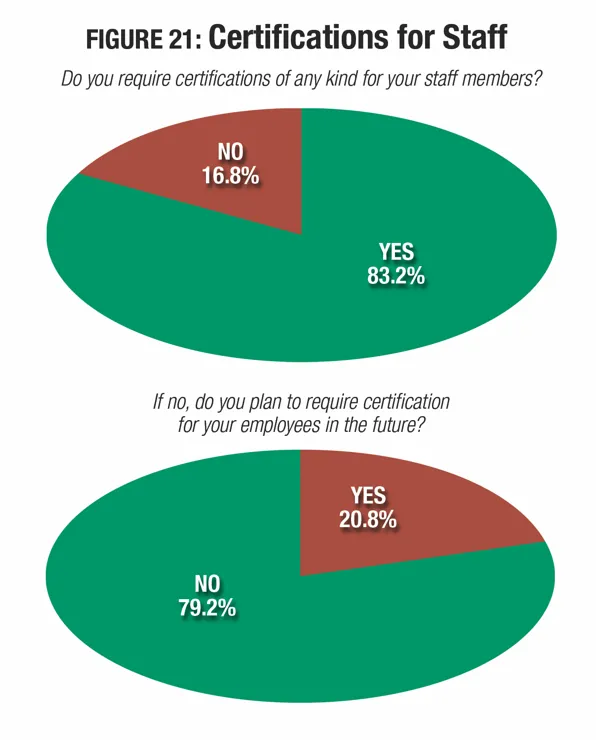
Certifications are a common tool to encourage and measure ongoing professional development and knowledge growth in one's field. Some certifications, such as lifeguard and pesticide application certifications, aim to verify the skill of certain employees to boost safety. Others measure and qualify other types of professional knowledge. A majority of respondents (83.2 percent) said that they do require certification for some staff members, up slightly from 82.9 percent in 2017. Of those who do not currently require any certifications, 20.8 percent indicated that they plan to require it in the future. (See Figure 21.)
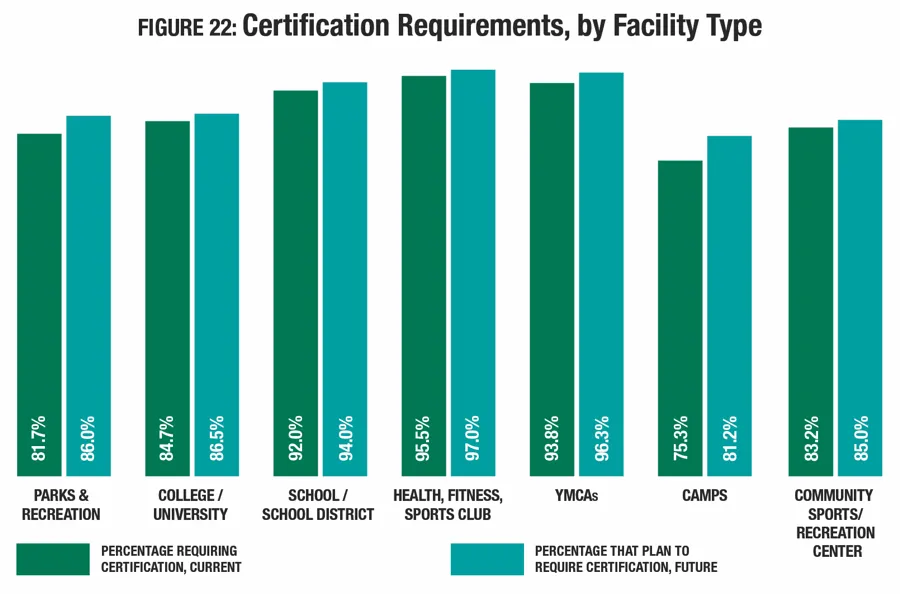
Respondents from health clubs and Ys are the most likely to require certification for some of their employees, both now and looking forward. Some 95.5 percent of health clubs currently require certification, and 97 percent plan to require it in the future. And 93.8 percent of Ys currently require certification, while 96.3 percent will require it in the future. (See Figure 22). More than nine out of 10 school respondents (92 percent) also said they currently require certification.
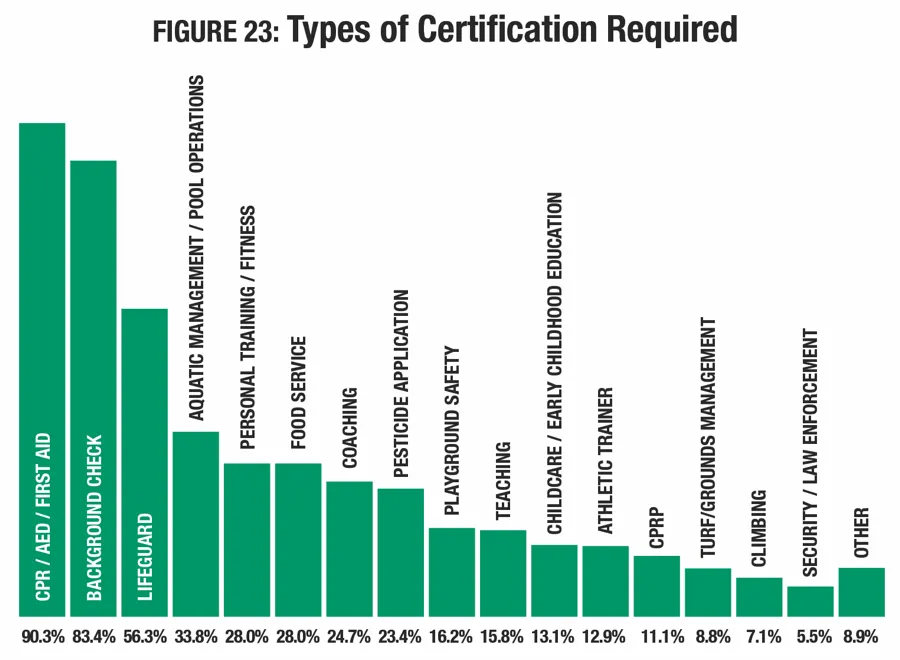
Of those respondents that require certification, the most common types of certification required included CPR/AED/First Aid (required by 90.3 percent of those who said they require some staff members to be certified), background checks (83.4 percent), and lifeguard certification (56.3 percent). (See Figure 23.) More than a quarter of respondents also require an aquatic management or pool operations certification (33.8 percent), personal training or fitness certification (28 percent), or foodservice certification (28 percent). More than one in five require a coaching certification (24.7 percent) or a pesticide application certification (23.4 percent).
Respondents from facilities that include aquatic elements were obviously much more likely to require lifeguard and aquatic management or pool operations certifications. While 56.3 percent of all respondents who require certification ask that some staff members achieve lifeguard certification, for those with aquatic facilities, that number jumps to 87.3 percent. And while 33.8 percent of all respondents require aquatic management and pool operations certifications certification, 56.3 percent of those with aquatic facilities do so.
Some facility types were more likely to require certain types of certification than others. Health clubs were the most likely to require CPR/AED training (96.8 percent) and personal training certification (82.5 percent). Ys were the most likely to require background checks (96.1 percent), lifeguard certification (84.2 percent), aquatic management/pool operations certification (53.9 percent), and childcare/early childhood education certification (52.6 percent). Camps were the most likely to require food service certification (59.4 percent), climbing certification (40.6 percent), and security/law enforcement certification (7.8 percent). Schools were the most likely to require coaching (69 percent) and teaching (59.8 percent) certifications. Parks were the most likely to require pesticide application certifications (38 percent), playground safety certification (34.2 percent), Certified Park and Recreation Professional (CPRP) certification (23.9 percent) and turf/grounds management certification (13 percent). Finally, colleges were the most likely to require athletic trainer certification (34.7 percent).
Facilities & Construction Plans
Since 2013, we have asked survey participants how old their main facility is. In that time, facilities have aged from an average of 27.5 years in 2013 to 34.4 years in 2018. Only 6.2 percent of respondents said their main facility was 5 years old or less. Another 7.5 percent said their main facility is between 6 and 10 years old. Some 21.3 percent of respondents' main facilities are between 11 and 20 years old. Another 30.7 percent have main facilities that are between 21 and 40 years old. More than one-third (34.3 percent) said their main facility is 41 years old or older. And, more than half of those (17.6 percent of all respondents) said their main facility is at least 50 years old.
The newest facilities are found among health clubs, colleges and community centers. Respondents from health clubs said their main facility is 23.2 years old on average. They were followed by colleges, with an average of 27.5 years, and community centers, at 28.4 years. (See Figure 24.)
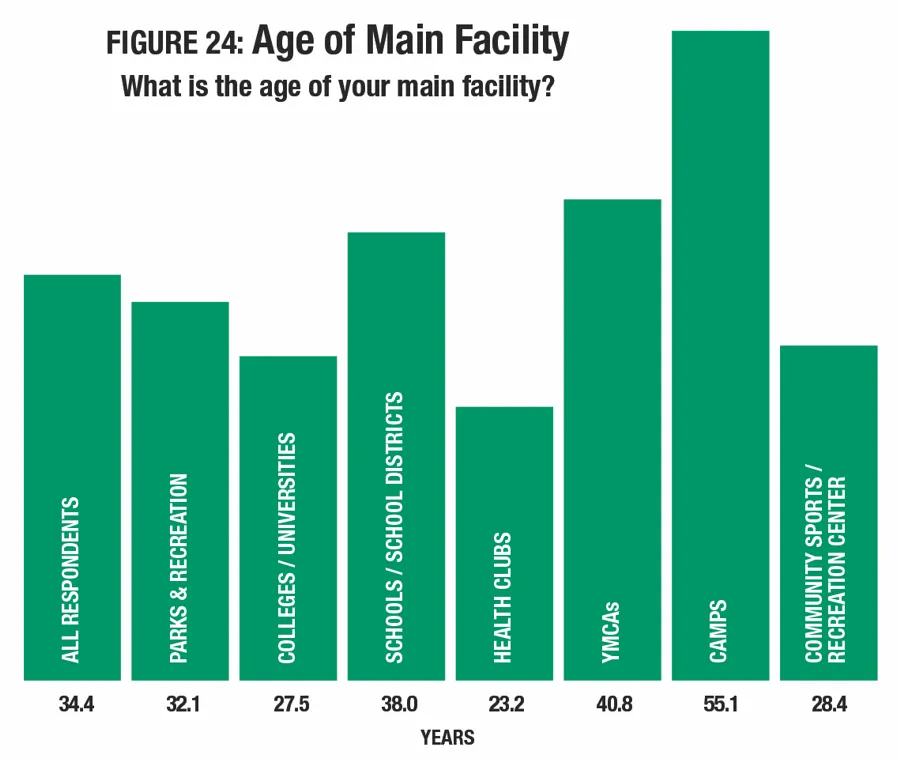
The oldest facilities are found among camps and Ys. Camp respondents said their main facility is, on average, 55.1 years old, while Y respondents' main facilities average 40.8 years.
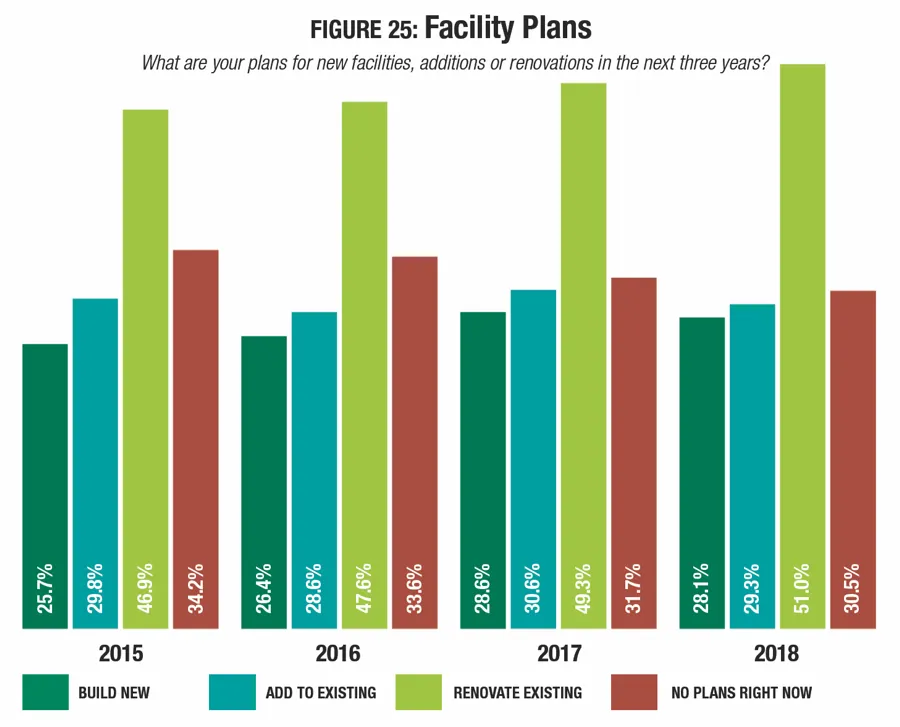
The percentage of respondents who indicate that they have plans for construction, from new facilities to additions and renovations at existing facilities, has been climbing gradually. While 62.7 percent in 2013 had such plans, that number has risen to 69.5 percent in 2018.
The number of respondents planning to build new facilities fell slightly this year, from 28.6 percent in 2017 to 28.1 percent in 2018. (See Figure 25.) The number planning additions to existing facilities also decreased, from 30.6 percent to 29.3 percent. The number of respondents planning renovations increased slightly, from 49.3 percent in 2017 to 51 percent in 2018.
Given that they have the oldest facilities, it should not be surprising that camp respondents are the most likely to report that they have plans for construction. Some 85.9 percent of camp respondents said they have plans for construction. They were followed by parks (76.6 percent). More than two-thirds of community center respondents (68.2 percent) and health club respondents (66.7 percent) also said they had plans for construction. Respondents from colleges and universities and from schools are the least likely to have construction plans in the works, though well over half (59.1 percent of schools and 54.1 percent of colleges) said they have plans for construction.
Construction plans of all kinds are most common among camps and parks. For camp respondents, 47.1 percent are planning new facilities, 45.9 percent are planning additions, and 60 percent are planning renovations. They were followed by parks, 33.9 percent of whom have plans for new construction, 32.6 percent for additions, and 57.7 percent for renovations.
When it comes to new construction, camps and parks were followed by colleges, 25.9 percent of whom said they are planning new construction. Community centers were the least likely to be planning new construction, with 15 percent indicating they have such plans.
For additions and renovations, community centers followed camps and parks, with 29.9 percent planning additions and 45.8 percent planning renovations. Health clubs are the least likely to be planning additions (21.2 percent), while colleges are the least likely to be planning renovations (37.1 percent).
The average amount respondents are planning to spend on construction fell slightly in 2018. On average, respondents plan to spend $4,290,000 on construction, a decrease of 0.2 percent from 2017, when the average was $4,299,000. (See Figure 26.). Since 2011, the average budget for construction has not steadily grown, but has been variable. That said, it has increased 8.8 percent since 2011, from an average of $3,942,000.
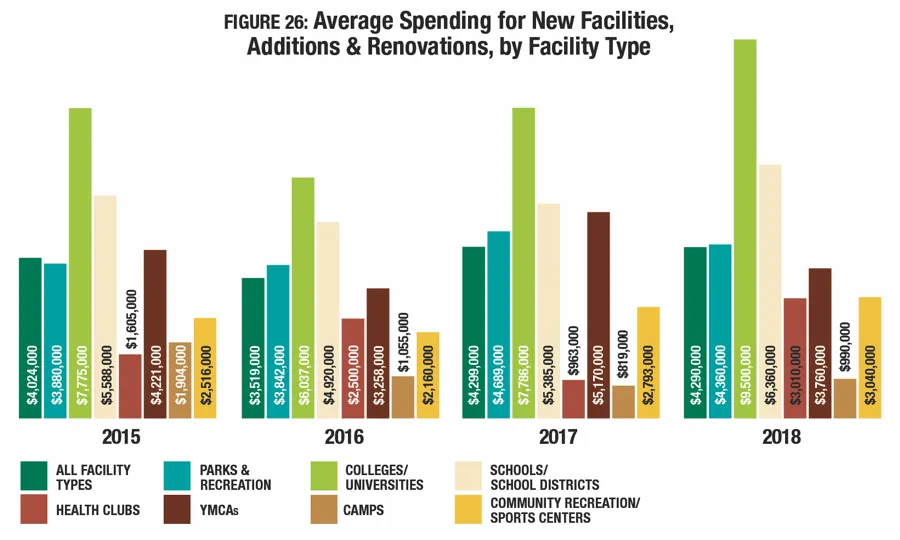
From 2016 to 2018, respondents from colleges reported the greatest increase to their average construction budget. Among respondents from colleges and universities, the average budget for construction grew 57.4 percent in those years, to an average of $9,500,000. They were followed by community centers, with a 40.7 percent increase, schools (29.3 percent) and health clubs (20.4 percent). More modest increases to construction budgets were reported by those from Ys and parks, where respondents expect to see their construction budgets increase by 15.4 percent and 13.5 percent, respectively. Only camps reported a decrease to construction budgets from 2016 to 2018, with the average cost falling 6.2 percent, to $990,000.
The highest construction spending is found among respondents from colleges and universities, followed by schools and school districts. College respondents in 2018 said they plan to spend 121.4 percent more than the average for all facility types, while schools will spend 48.3 percent more. The only other facility types with a higher-than-average construction cost was parks and recreation, where respondents plan to spend 1.6 percent more than the average for all facility types.
Respondents who plan to spend less than the average for all facility types are led by those from camps, who will spend 76.9 percent less than the average for all respondents. They were followed by health clubs (at 29.8 percent less than the average for all respondents), community centers (29.1 percent) and Ys (12.4 percent).
Public organizations saw the sharpest increase to their construction budgets from 2016 to 2018, with an increase of 28.7 percent, from $3,877,000 in 2016 to $4,990,000 in 2018. They were followed by private for-profit organizations, who projected a much more modest increase of 8.4 percent, from $1,863,000 in 2016 to $2,020,000 in 2018. Finally, respondents from private nonprofit facilities saw an increase in construction costs of 0.4 percent, from $3,227,000 in 2016 to $3,240,000 in 2018.
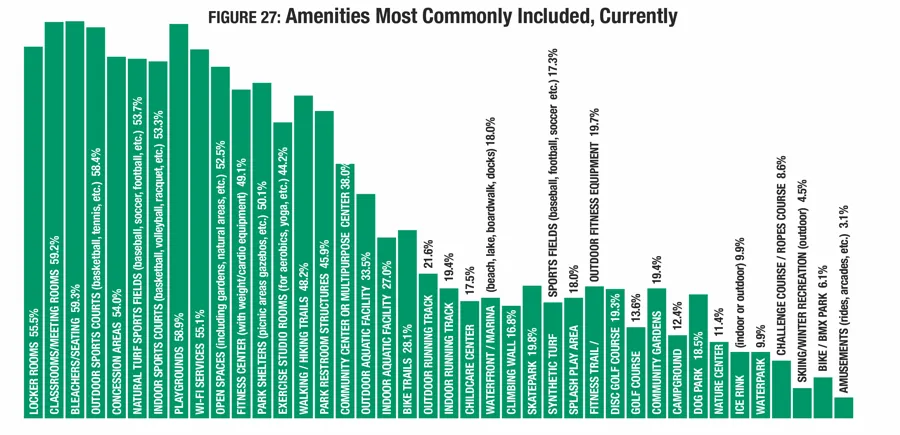
The top amenities included in respondents' facilities in 2018 include: bleachers and seating (59.3 percent of respondents said their facilities included bleachers and seating); classrooms and meeting rooms (59.2 percent); playgrounds (58.9 percent); outdoor sports courts for basketball, tennis, etc. (58.4 percent); locker rooms (55.5 percent), Wi-Fi services (55.1 percent); concession areas (54 percent); natural turf sports fields (53.7 percent); indoor sports courts (53.3 percent); and open spaces such as gardens and natural areas (52.5 percent). (See Figure 27.)
For the most part, the percentage of respondents in 2018 with various sorts of amenities changed very little from 2017. Only two types of amenities saw an increase of more than two points from 2017 to 2018. Concessions were up 3.3 points, and skateparks were up 3.2.
Looking back five years to 2014, there has been an increase of at least 3 percentage points in the number of respondents whose facilities include: dog parks (up 5.3 points from 13.2 percent); playgrounds (up 4.4 points from 54.5 percent); walking and hiking trails (up 4.2 points from 44 percent); skateparks (up 3.7 points from 16.1 percent); outdoor aquatic facilities (up 3.2 points from 30.3 percent), and disc golf courses (up 3.1 points from 16.2 percent).
Park respondents are more likely than other facility types to include: playgrounds (86.7 percent of park respondents had playgrounds); park shelters (80.4 percent); park restroom structures (75.6 percent); outdoor sports courts (74.4 percent); community/multipurpose centers (58.4 percent); bike trails (46.4 percent); skateparks (41.1 percent); dog parks (38.8 percent); community gardens (33.7 percent); disc golf courses (32.9 percent); fitness trails and outdoor fitness equipment (32.6 percent); splash play areas (30.7 percent); golf courses (19.9 percent); ice rinks (17.6 percent); waterparks (16.9 percent); and bike/BMX parks (11.4 percent).
Respondents from colleges and universities are the most likely to include: locker rooms (85.4 percent); indoor tracks (57.9 percent); and synthetic turf sports fields (42.7 percent).
School respondents are more likely than other types of facilities to include: bleachers and seating (78.9 percent); outdoor running tracks (78.7 percent); concessions (75.8 percent); and natural turf sports fields (74.2 percent).
Health club respondents are more likely than other facility types to report that they included fitness centers (92.3 percent), and Wi-Fi services (75.4 percent).
Respondents from Ys are more likely than others to indicate that their facilities included: indoor sports courts (85.2 percent); exercise studios (81.5 percent); classrooms and meeting rooms (71.6 percent); indoor aquatic facilities (69.1 percent); and childcare facilities (66.7 percent).
Respondents from camps are more likely than others to include: walking and hiking trails (79.5 percent); open spaces such as gardens and natural areas (78.3 percent); campgrounds (60.2 percent); waterfronts and marinas (51.8 percent); outdoor aquatic facilities (50.6 percent); challenge courses or ropes courses (45.8 percent); clumbing walls (44.6 percent); nature centers (26.5 percent); skiing and winter recreation opportunities (10.8 percent); and amusements (3.6 percent).
The number of respondents who said they had plans to add features at their facilities over the next several years increased from 41.5 percent in 2017 to 43.1 percent in 2018. (See Figure 28.)
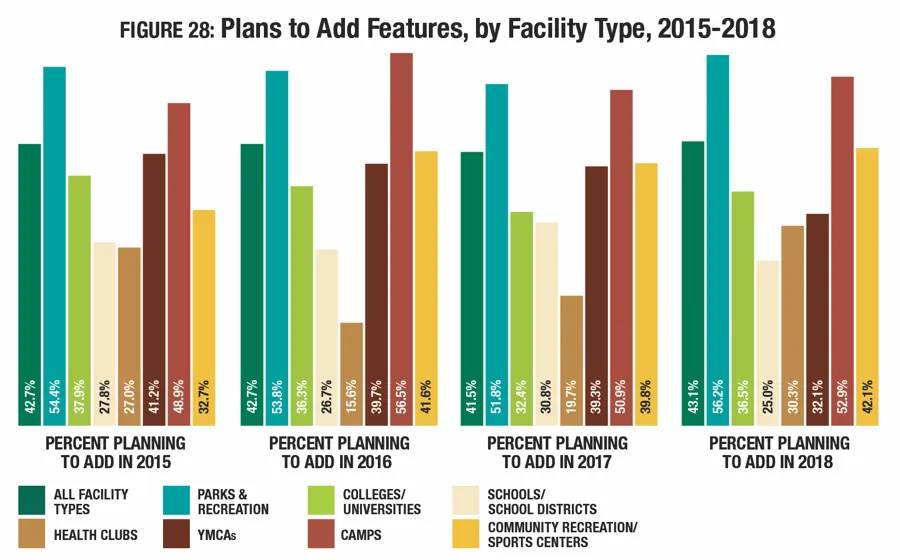
Respondents from parks and camps were the most likely to report that they had plans to add features. More than half of parks respondents (56.2 percent) and camp respondents (52.9 percent) said they had such plans. They were followed by community centers (42.1 percent) and colleges (36.5 percent). Less than one-third of Ys (32.1 percent), health clubs (30.3 percent) and schools (25 percent) said they had plans to add features at their facilities over the next few years.
With the exception of schools and Ys, the percentage of respondents planning to add features increased for all facility types between 2017 and 2018.
The top 10 planned features for all facility types include:
- Splash play areas (23.6 percent of those with plans to add features will add splash play)
- Synthetic turf sports fields (17 percent)
- Fitness trails and outdoor fitness equipment (16.4 percent)
- Fitness centers (16.3 percent)
- Walking and hiking trails (15.5 percent)
- Playgrounds (15.2 percent)
- Park shelters (13.6 percent)
- Dog parks (13.5 percent)
- Exercise studios (12.9 percent)
- Disc golf courses (12.9 percent)
Programming
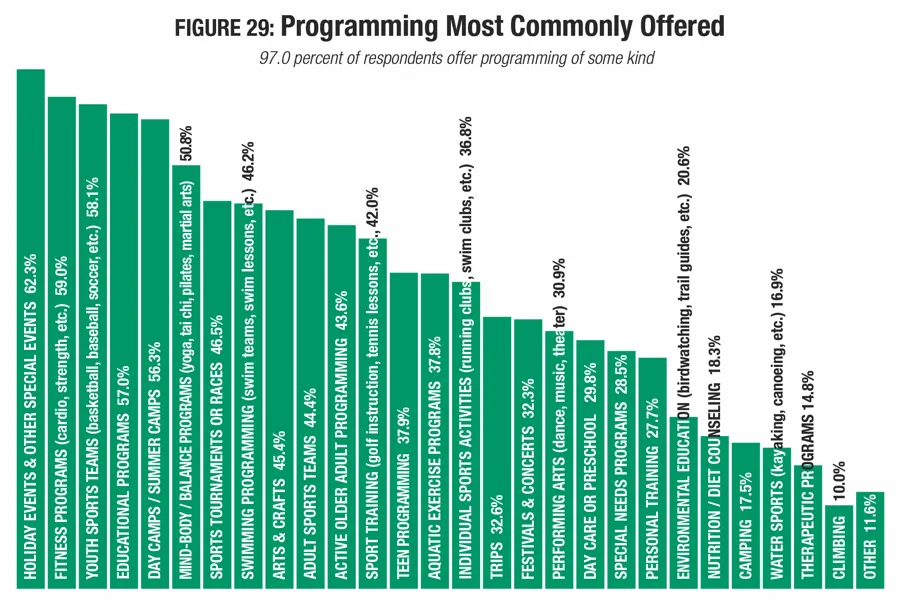
There was little change from 2017 in the top types of programs commonly offered by survey respondents' facilities. These include: holiday events and other special events (provided by 62.3 percent of respondents); fitness programs (59 percent); youth sports teams (58.1 percent); educational programs (57 percent); day camps and summer camps (56.3 percent); mind-body/balance programs such as yoga and martial arts (50.8 percent); sports tournaments and races (46.5 percent); swimming programs (46.2 percent); arts and crafts (45.4 percent), and adult sports teams (44.4 percent). (See Figure 29.) Some 97 percent of all respondents offer programming of some kind. A full 100 percent of Y respondents and health club respondents said they offer programming of some kind. They were followed by parks (99.5 percent of which provide programs), schools (97.4 percent), community sports and recreation centers (97.2 percent), colleges (96.9 percent) and camps (96.5 percent).
As usual, respondents from Ys are the most likely to offer the most different types of programs. They were more likely than those from other types of facilities to provide: holidays and other special events; youth sports teams; educational programs; day camps and summer camps; sports tournaments and races; swimming programs; arts and crafts; active older adult programming; teen programming; aquatic exercise; individual sports activities, trips; performing arts programs; daycare or preschool; special needs programs; and therapeutic programs.
Respondents from health clubs are more likely than others to provide fitness programs, mind-body/balance programs, personal training, and nutrition and diet counseling.
Park respondents are the most likely to provide adult sports teams, sports training, and festivals and concerts.
Finally, camp respondents are more likely than other facility types to provide environmental education programs, camping, water sports like kayaking and canoeing, and climbing programs.
More than three in 10 (31.8 percent) respondents said they have plans to add more program offerings to their facilities over the next three years. This is down slightly from 2017, when 32.2 percent had such plans.
The 10 most commonly planned program additions in 2018 include:
- Fitness programs (25.9 percent of those who will be adding programs plan to add fitness)
- Educational programs (25.7 percent)
- Mind-body/balance programs (23.3 percent)
- Teen programs (22.7 percent)
- Environmental education (20.7 percent)
- Day camps and summer camps (20.3 percent)
- Special needs programs (18.9 percent)
- Adult sports teams (18.5 percent)
- Holiday events and other special events (18.3 percent)
- Individual sports activities (17.5 percent)
More respondents in 2018 than in 2017 said they would be adding: educational programs (25.7 percent vs. 24.2 percent); environmental education programs (20.7 percent vs. 20.6 percent); day camps and summer camps (20.3 percent vs. 20.1 percent); special needs programs (18.9 percent vs. 14.8 percent); and adult sports teams (18.5 percent vs. 17.4 percent).
Respondents from parks and community sports and recreation centers were the most likely to report that they had plans to add programs at their facilities over the next few years. Some 39.6 percent of park respondents and 38.3 percent of community center respondents said they had such plans. More than three in 10 respondents from Ys (32.1 percent), camps (30.6 percent) and health clubs (30.3 percent) also said they were planning to add programs at their facilities over the next few years. Just 13.5 percent of school respondents and 20.6 percent of college respondents said they would be adding programs at their facilities.
Challenges & Issues of Concern
Budgetary and funding challenges are almost always the No. 1 concern for most respondents to the survey, but there are other issues that can create unique challenges for facility managers. Equipment and facility maintenance has been the top concern among respondents for a number of years, and continues to hold that place in 2018. Some 57.9 percent said equipment and facility maintenance is a top concern now, up from 55.1 percent in 2017. (See Figure 30.)
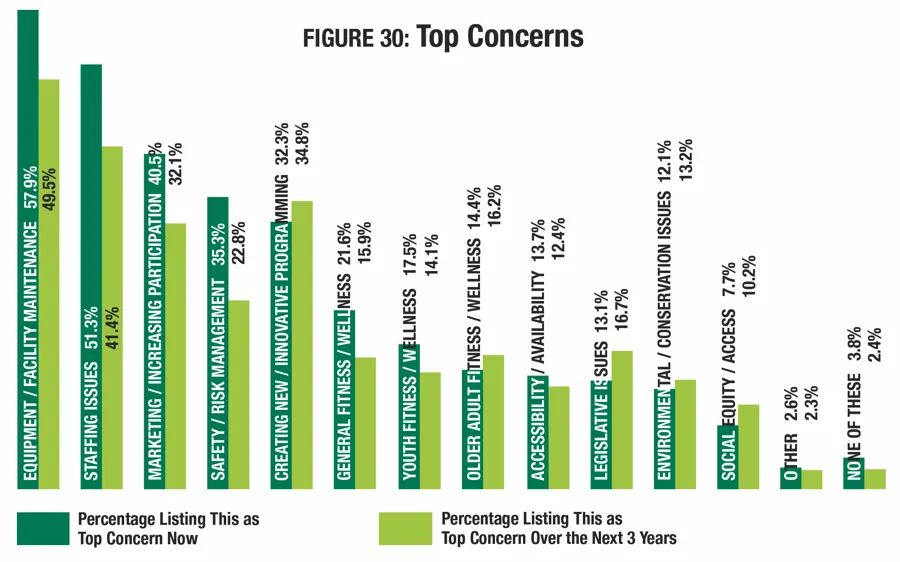
Staffing is the second most common concern, with 51.3 percent naming this as one of their chief issues (up from 48.3 percent in 2017). It is followed by marketing and increasing participation (40.5 percent), safety and risk management (35.3 percent), and creating new and innovative programming (32.3 percent).
There was an increase in the number of respondents who listed the following as top concerns: staffing (up 3 points from 48.3 percent); equipment and facility maintenance (up 2.8 points from 55.1 percent); and safety and risk management (up 2.8 points from 32.5 percent).
For the most part, the top current concerns drop off over the next three years, with fewer participants naming them as their top issue moving forward. Exceptions to this rule in 2018 include: creating new and innovative programming, which increases from 32.3 percent to 34.8 percent; older adult fitness and wellness (from 14.4 percent to 16.2 percent); legislative issues (from 13.1 percent to 16.7 percent); environmental and conservation issues (from 12.1 percent to 13.2 percent); and social equity and access (from 7.7 percent to 10.2 percent).
