


Our 12th Annual Salary Survey

The U.S. unemployment rate has continued to drop over the past year, reaching 3.6 percent in April 2019. Meanwhile, median household income reached an all-time high of $59,039 in 2016, according to a report from the U.S. Census Bureau. The overall employment outlook continues to look good, and respondents to our Salary Survey continue to be overwhelmingly positive about their careers and report salary increases, overall.
This year, more than 1,400 professionals working in the recreation, sports and fitness industry responded to the annual Industry Report survey, and the findings are once again positive in terms of salary. Average salaries among survey respondents rose 2.9 percent from 2018 to 2019, and job satisfaction continues to be positive among respondents.
Welcome to the 12th annual Recreation Management Salary Survey. Over the following pages, we'll give you a detailed picture of what respondents to the Industry Report survey had to say about their current salaries and experience, their careers and more.
About the Respondents
From park district directors to aquatic center managers to fitness club owners, there's a big range of career paths in recreation, sports and fitness facility management. A diverse cast of characters meet a wide range of community needs in many job roles that support the industry. All that said, we can paint a picture of the "average" respondent to the Industry Report survey: a nearly-50-year-old white male with a bachelor's degree, working as a director of a parks and recreation organization in the suburbs of the Midwest, earning $71,450 a year.
Some 28.8 percent of respondents are from the Midwest, the largest region represented in the survey. They were followed by the West (22.8 percent), the South Atlantic region (18.8 percent), the Northeast (16.5 percent) and the South Central states (13 percent). Another 0.1 percent of respondents reported from outside the United States.
Some 43.2 percent of respondents said they are located in suburban communities. Another 33.2 percent are located in rural areas, and 23.6 percent said they were located in urban communities.
A majority—73.6 percent—of respondents work for public organizations. Another 17.8 percent said they were with private nonprofit organizations, and 8.2 percent work with private, for-profit facilities. Some 0.4 percent of respondents said they work for "other" types of organizations.
When it comes to the type of facility respondents work for, almost half—47.9 percent—said they are with park and recreation districts and departments. Other more common facility types represented by survey respondents include: colleges and universities (10.6 percent); schools and school districts (9.8 percent); community or private recreation and sports centers (7.8 percent); campgrounds, RV parks, and private or youth camps (5.2 percent); YMCAs, YWCAs, JCCs and Boys & Girls Clubs (5.2 percent); and sports, health or fitness clubs and medical fitness facilities (3.4 percent). Other facility types that are home to smaller numbers of respondents include: golf and country clubs (1.9 percent); resorts and resort hotels (1.3 percent); military installations (1.1 percent); waterparks, theme parks and amusement parks (1.1 percent); ice rinks (0.8 percent); homeowners associations (0.6 percent); corporate recreation or sports centers (0.4 percent); racquet or tennis clubs (0.4 percent); and stadiums, arenas and tracks (0.1 percent). Another 2.4 percent said they work for other types of facilities.
The largest age group represented by survey respondents falls between 50 and 59 years. Nearly one-third (32.2 percent) of respondents said they are between 50 and 59 years old. They were followed by respondents between the ages of 40 and 49 (24.3 percent), 30 and 39 (16.8 percent), and 60 and 65 (15.8 percent). Just 5.6 percent of respondents said they are 65 or older, and 5.1 percent are 30 or younger.
Some 63.1 percent of respondents are male, and 36.9 percent are female, representing virtually no change from 2018. The survey audience is also predominantly white, with 88.4 percent of respondents. Another 4.8 percent are black/non-Hispanic, while 4.8 percent are
Hispanic, 1.6 percent are Native American or Alaskan Natives, 1.4 percent are Asian/Pacific Islanders, and the rest are of "other" or "unknown" ethnicity.
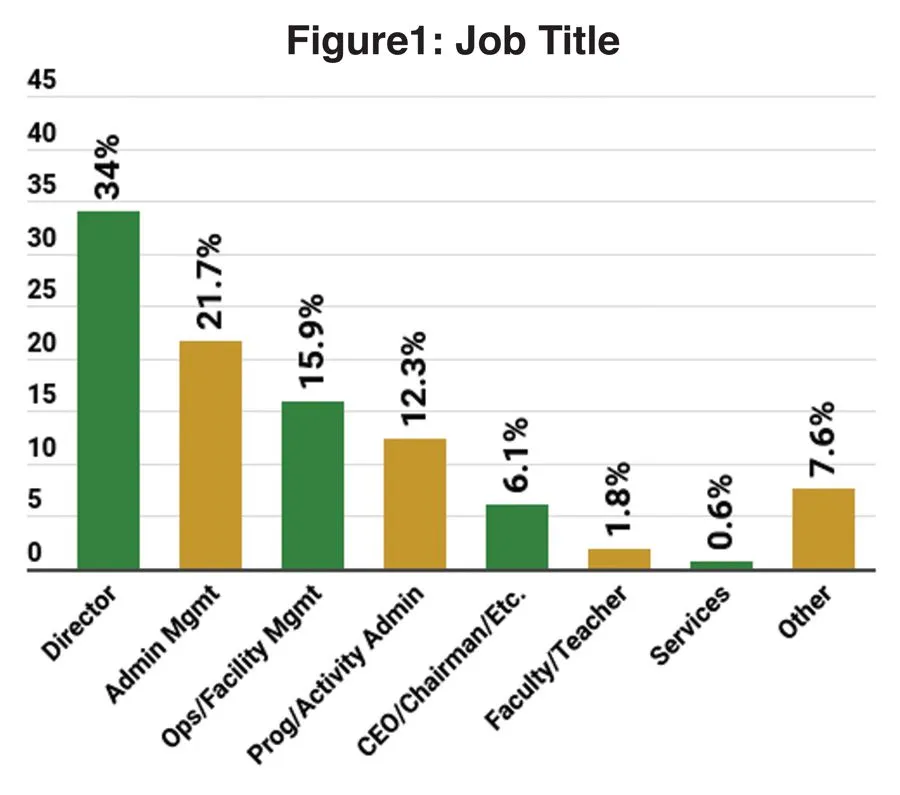
When it comes to the job titles held by survey respondents, a majority hold leadership positions, as is the case with the readership of Recreation Management. More than one-third (34 percent) hold the title of "director." Another 21.7 percent are in administration management, which includes job titles such as administrator, manager or superintendent. Some 15.9 percent of respondents are in operations and facility management, including such titles as operations managers, facility managers, building managers and supervisors. More than one in 10 (12.3 percent) are in program and activity administration, including activity or program directors, managers, coordinators, specialists, coaches and instructors. Another 6.1 percent of respondents are the chairman, CEO, vice president or owner of their organizations. Some 1.8 percent are faculty or teachers, and 0.6 percent are in services, which includes planners, designers, architects and consultants. Finally, 7.6 percent said they were in "other," unspecified job roles. (See Figure 1.)
Experience Counts
Respondents to the Industry Report survey tend to be highly likely to have earned a college degree, compared with the average U.S. citizen. According to the U.S. Census Bureau, in 2017, 27 percent of adults had earned at least a bachelor's degree. For respondents to the Industry Report survey, 79.5 percent have earned a bachelor's degree or higher. Some 46.5 percent said they have a bachelor's degree, while 30.7 percent have earned a master's. Another 2.3 percent have earned an advanced degree. Another 10.9 percent of respondents said they have attended college without earning a degree, and 6.2 percent have earned a two-year, or associate's degree. Another 3.4 percent have a high school diploma.
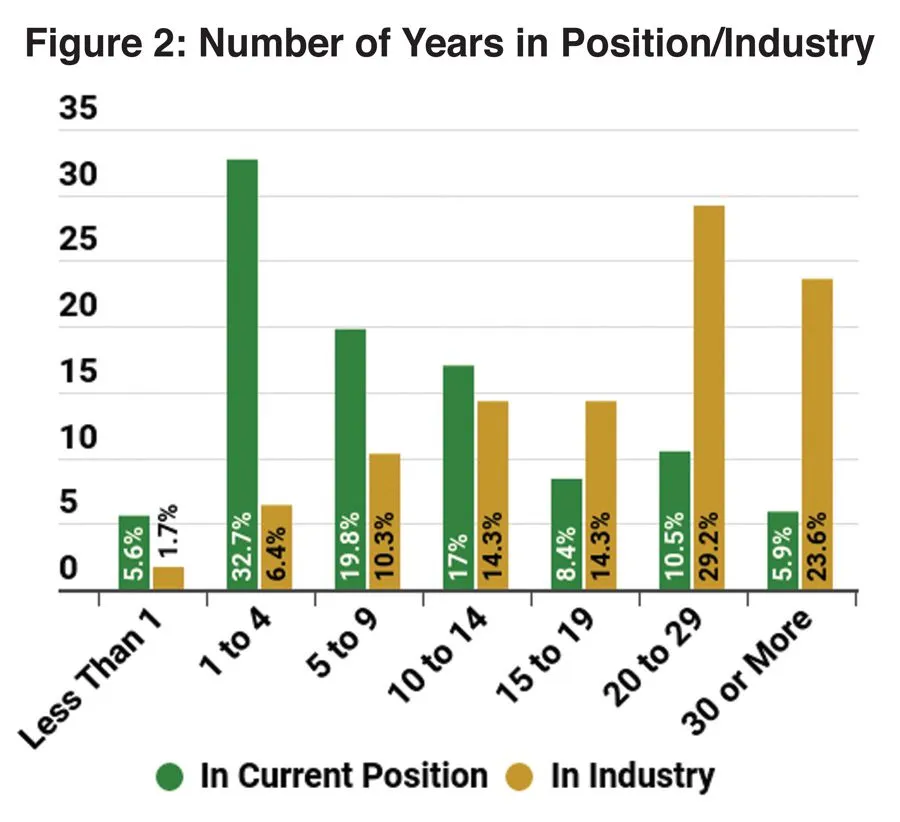
On average, respondents have been working in their current position for 10.7 years, slightly less than last year's average of 11.2 years. Some 41.8 percent of respondents said they have been in their current position for at least 10 years, with 16.4 percent indicating they've been in their current jobs for at least 20 years. Some 16.4 percent said they've been in their current position for five to nine years, while 38.3 percent have been in their current job for less than five years.
On average, respondents have been working in the recreation, sports and fitness industry for 21.2 years. More than half (52.8 percent) said they have been working in the industry for at least 20 years, and 23.6 percent have been in the industry for 30 years or more. Those with less than 10 years of industry experience make up 18.4 percent of the survey population. (See Figure 2.)
Money Matters
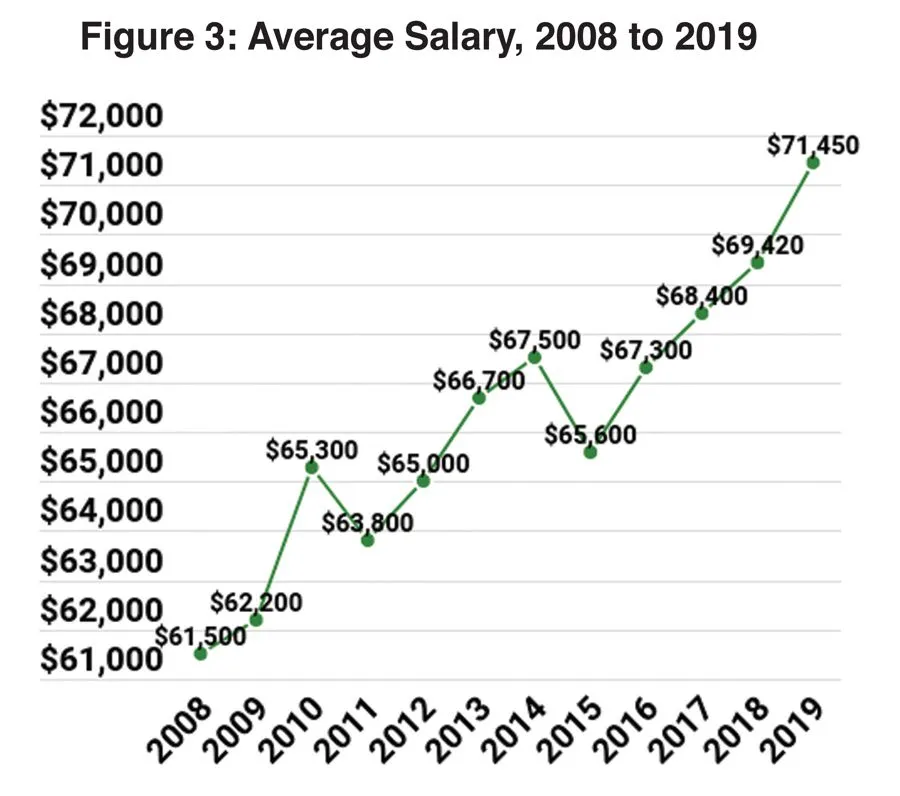
Last year's Salary Survey showed a 1.5 percent increase in the average salary over 2017. In 2019, the average salary is up 2.9 percent from 2018, to $71,450. This represents a 9.4 percent increase over the past 10 years, from $65,300 in 2010. (See Figure 3.)
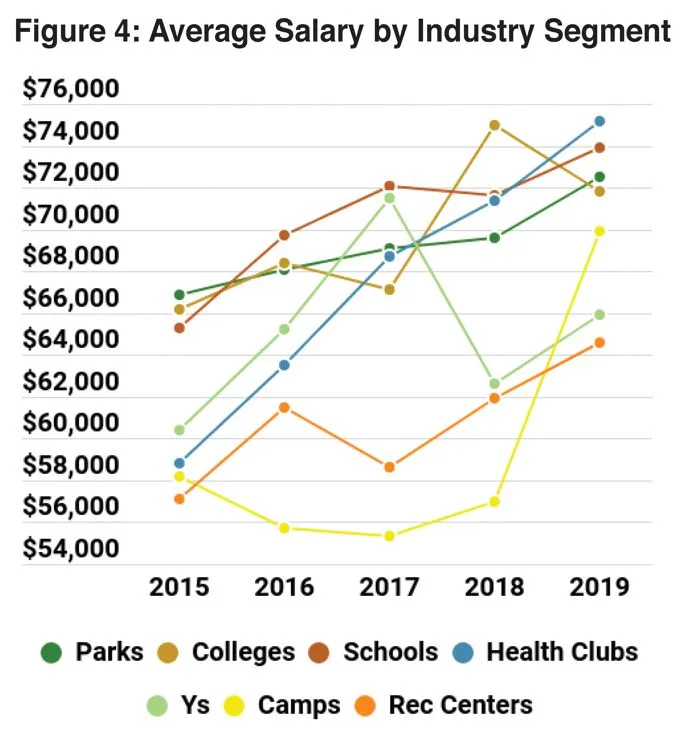
While overall, respondents reported a 2.9 percent increase in average salary from 2018 to 2019, some industry segments saw higher increases, and others reported dropping salaries. Respondents from camps reported a sharp increase of 22.7 percent, from an average of $56,970 in 2018 to $69,930 in 2019. Increases were also seen among respondents from health clubs (up 5.3 percent, from $71,370 to $75,160); Ys (up 5.2 percent, from $62,630 to $65,900); parks (up 4.2 percent, from $69,610 to $72,500); rec centers (up 4.2 percent, from $61,950 to $64,560); and schools (up 3.2 percent, from $71,600 to $73,910). Only respondents from colleges reported a decrease in their average salary from 2018 to 2019, with a 4.2 percent drop from $74,980 to $71,800. (See Figure 4.)
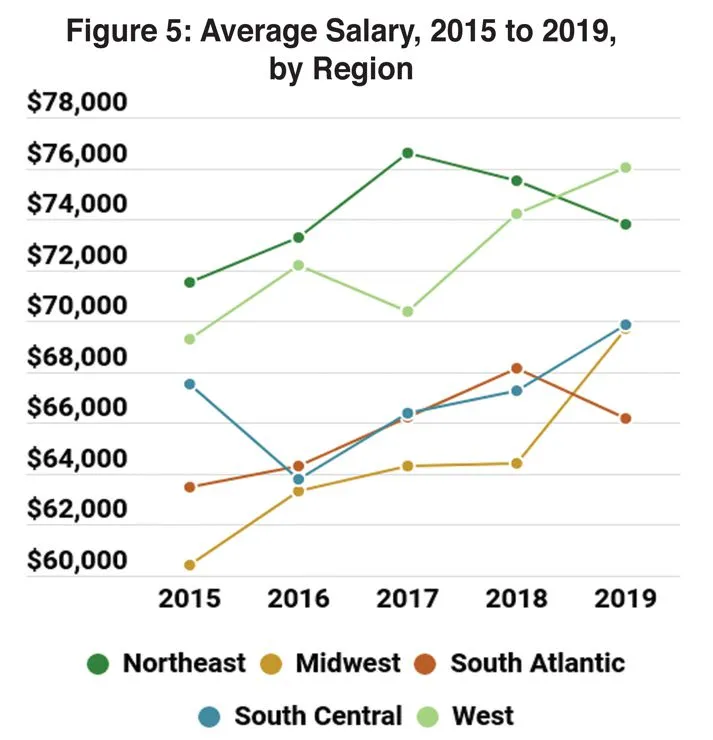
Respondents in the West overtook the Northeastern region as the highest earners in 2019, with an average salary of $76,010. Respondents in the Northeast followed, with an average of $73,780.
The greatest increase to average salary from 2018 to 2019 was reported by respondents in the Midwest, who saw their average salary rise 8.2 percent, from $64,410 in 2018 to $69,690 in 2019. Increases were also reported in the South Central region (up 3.9 percent, from $67,250 to $69,860) and the West (up 2.4 percent, from $74,200 to $76,010). Respondents in the South Atlantic states and the Northeastern region saw their average salaries fall slightly from 2018 to 2019, with a 2.9 percent drop in the South Atlantic (from $68,130 to $66,180), and a 2.3 percent drop in the Northeast (from $75,520 to $73,780). (See Figure 5.)
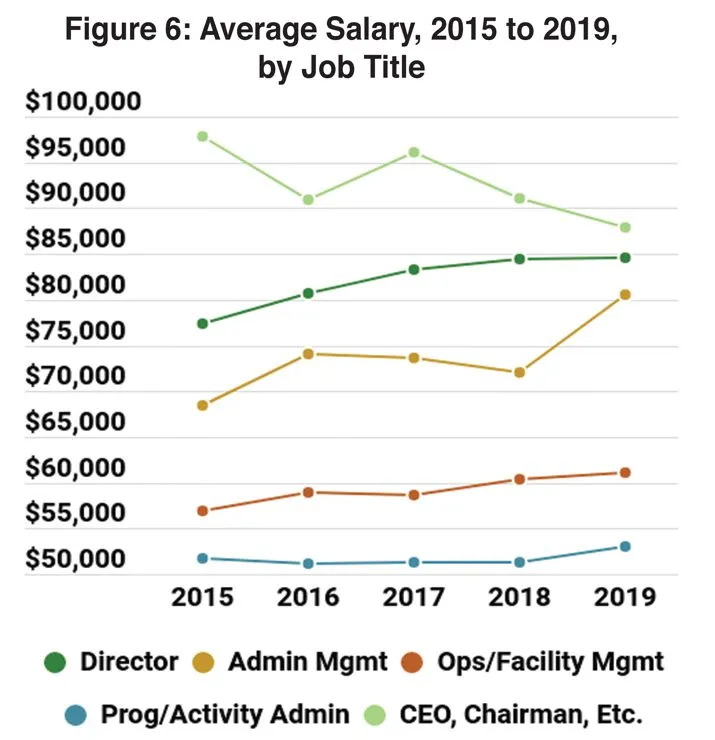
As usual, respondents who are the chairman, CEO, president, vice president or owner of their organization reported the highest average salary, when considered by job title, though they did see a significant drop in 2019, and respondents who are the director of their organizations are catching up, in terms of earnings. Respondents who were the chairman, CEO, president, vice president or owner of their organization reported a 3.5 percent decrease to average salaries from 2018 to 2019, from $91,050 to $87,850. All other job titles reported increases. The greatest increase was seen among those in administration management, who saw an 11.8 percent increase, from an average salary of $72,070 in 2018 to $80,590 in 2019. They were followed by program and activity administrators (up 3.2 percent from $51,350 to $52,970); operations and facility managers (up 1.4 percent, from $60,320 to $61,150); and directors (up 0.2 percent, from $84,420 to $84,550). (See Figure 6.)
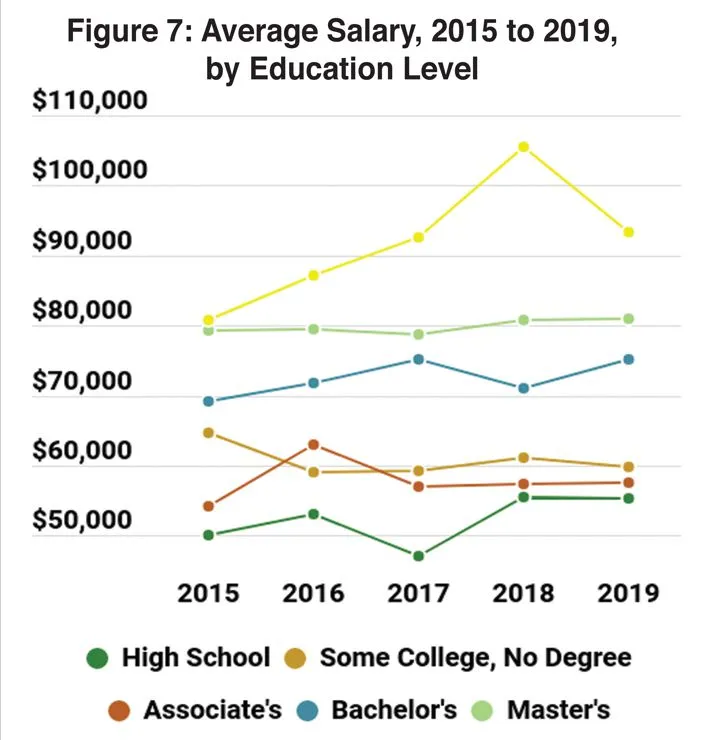
Respondents with higher levels of education typically tend to report higher average salaries, and 2019 is no exception, with those who have earned master's and advanced degrees earning more than those with bachelor's, who likewise earn more than their counterparts with two-year degrees or no college degree at all. The greatest increase to average salary was reported by respondents with a bachelor's degree, who saw their average salary rise 5.8 percent, from $71,090 in 2018 to $75,240 in 2019. They were followed by those with two-year degrees, who reported a 0.5 percent increase, from $57,340 to $57,640; and those with master's degrees, up 0.2 percent, from $80,780 to $80,930. The greatest decrease was seen among those with advanced degrees. They reported an 11.5 percent decrease from 2018 to 2019, from $105,460 to $93,280. That said, their 2019 average was up 0.8 percent from 2017's average of $92,500. Decreases were also seen among those with some college, but no degree (down 2.2 percent, from $61,090 to $59,740) and high school graduates (down 0.4 percent, from $55,450 to $55,210). (See Figure 7.)
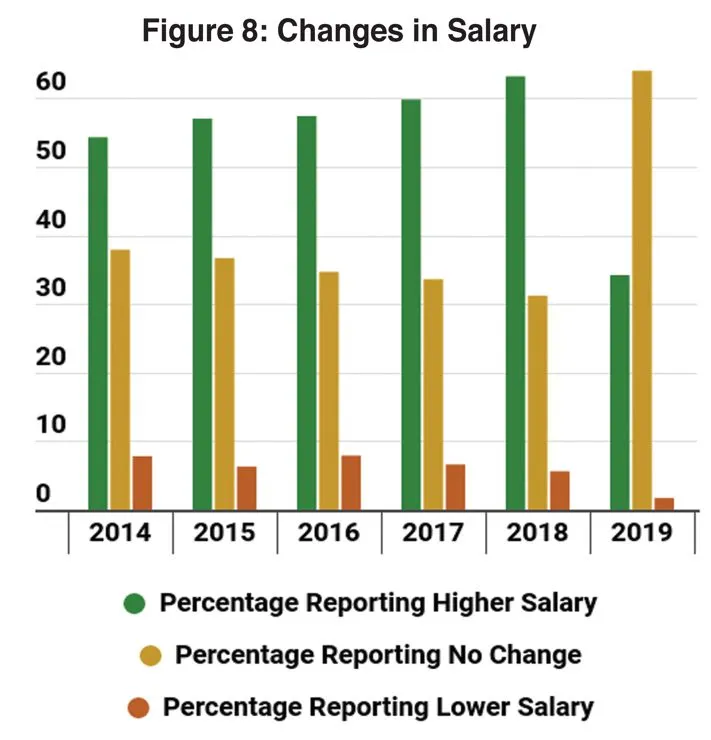
Over the past few years, the number of respondents who have reported increases to their salaries has been increasing gradually. Since 2014, when 54.3 percent of respondents said their salary was higher than in 2013, the number reporting higher salaries has risen steadily, reaching 59.8 percent who reported an increase in 2017 and 63.2 percent reporting an increase in 2018, with an average increase of 3.8 percent for all respondents. (See Figure 8.) At the same time, the percentage of respondents reporting a lower salary has fallen relatively steadily, reaching a low of 5.6 percent who saw a decrease in 2018.
Looking forward, as is generally the case, fewer respondents report that they expect to see their salaries increase in 2019. That said, this number is always overturned in the following year. So, for example, in 2018, only 33.1 percent of respondents said they expected their 2018 salary to be higher than their salary in 2017. But this year, 63.2 percent reported their salaries actually were higher. So, while 34.2 percent of respondents in 2019 expect that their salaries this year will be higher than in 2018, we can expect that number to be significantly higher when data is collected in early 2020.
Respondents from parks were the most likely to report that their salaries had increased from 2017 to 2018, with 72.7 percent indicating they'd seen an increase in that time period. They were followed by Ys, where 61.6 percent of respondents reported an increase, and colleges, where 56.7 percent reported an increase. Respondents from health clubs were the least likely to report that their salaries had increased from 2017 to 2018, though nearly half (47.9 percent) reported that they had seen an increase. (See Figure 9.)
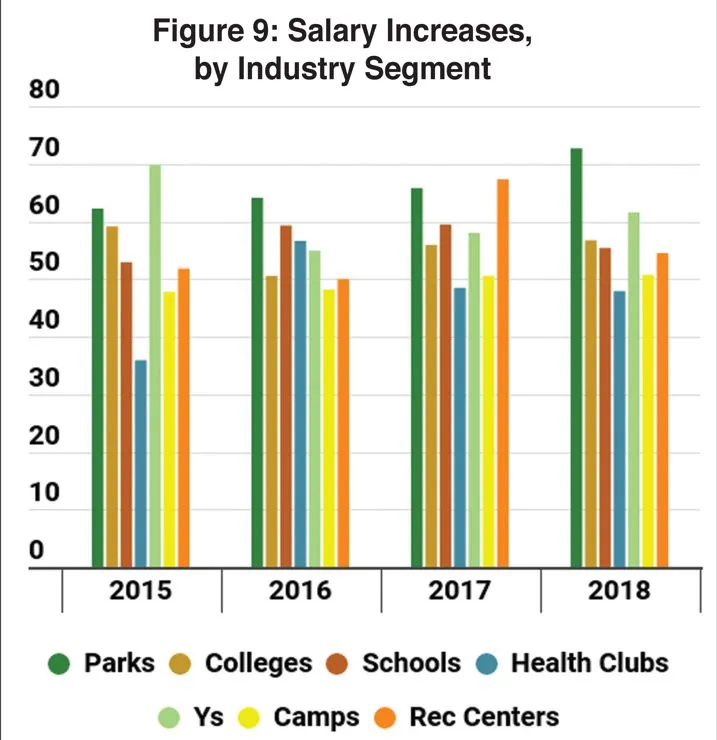
While the average salary increase in 2018 for all respondents was 3.4 percent, some industry segments fared better, on average, than others. The highest salary increases were seen among those from Ys and camps, where respondents reported a 3.5 percent increase from 2017 to 2018. They were followed by parks (up 3.4 percent), colleges (up 3.3 percent), and health clubs and rec centers (up 3 percent). The lowest average salary increase from 2017 to 2018 was reported by respondents from schools, whose salaries rose by 2.6 percent in that time period.
On the Job
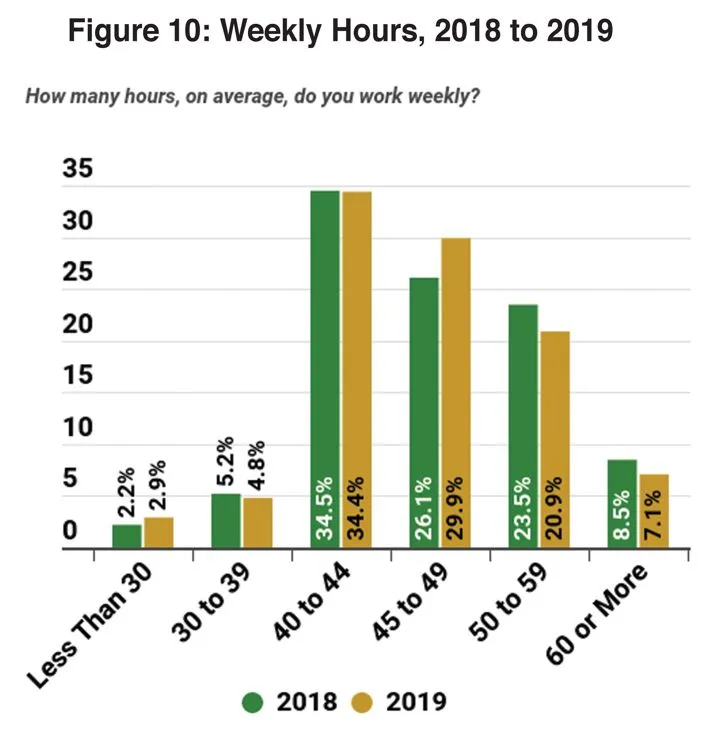
A majority of respondents (64.3 percent) said that they work a pretty typical number of hours in a week, between 40 and 49. This is up from 2018, when 60.6 percent worked 40 to 49 hours in a week. Meanwhile, the number of respondents who are working 50 or more hours in the week has fallen, from 32 percent in 2018 to 28 percent in 2019. (See Figure 10.)
On average, respondents said they work 47.2 hours per week. Respondents from schools reported that they worked the most hours per week, averaging 52.4 hours. They were followed by respondents from camps, with 51.3 hours per week. Other respondents averaged less than 50 hours per week, with Y respondents working the most hours at 47.9, followed by college respondents (46.8 hours per week), parks respondents (45.5 hours per week), rec center respondents (45.4 hours per week), and health club respondents (43.8 hours per week).
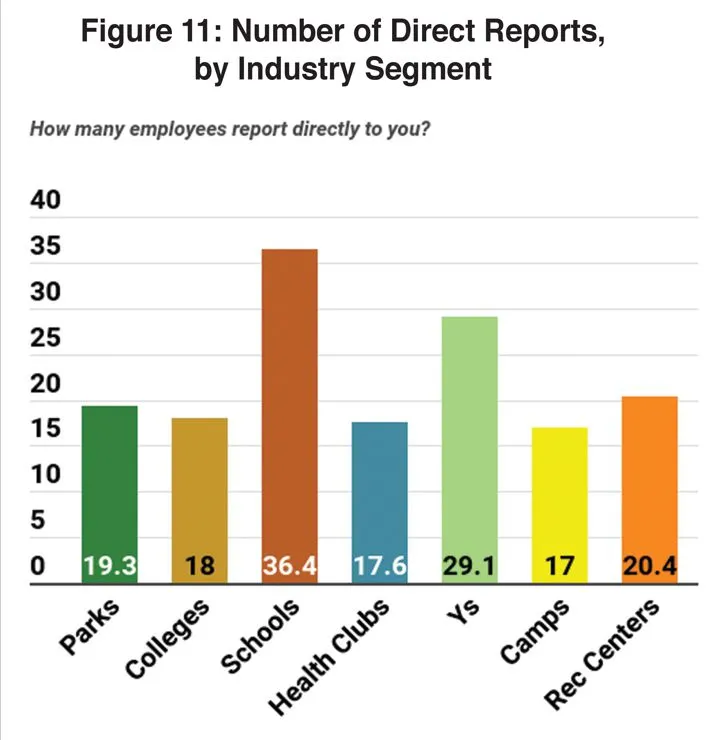
On average, respondents said they have 21.9 employees reporting directly to them. Some 5 percent of respondents said they have no employees who report to them directly. Another 25.8 percent have one to five direct reports. Another 23 percent have between six and 10 direct reports. Some 17.9 percent have 11 to 20 direct reports, while 18.9 percent have between 21 and 50. Fewer respondents said they have 51 to 100 employees (6.6 percent) or more than 100 employees (2.9 percent) reporting directly to them.
The number of direct-report employees is highest for those from schools, who have an average of 36.4 direct reports. They were followed by Ys, with 29.1 direct reports, rec centers (20.4) and parks (19.3). (See Figure 11.)
Finally, most respondents continue to be satisfied with their work. As has been the case in every year since we've been asking respondents about their salaries and careers, the vast majority of respondents report that they are either satisfied (52 percent) or very satisfied (39.8 percent) with their work. (See Figure 12.)
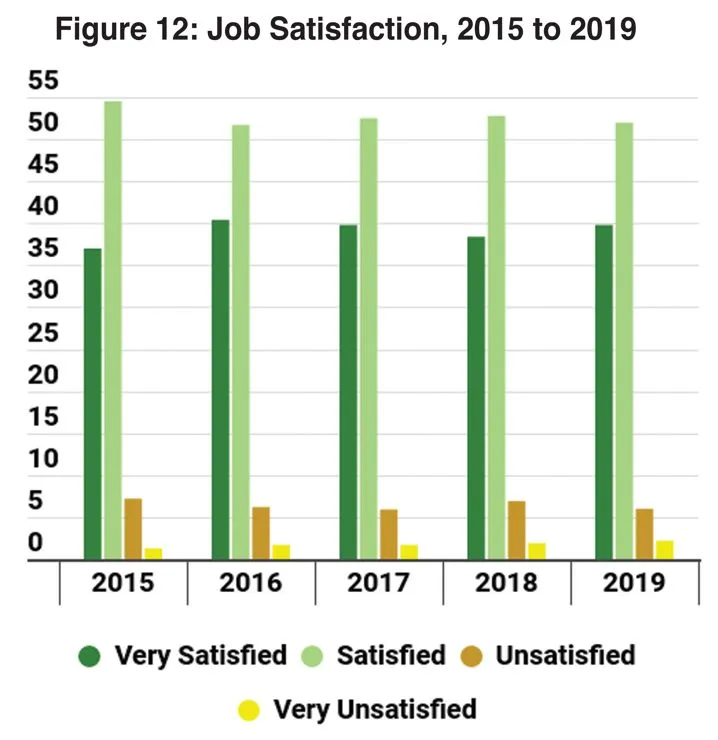
Respondents from camps and Ys were the most likely to report that they are currently satisfied with their jobs. Some 94.5 percent of camp respondents and 94.4 percent of Y respondents indicated that they are satisfied with their current jobs. They were followed by those from schools (92.4 percent of whom were satisfied); parks (92 percent); rec centers (90.8 percent); colleges (89.9 percent); and health clubs (89.1 percent).

Job satisfaction tended to be higher for those who were earning higher salaries. Some 96.9 percent of those earning $90,000 to $99,999, and 96.6 percent of those earning $100,000 or more said they were satisfied in their current jobs. In the middle salary ranges, more than nine out of 10 were satisfied, with 92.1 percent of those earning $80,000 to $89,999, 90.2 percent of those earning $70,000 to $79,999, and 93 percent of those earning $60,000 to $69,999 indicating they were satisfied. Among those earning $50,000 to $59,999, 89.8 percent were satisfied in their current jobs, and for those earning less than $50,000, 88.2 percent were satisfied.
Survey Methodology
This report is based on a survey conducted for Recreation Management by Signet Research Inc., an independent research company. An e-mail was broadcast and respondents were invited to participate. From the launch of the survey on Jan. 23, 2019, to the closing of the survey on Feb. 19, 2019, 1,413 returns were received. The findings of this survey may be accepted as accurate, at a 95 percent confidence level, within a sampling tolerance of approximately +/- 2.6 percent.
