


Our 14th Annual Salary Survey
Survey Methodology
| | | | | | | | | | | | | | | | | | | | | | | | | | | | | | | | | | | | | | | | | | | | | | | | | | | | | | | | | | | | | | | | | | | | | | | | | | | | | | | | | | | | | | | | | | | | | | | | | | | | | | | | | | | | | | | | | | | | | | | | | | | | | | | | | | | | | |
This report is based on a survey conducted for Recreation Management by Signet Research Inc., an independent research company. An email was broadcast and respondents were invited to participate. From the launch of the survey on Jan. 20, 2021, to the closing of the survey on Feb. 5, 2021, 1,387 returns were received. The findings of this survey may be accepted as accurate, at a 95 percent confidence level, within a sampling tolerance of approximately +/- 2.6 percent.
A year ago, when we reported the 2020 Salary Survey results, it was hard to know how the trends would play out. With many facilities temporarily closed or just tentatively opening, a lot of respondents to our Update Survey were relatively pessimistic, expecting a big hit to revenues and likely to their salaries as well. And while the State of the Industry Report did indicate that revenues in 2020 took a hit—and that most feel a full recovery won't be felt until 2022—salaries remained relatively unchanged.
This is a break from the trend of recent years, which has shown a majority of respondents seeing salary increases year-over-year, but it's not the dire news many were expecting. For the most part, and for most of the professionals in recreation, sports and fitness responding to the survey, salaries held steady, hours held steady and job satisfaction remained high.
Welcome to Recreation Management's 14th Annual Salary Survey. In these pages, we'll focus on what respondents to the Industry Report survey had to say about their salaries, experience, careers and expectations.
About the Respondents
Professionals working for facilities that provide recreation, sports, fitness and aquatic opportunities to their communities can follow a range of career paths, from park district directors and campground operators to athletic directors, health club managers, aquatic facility managers and much more. It takes a wide range of people with myriad viewpoints to cover the broad spectrum of programs, services and places where people go to get fit and have fun.
Nearly three in 10 respondents (29.3%) were located in the Midwest. This region was followed by the West, with 21% of the respondents, and the South Atlantic, at 19.9%. Smaller numbers of respondents were located in the Northeast (17.8%) and South Central (11.9%) regions.
Suburban communities dominated the response to the survey. Some 44.2% of respondents said they were from the suburbs. Another 32% were from rural communities, and 23.8% were from urban areas.
Two-thirds (66.6%) of respondents said they work with public or governmental organizations, such as parks departments, school districts and public universities. Another 23.4% work with private nonprofits, such as Ys, Boys & Girls Clubs and other nonprofit facilities. Some 9% of respondents work with private for-profit facilities, such as health clubs and privately owned sports centers.
When it comes to the type of facility represented, the largest number of respondents—42.7%—work with parks departments and districts. They were followed by respondents from colleges and universities (13.6%); schools and school districts (8.3%); community or private recreation centers (8.3%); YMCAs, YWCAs, JCCs and Boys & Girls Clubs (8.2%); and campgrounds, RV parks and private or youth camps (5.3%). Smaller numbers of respondents reported from other types of facilities, including: golf facilities and country clubs (3.2%); sports, health, fitness and medical fitness facilities (2.6%); resorts and resort hotels (1.4%); homeowners associations (0.9%); waterparks, theme parks and amusement parks (0.7%); ice rinks (0.4%); racquet and tennis clubs (0.4%); stadiums, arenas and tracks (0.3%); military installations (0.2%); corporate recreation and sports centers (0.2%); and churches (0.2%). Another 3% of respondents said they work for "other" types of facilities.
Given that they tend to serve in higher-level management or director-level positions, it comes as little surprise that respondents tend to be older professionals. Nearly six out of 10 (57.6%) said they were at least 50 years old. Some 36.4% were between 50 and 59 years old, while 21.2% were 60 or older. Another 26.7% said they were between 40 and 49 years old, and 13.1% were between 30 and 39 years old. Just 2.6% were younger than 30.
Respondents to the survey were not tremendously diverse, with 62.7% being male and 86.2% being white. This represents very little change over the past few years. Just 37.3% of respondents were female. And when it comes to race and ethnicity, the remaining respondents were most likely to be either black (5.9%) or Hispanic (5.5%). Another 1.6% were Asian/Pacific Islanders, while 1% were Native American or Alaskan Natives. Finally, 2.3% represented "other" or "unknown" ethnicities.
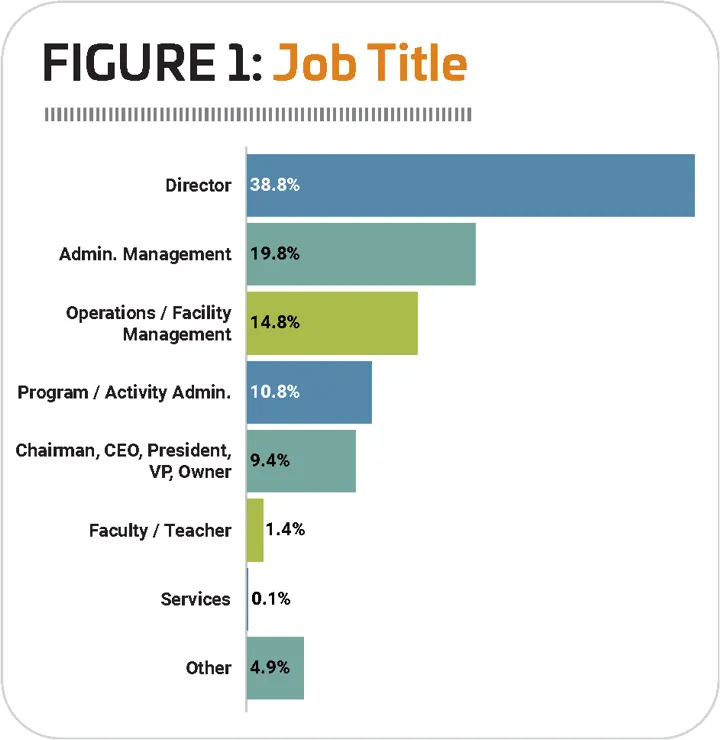
When it comes to the job titles of survey respondents, most are in leadership positions. Nearly four out of 10 (38.8%) are directors. Another 19.8% are in administration management, which includes titles such as administrator, manager or superintendent. Some 14.8% are in operations and facility management, including titles such as operations managers, facility managers, building managers and supervisors. Another 10.8% are in program and activity administration, which includes activity or program directors, managers, coordinators, specialists, coaches and instructors. Some 9.4% of respondents are the chairman, CEO, vice president or owner of their organizations. Some 1.4% are faculty or teachers, and 0.1% are in "service" positions, including planners, designers, architects and consultants. Finally, 4.9% said they were in "other," unspecified job roles. (See Figure 1.)
Experience Counts
Respondents to the Industry Report survey tend to be highly educated, when compared with the American citizenry. The latest U.S. Census Bureau numbers report that just under a third of American adults 25 and older have earned a college degree. By comparison, 81.5% of Industry Report survey respondents have earned at least a bachelor's degree. Some 45.2% said they have a bachelor's degree, while 33.2% have earned a master's degree, and 3.1% have earned an advanced degree. Another 5.1% said they have earned a two-year, or associate's, degree, while 11.2% attended college but never earned a degree. Just 2.2% of respondents have just a high school diploma.
On average, respondents have been working in their current position for 11.7 years, representing no change from the 2020 survey. Nearly one-fifth (19.7%) of respondents have been in their current position for at least 20 years, up from 18.4% in 2020. Another quarter (25.2%) have been in their current position for between 10 and 20 years. A little more than one-fifth (21.7%) have been in their current position for five to nine years, and one-third (33.4%) have been in their current position for five or fewer years.
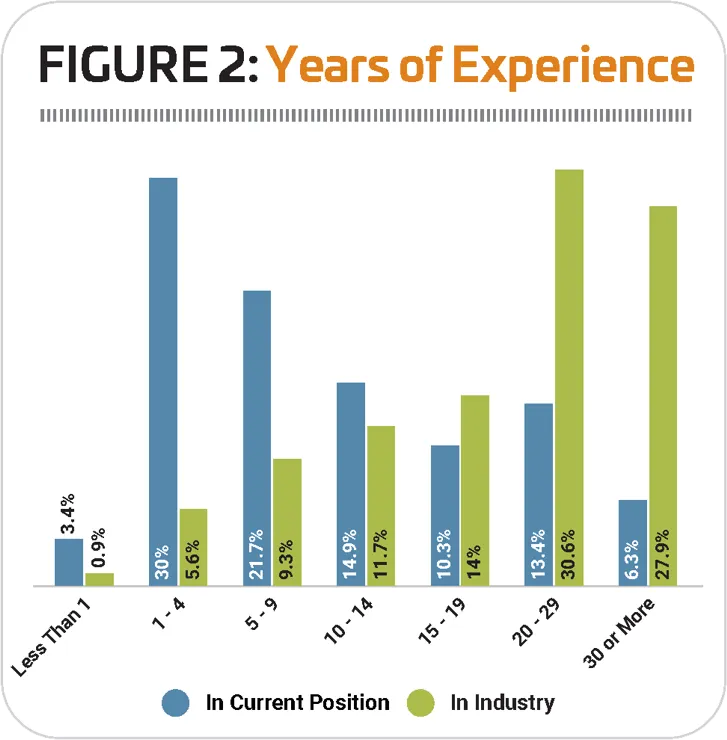
When it comes to industry experience, respondents have quite a bit, with an average of 22.5 years working in the recreation, sports and fitness industry. Nearly six out of 10 (58.5%) have been working in the industry for at least 20 years, and 27.9% have been involved in the industry for 30 years or more. More than a quarter (25.7%) have between 10 and 19 years of experience in the industry, while 9.3% have from five to nine years of experience. Just 6.5% of respondents said they have been in the industry for four years or less. (See Figure 2.)
Money Matters
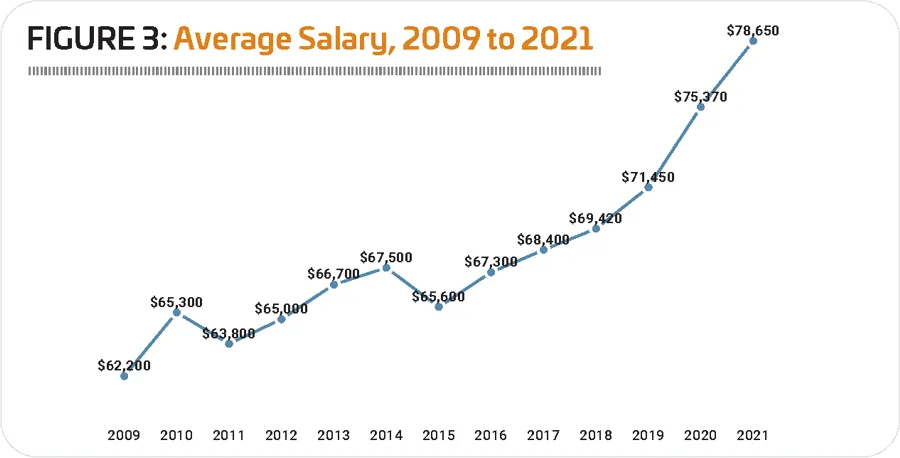
Respondents' average salary has been on the rise since 2015, increasing 2.9% in 2019 and 5.5% in 2020. This year is no exception, with respondents reporting an average salary of $78,650, a 4.4% increase over 2020's average of $75,370. Over 10 years, that represents a 23.3% increase, from an average of $63,800 in 2011. (See Figure 3.)
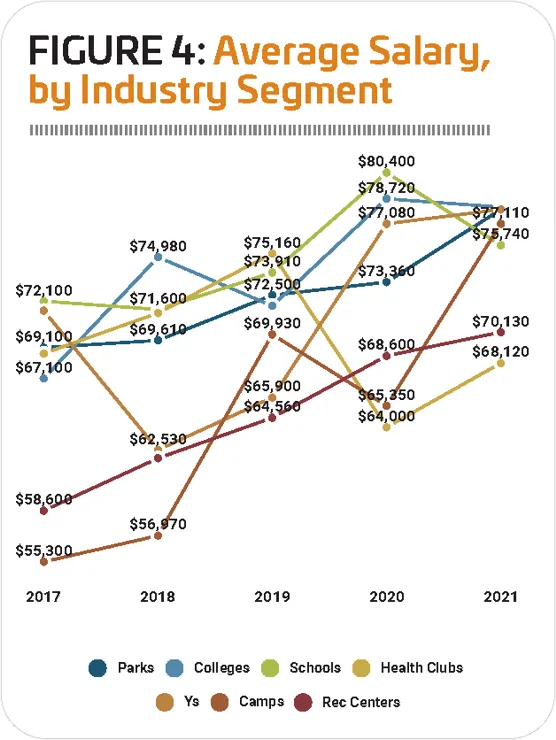
While respondents overall reported a 4.4% salary increase from 2020 to 2021, there was a great deal of variation depending on the type of facility respondents were reporting from. Respondents from schools and colleges actually reported a decrease in their average salary, with school respondents' average falling 5.8%, from $80,400 to $75,740, and college respondents' average falling 0.7%, from $78,720 to $78,150. The greatest increase in average salary was reported by respondents from camps, who saw their average salary climb a whopping 18%, from $65,350 in 2020 to $77,110 in 2021. Health club respondents and park respondents also reported substantial increases, with health club respondents' average salary rising 6.4%, from $64,000 to $68,120, and park respondents' average increasing 6.3%, from $73,360 to $77,980. More modest increases were reported by respondents from rec centers (up 2.2%, from $68,600 to $70,130) and Ys (up 1.2%, from $77,080 to $78,000). (See Figure 4.)
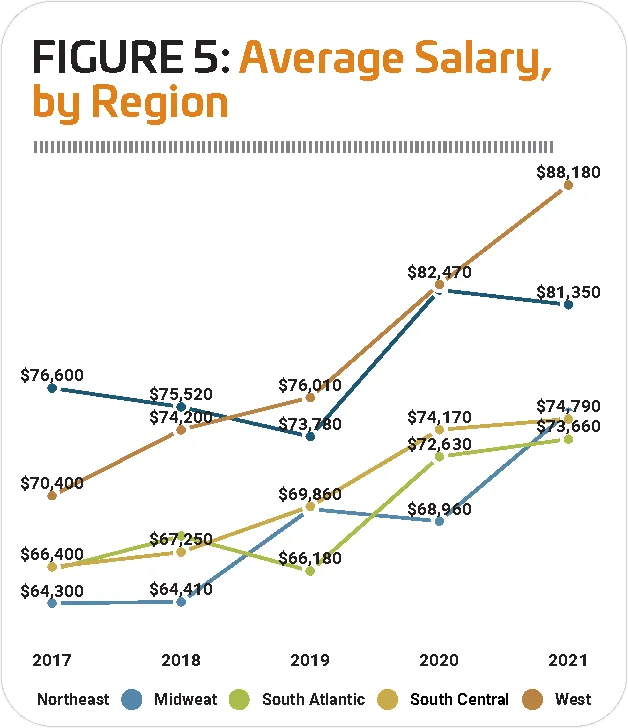
While respondents in the West and Northeast reported the highest average salaries, they diverged when it comes to year-over-year changes, with respondents in the Northeast the only region to report a decrease to average salary. Northeastern respondents saw their average salary drop 1%, from $82,170 in 2020 to $81,350 in 2021. In that same time period, Western respondents reported a 6.9% increase to average salaries, from $82,470 to $88,180. The greatest increase, however, was seen in the Midwest, where respondents saw their average salary rise by 9%, from $68,960 in 2020 to $75,160 in 2021. More modest increases were reported by respondents in the South Atlantic region (up 1.4%, from $72,630 to $73,660) and in the South Central region (up 0.8%, from $74,170 to $74,790). (See Figure 5.)
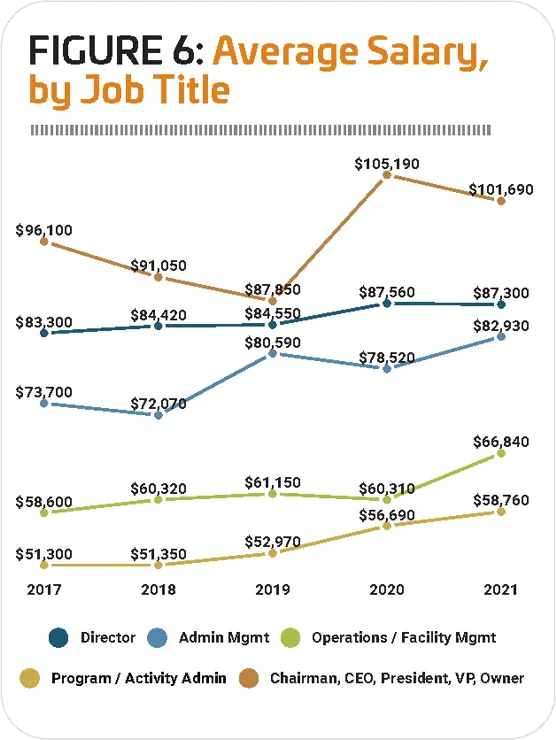
When it comes to job roles, it comes as no surprise that the highest-paid respondents were either in the CEO, president or other top leadership role, or they were in director-level positions. That said, these were the only two job title categories that saw their average salary decrease from 2020 to 2021. For those who are the CEO, president, vice president or owner of their organization, the average salary fell 3.3%, from $105,190 in 2020 to $101,690 in 2021. Respondents in director-level positions reported a minimal 0.3% decrease to their average salary, from $87,560 in 2020 to $87,300 in 2021.
The greatest increase was reported by respondents in operations and facility management. These respondents saw their average salary increase 10.8%, from $60,310 in 2020 to $66,840 in 2021. They were followed by those in administration and management, with a 5.6% increase from $78,520 in 2020 to $82,930 in 2021. Finally, respondents in program and activity administration reported a 3.7% increase to their average salaries, from $56,690 in 2020 to $58,760 in 2021. (See Figure 6.)
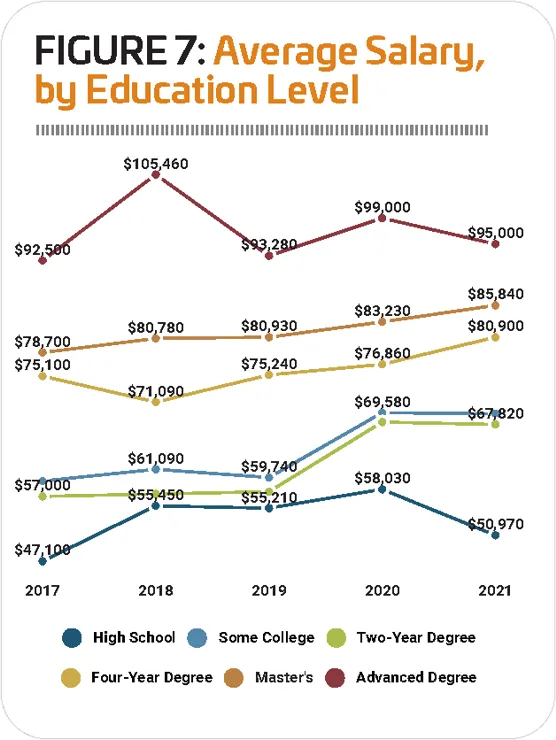
As is generally the case, respondents with higher levels of educational achievement reported higher salaries. That said, only those with bachelor's degrees and master's degrees reported a year-over-year increase to their average salaries in 2021. Respondents with a bachelor's degree saw their average salary rise 5.3%, from $76,860 in 2020 to $80,900 in 2021. Those with a master's degree reported a 3.1% increase, from $83,230 in 2020 to $85,840 in 2021.
The greatest decrease was reported by respondents with a high school diploma, who saw their average salary drop 12.2%, from $58,030 in 2020 to $50,970 in 2021. Respondents with advanced degrees reported a 4% decrease, from an average of $99,000 in 2020 to $95,000 in 2021. Negligible changes were reported by those with some college but no degree (down just 0.2%, from $69,580 in 2020 to $69,420 in 2021) and those with an associate's or two-year degree (down 0.6%, from $68,210 to $67,820). (See Figure 7.)
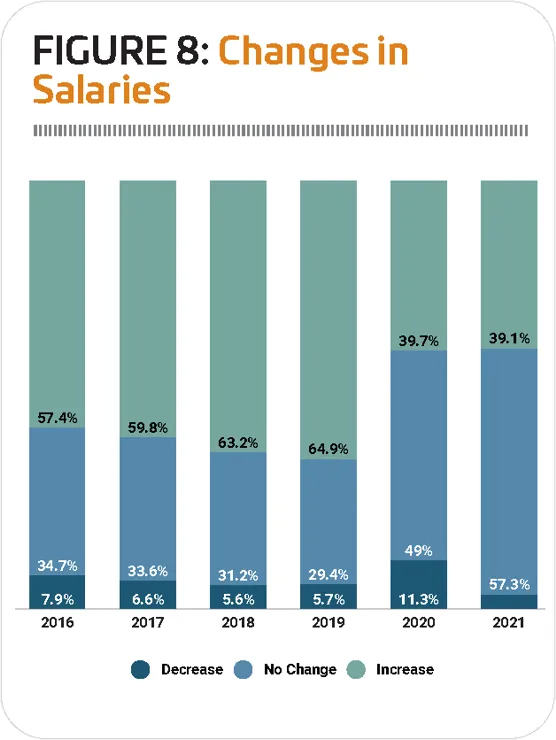
From 2016 to 2019, the number of respondents who reported that their salary was increasing year over year was on the rise. In 2016, 57.4% of respondents said their salary was higher than in 2015—a number that increased steadily until 2019, when nearly two-thirds (64.9%) reported an increase in their salary over 2018.
It comes as no surprise that 2020 represents a departure from this norm. In 2020, just 39.7% of respondents said their salary was higher than in 2019. Nearly half (49%) said their salary did not change in 2020, and 11.3% reported a decrease. (See Figure 8.)
On average, respondents who did report an increase for 2020 saw their salaries rise by 3.3%, down from 3.5% in 2019.
Looking forward, the numbers are similar for 2021, though it should be noted that respondents tend to be pessimistic about salary increases, with the number reporting that they expect an increase tending to lag behind the number who actually see an increase by around 20 percentage points. (Perhaps many of us subscribe to the idea of limiting expectations so that we may be pleasantly surprised.) Even 2020's numbers ended up being more positive than expectations. (While 35.1% expected an increase in 2020, 39.7% ended up reporting an increase.)
Some 39.1% of respondents said they expect that their salary in 2021 will be higher than in 2020, while 57.3% expect no change and 3.5% are anticipating a decrease.
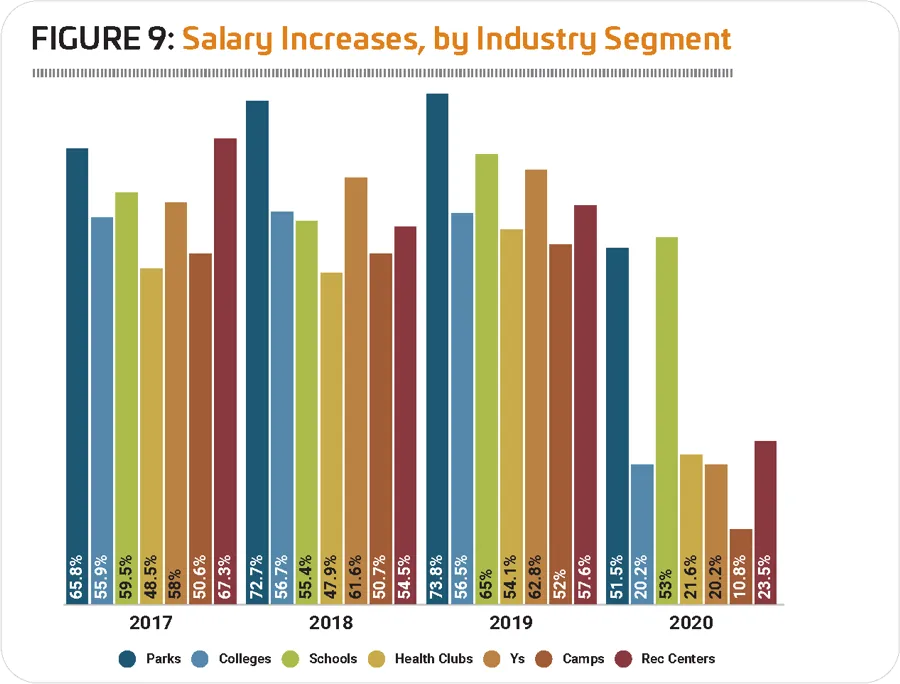
Considering responses by facility type, all were less likely to see salary increases in 2020 than in 2019, but respondents from schools and from parks were the most likely to report that their salaries had risen. More than half of school respondents (53%) and park respondents (51.5%) said their salaries in 2020 were higher than in 2019, and they reported a 2.8% and 3.2% average increase, respectively. Around a fifth of respondents from most other facility types reported higher salaries for 2020. The exception was camps, whose respondents were the least likely to report a salary increase in 2020. Just 10.8% of camp respondents said their salaries in 2020 were higher than in 2019. (See Figure 9.)
Getting the Job Done
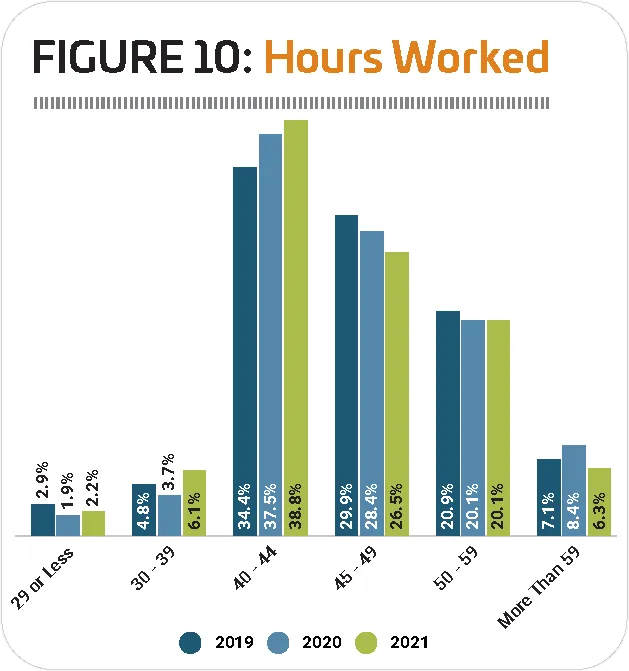
The majority of respondents said they work a typical number of hours every week, between 40 and 50. Some 38.8% said they work 40 to 44 hours a week, while 26.5% work 45 to 49 hours per week. Meanwhile, the percentage of respondents who said they are keeping their nose to the grindstone for at least 50 hours every week dropped slightly, from 28.5% in 2020 to 26.4% in 2021. Very few respondents said they are working part-time, or less than 40 hours a week. (See Figure 10.)
On average, respondents said they work 46.7 hours per week, down slightly from 47.5% in 2020. Respondents from schools reported the highest average number of hours worked, at 52.9 hours per week, down very slightly from 53.2 in 2020. They were followed by those from camps, who work an average of 49.5 hours per week (virtually unchanged from 49.7) and Ys, at 48.3 hours per week (virtually unchanged from 48.6). Respondents from parks and health clubs logged the fewest average hours, with park respondents averaging 44.7 hours (down from 45.4) and health club respondents averaging 44.8 (down from 46.2).
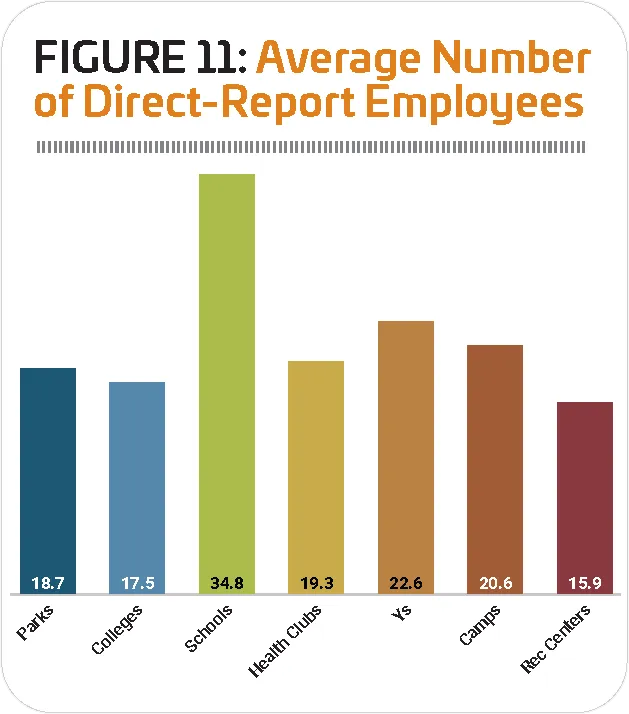
On average, respondents said they have 21 employees reporting to them, down from 21.9 in 2020. Some 4.2% of respondents said they have no direct reports. Another 26.1% have one to five employees reporting to them. Another quarter (25.7%) have between six and 10 direct reports. Another 16.8% have between 11 and 20, while 18.5% have between 21 and 50. Just 6.1% of respondents said between 51 and 100 employees report directly to them, and 2.6% have 100 or more direct reports.
As usual, the number of direct-report employees is highest for respondents from schools, who had an average of 34.8, up from 30.7. They were followed by Ys (22.6) and camps (20.6). (See Figure 11.)
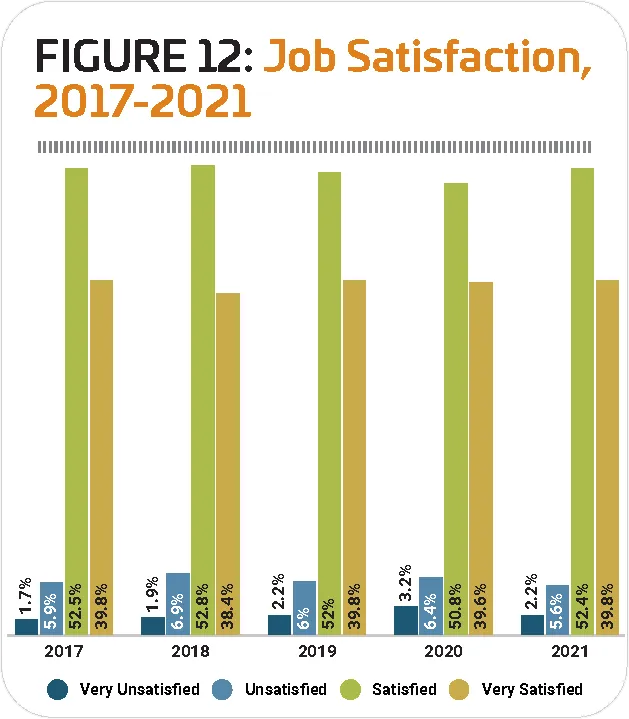
Despite what was a tremendously challenging year for workers in just about every profession, professionals in parks, recreation, sports, fitness and aquatic facilities are overwhelmingly satisfied with their work. In fact, the percentage of respondents who say they are unsatisfied in their jobs fell in 2021 to 7.8%, from 9.6% in 2020. The vast majority of respondents are either satisfied (52.4%) or very satisfied (39.8%) with their current jobs. (See Figure 12.)
Respondents from schools were the most likely to report that they were satisfied in their work, with 94.8% of school respondents indicating they were either satisfied or very satisfied with their jobs. They were followed by parks (93.8%), and Ys and rec centers (92.1%). Conversely, respondents from colleges were the most likely to report they were unsatisfied with their jobs, though not many more than one in 10 (11.7%) indicated they were not satisfied. RM
