


A Look at Trends in Parks & Recreation

In this section, we take a look at the latest trends among respondents from parks agencies. The largest cohort covered in the survey, these respondents made up 31.6% of the survey respondents, down from 42.7% in 2021.
Park respondents were most likely to be located in the Midwest or West. In fact, one-third (33%) of park respondents were in the Midwest, while 22.7% were located in the Western states. Another 17% were from the Northeast, while 15.9% were from the South Atlantic region, and 10.8% were from the South Central region.
More than half (52.6%) of park respondents said they were located in suburban communities. Another 27.4% were from rural communities, and 20% were from urban areas.
On average, park respondents said they reach a population of 83,270 people, a sharp decrease from 2021's average of 127,000. They were slightly less likely than non-park respondents to report that they reach an audience of 100,000 or more, and they were much less likely to reach an audience of less than 20,000 people. Some 15.3% of park respondents said they reach an audience of 100,000 or more people, compared with 17.7% of non-park respondents. And while 58% of non-park respondents said they reach an audience of less than 20,000, 42.4% of park respondents serve a population of less than 20,000.
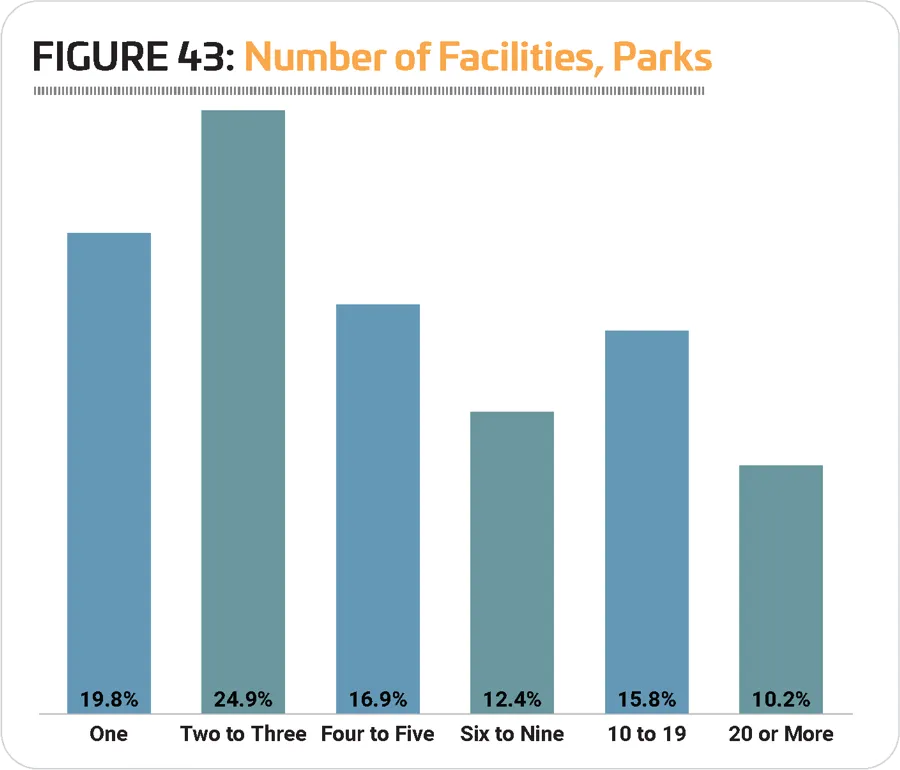
On average, park respondents said they manage nine individual facilities, down from 11.1 in 2021. More than a quarter (26%) of park respondents said they manage 10 or more facilities, representing virtually no change from 25.9% in 2021. This compares with just 8.9% of non-park respondents. Conversely, while around one-fifth (19.8%) of park respondents said they manage just a single facility, well over half (56.1%) of non-park respondents said they have just one facility to manage. Nearly a quarter (24.9%) of park respondents manage two or three facilities, while 16.9% manage four to five, and 12.4% manage between six and nine facilities. (See Figure 43.)
Park respondents were most likely to report that their audience was made of up all age groups, or of children ages 4 to 12. Some 50.8% of park respondents said they reach all ages, vs. 29.2% of non-park respondents; and while 29.4% of park respondents said their primary audience is made up of children ages 4 to 12, just 15.9% of non-park respondents reach children as their primary audience. Another 12.4% of park respondents said their audience was primarily made up of adults, while 4.5% primarily reach teens and 2.8% primarily serve seniors.
Park respondents were most likely to be located in the Midwest or West. In fact, one-third (33%) of park respondents were in the Midwest, while 22.7% were located in the Western states. Another 17% were from the Northeast, while 15.9% were from the South Atlantic region, and 10.8% were from the South Central region. More than half (52.6%) of park respondents said they were located in suburban communities. Another 27.4% were from rural communities, and 20% were from urban areas.
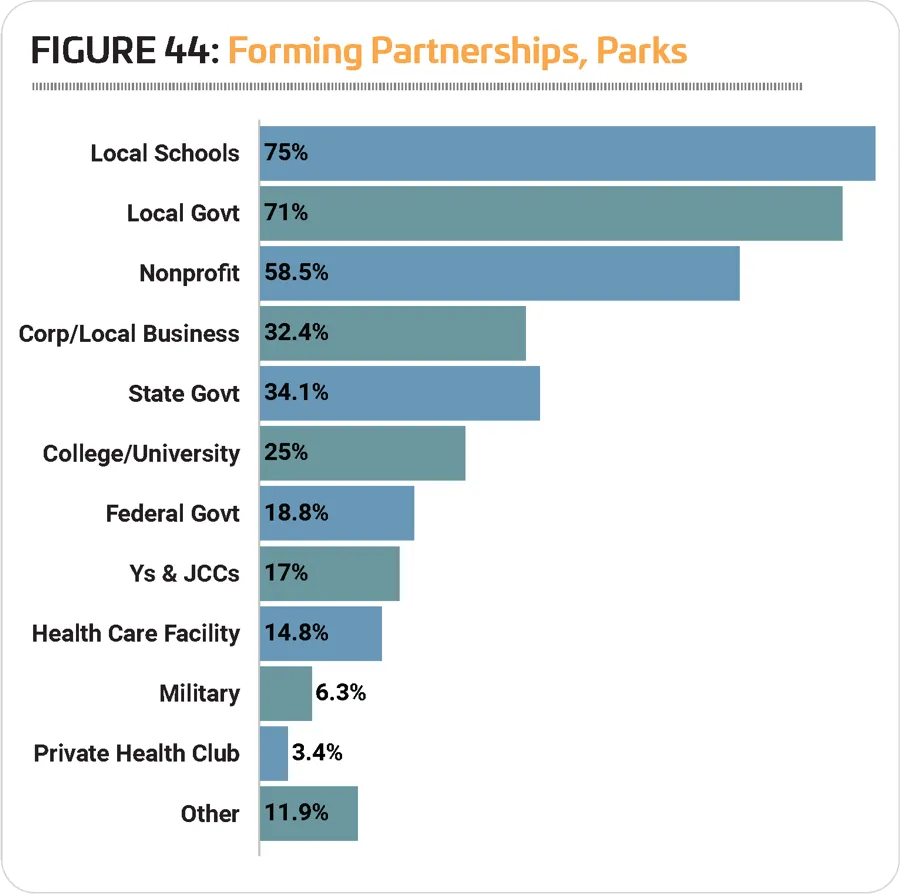
A majority of park respondents (93.8%) said that they form partnerships with outside organizations, down slightly from 2021, when 94.7% of park respondents worked with outside organizations. This compares with just 77.6% of non-park respondents in 2022 who said they partner with other organizations (down from 82.9%). Three-quarters of park respondents (75%) said they partner with local schools, up from 72.6% in 2021, the only type of partnership to see an increase this year for park respondents. Other common partners for parks include: local government (71%), nonprofit organizations (58.5%), state government (34.1%), and corporations or local business (32.4%). (See Figure 44.)
Revenues & Expenditures
When it comes to park revenues, the COVID-19 pandemic had an obvious impact (nearly two-thirds of park respondents reported that their revenues fell in 2020), and in this year's data, we can see the recovery from that impact, with volatility continuing through 2021, and a more positive outlook for revenues in 2022 and 2023. In 2021, more than half (54.1%) of park respondents said their revenues were higher, while 23.5% reported a decrease and 22.3% reporting revenues remained the same for the year. (See Figure 45.)
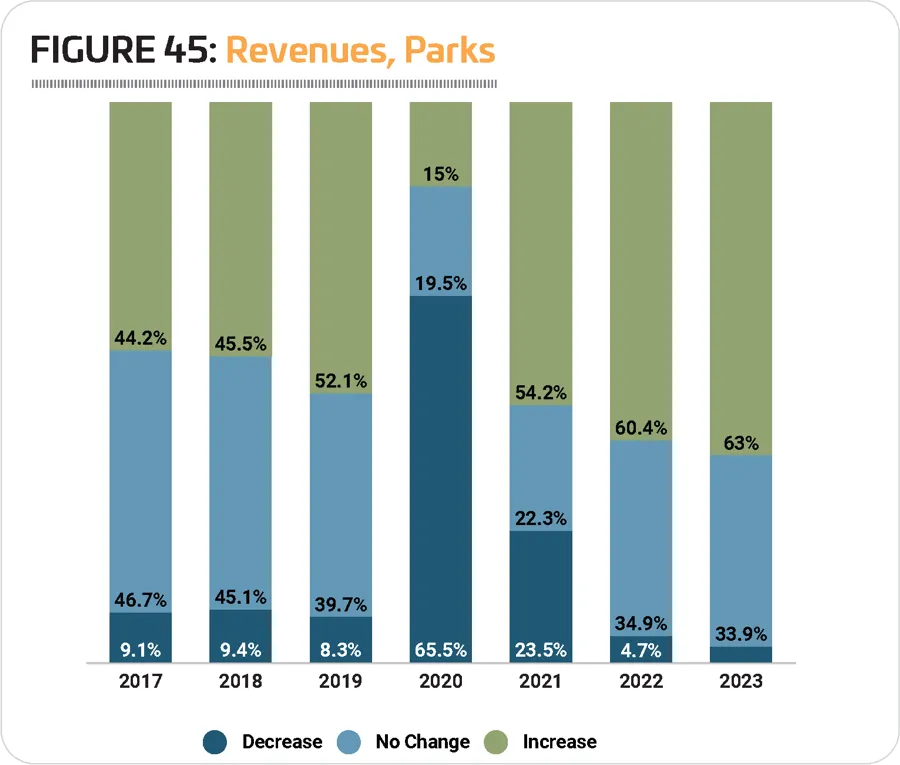
In 2022 and 2023, more than six out of 10 park respondents expect their revenues to increase, with 60.4% expecting growth in 2022 and 63% expecting growth in 2023. Very few park respondents expect their revenues to decrease in either 2022 (4.7%) or 2023 (3%).
Park respondents reported a 32.4% increase to their average operating expenditure from 2020 to 2021, which seems substantial before factoring in the pandemic impact. From 2019 to 2021, the increase is just 6.5%, from an average of $2,310,000 in 2019 to $2,460,000 in 2021. (Operating costs for park respondents in 2020 averaged $1,860,000.)
Park respondents were most likely to report that their audience was made of up all age groups, or of children ages 4 to 12. Some 50.8% of park respondents said they reach all ages, vs. 29.2% of non-park respondents; and while 29.4% of park respondents said their primary audience is made up of children ages 4 to 12, just 15.9% of non-park respondents reach children as their primary audience. Another 12.4% of park respondents said their audience was primarily made up of adults, while 4.5% primarily reach teens and 2.8% primarily serve seniors.
Over the next two years, park respondents expect a slower rate of growth in their operating costs, with a 3.3% increase from 2021 to 2022 (to an average of $2,540,000), and a 2.8% increase from 2022 to 2023 (to an average of $2,610,000).
On average, park respondents report that they recover 43.5% of their operating costs via revenues, a number that has remained relatively stable for the past three years, with 43.3% in 2021 and 43.8% in 2020. The highest average for parks was seen in 2016, when an average of 45.1% of costs were recovered via revenues. More than a third (35.5%) of park respondents said their revenues cover 30% or less of their operating cost. This compares with 21.9% of non-park respondents. Another 19.5% of park respondents said they cover between 31% and 50% of their operating costs via revenues, while 12.4% cover between 51% and 70% of their operating costs via revenue. Less than one-fifth (19.5%) of park respondents said their revenues cover at least 71% of their operating costs, compared with 45.7% of non-park respondents.
Over the next two years, park respondents expect a slower rate of growth in their operating costs, with a 3.3% increase from 2021 to 2022 (to an average of $2,540,000), and a 2.8% increase from 2022 to 2023 (to an average of $2,610,000).
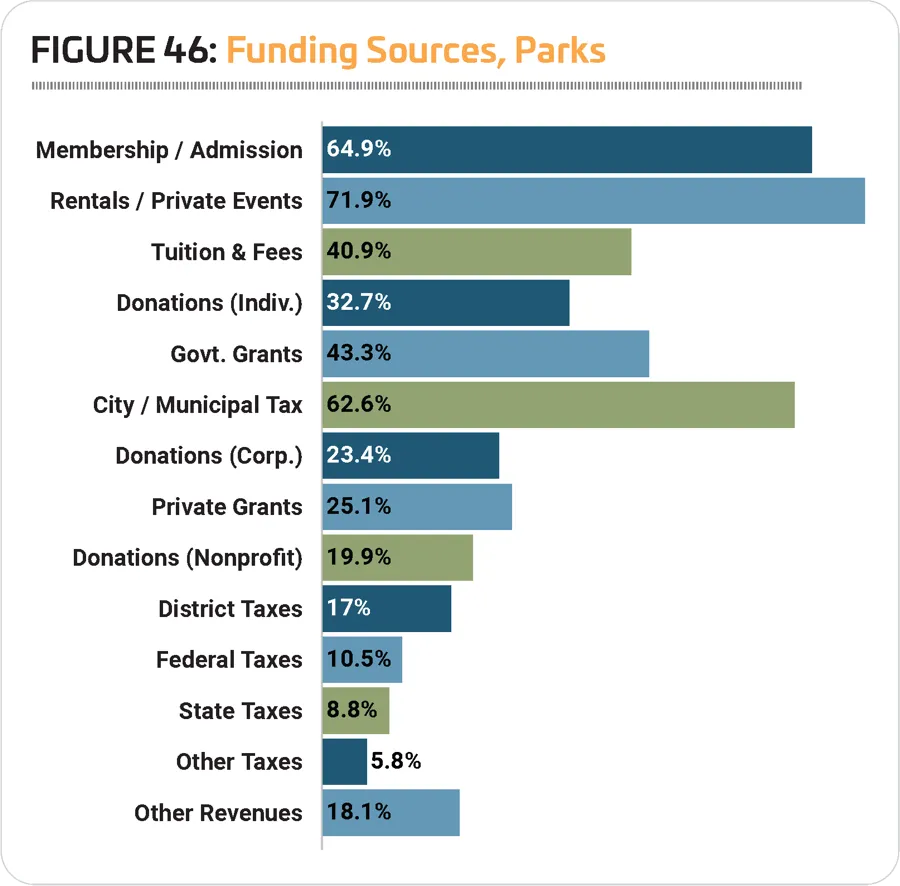
When it comes to sources of funding, rentals and private events, membership or admission fees, and city or municipal taxes were the most common for park respondents. Some 71.9% said that rentals and private events were a source of funding for their facilities. Another 64.9% received funding from membership or admission fees, and 62.6% received funding through city or municipal taxes. Other common sources of funding for park respondents include: government grants (43.3%), tuition and fees (40.9%), and donations from individuals (32.7%). (See Figure 46.)
Park respondents in 2022 were slightly less likely to indicate that they had taken actions to reduce their operating expenses over the past several years. Some 84.1% of park respondents had taken such action, down from 91.2% in 2021. This compares with 85.6% of non-park respondents (down from 89.3%). The most common measures park respondents had employed to reduce their operating expenses include: increasing fees (42.9%, compared with 39.7% of non-park respondents), reducing their hours of operation (42.9% vs. 39.7%), reducing staff (41.2% vs. 42.5%), cutting programs and services (38.8% vs. 30.6%), and putting construction and renovation plans on hold (33.5% vs. 31.4%).
Parks Have the Power to Address Climate Change, Says New Report
Released alongside its annual ParkScore index, "The Power of Parks to Address Climate Change: A Special Report" from the Trust for Public Land asked parks departments in the 100 most populous cities in the United States what actions they're taking around climate change.
The answer is: Quite a lot, but they're not doing it alone. Trust for Public Land said neighborhood associations, climate-justice groups, arts organizations and environmental activists are all pushing cities to take more aggressive climate measures. Case studies from Iowa, Georgia and Florida included in the Special Report show three cities' climate measures in action.
"Communities are struggling with real threats from the climate crisis, like flooding and extreme heat," said Diane Regas, president and CEO of Trust for Public Land in the report. "And areas with the least amount of park space, namely communities of color and low-income neighborhoods, suffer the most. The good news is we have the tools to counter some of the worst impacts of climate change by using our public parks and schoolyards."
Some of the findings from the report include:
- 85% of cities are adapting parks and recreation facilities to address climate change.
- 77% are enlisting parks to counter urban heat.
- 67% are improving surfaces to reduce flooding and runoff from rains.
- 20% are managing parks and woodlands to sequester carbon dioxide.
Park Facilities
As with most respondents, a large number of parks (56.5%) saw the number of people using their facilities drop in the initial year of the pandemic, 2020. However, the return to normal usage has been quick, with 61.1% of park respondents indicating that the number of people using their facilities increased in 2021. Some respondents were obviously still feeling the effects, as 18.9% reported that the number of people using their facilities fell in 2021, still well above normal levels, which tend to hover between 5% and 10%. (See Figure 47.)
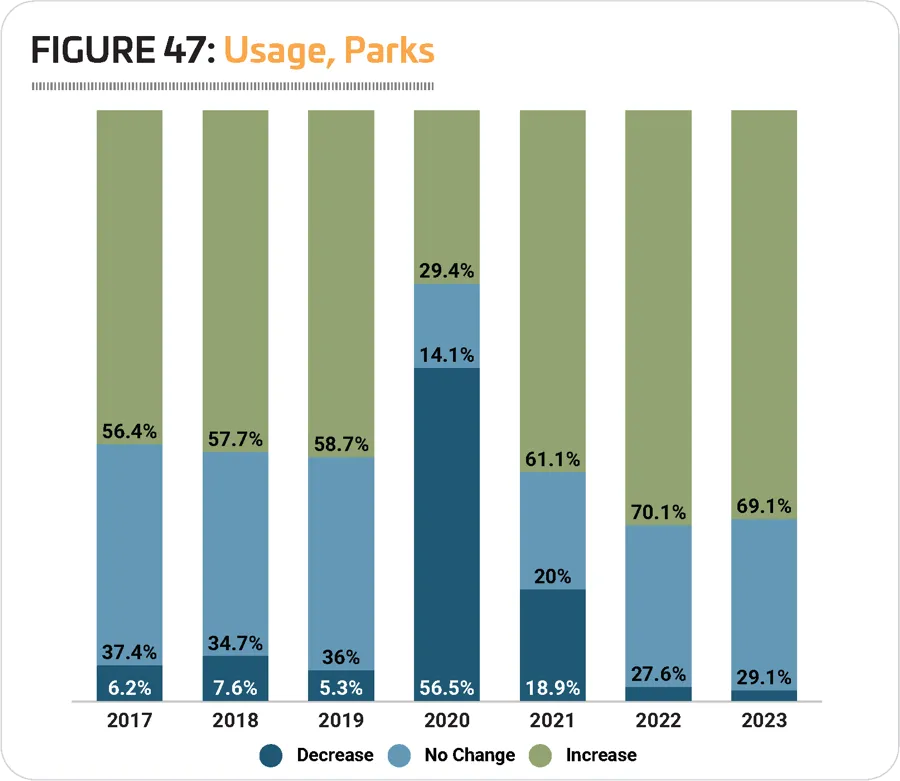
In 2022, more than seven out of 10 park respondents (70.1%) expect the number of people using their facilities to increase, while 27.6% expect no change and just 2.3% expect a decrease. Expectations for 2023 are similar, with 69.1% of park respondents expecting the number of people using their facilities to increase, 29.1% expecting no change and 1.8% expecting facility usage to decline.
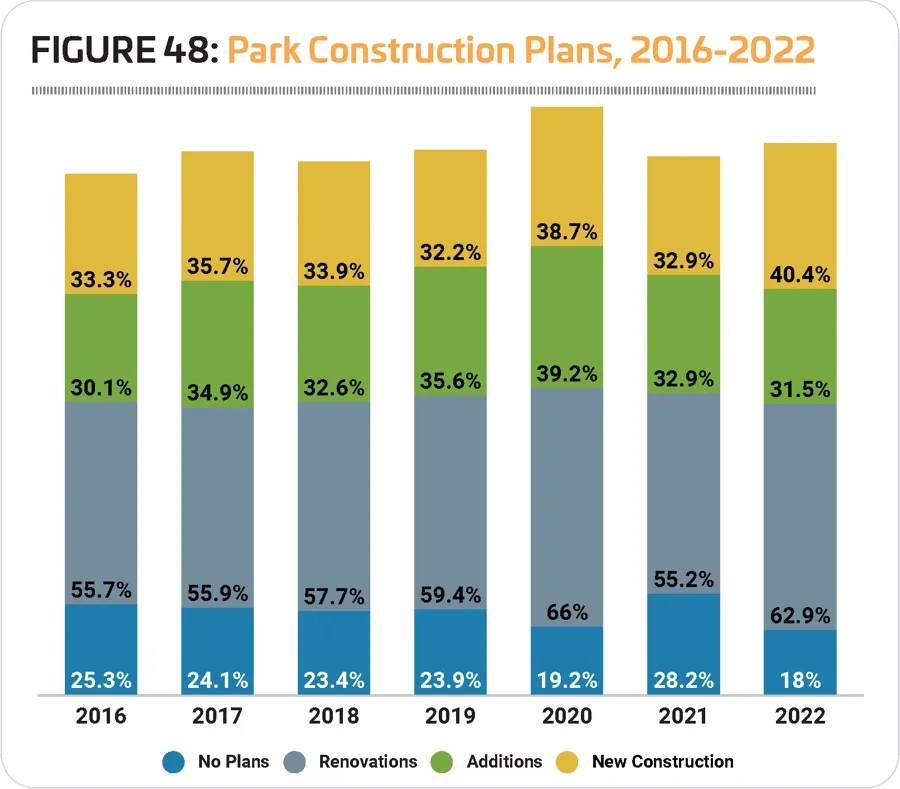
After a drop in 2021, the number of park respondents who indicated that they have plans for construction climbed to an all-time high of 82%. This compares with just 65.2% of non-park respondents. A full 40.4% of park respondents said they were planning new construction, up from 32.9% in 2021, while 31.5% were planning additions to their existing facilities (down slightly from 32.9%), and 62.9% had plans for renovations (up from 55.2%). (See Figure 48.)
Park respondents reported a 3.3% increase to their average planned construction budget from 2021 to 2022, from an average of $5,160,000 to $5,330,000 in 2022. This is still 4.3% lower than the average reported for 2020 ($5,570,000).
Once again, this year saw little change other than positioning of the features most commonly found among park respondents' facilities. The 10 most common park features in 2022 include: playgrounds, park shelters such as gazebos and picnic shelters, park restroom structures, outdoor sports courts for sports like basketball or tennis, walking and hiking trails, open spaces such as gardens and natural areas, bleachers and seating, natural turf sports fields, concession areas, and community or multipurpose centers. Community or multipurpose centers rose into the top 10, essentially switching places with classrooms and meeting rooms.
As was the case with construction plans in general, far more park respondents in 2022 said they had plans to add features at their facilities than non-park respondents. In fact, more than half (53.4%) of park respondents in 2022 said they were planning to add features at their facilities, up from 48.6% in 2021. This compares with just 32.5% of non-park respondents in 2022 who have plans to add features at their facilities, up from 29.8%.
The most commonly planned additions for park respondents in 2022 include:
- Splash play areas (planned by 31.6% of park respondents who will be adding features)
- Synthetic turf sports fields (24.2%)
- Dog parks (22.1%)
- Playgrounds (20%)
- Outdoor fitness areas and fitness trails (16.8%)
- Bike trails (16.8%)
- Park shelters (15.8%)
- Park restroom structures (15.8%)
- Community or multipurpose center (14.7%)
- Open spaces and natural areas (14.7%)
Parks Are More Involved in Outreach, Inclusion & Climate Change
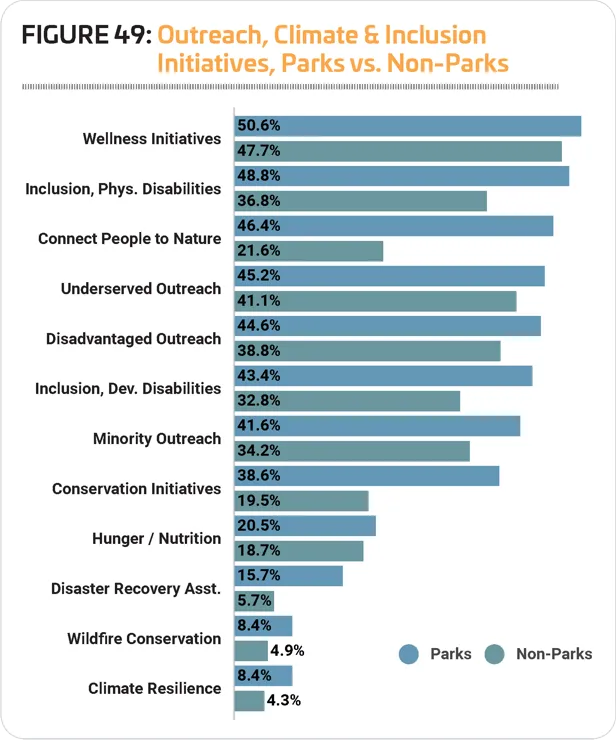
When we asked Industry Report respondents about the initiatives they are involved in related to fitness, climate, inclusion and outreach to disadvantaged populations, parks were more likely to be rising to the challenge. Some 82.5% of park respondents said they were involved in at least one such initiative, while 76.1% of non-park respondents had involvement in these initiatives.
The initiatives park respondents were most commonly involved in include: wellness initiatives (50.6% of park respondents, vs. 47.7% of non-park respondents), inclusion initiatives for those with physical disabilities (48.8% vs. 36.8%), connecting people with nature (46.4% vs. 21.6%), outreach to underserved communities (45.2% vs. 41.1%), and outreach to economically disadvantaged communities (44.6% vs. 38.8%). (See Figure 49.)
Programming
Park respondents were just slightly more likely than non-park respondents to indicate that they provide programming of any kind at their facilities. While 96.8% of non-park respondents host programming at their facilities, some 97.7% of park respondents do so, down from 99.1% in 2021 and 98.7% in 2020.
The most common programs found in park respondents' facilities include: holidays and other special events (81.6% of park respondents include them), day camps and summer camps (71.8%), youth sports teams (70.1%), group exercise programs (63.2%), programming for active older adults (60.9%), educational programs (59.8%), adult sports teams (59.8%), fitness programs (56.3%), mind-body balance programs such as yoga (56.3%), and festivals and concerts (54.5%).
Park respondents were just slightly more likely than non-park respondents to indicate that they provide programming of any kind at their facilities. While 96.8% of non-park respondents host programming at their facilities, some 97.7% of park respondents do so, down from 99.1% in 2021 and 98.7% in 2020.
Programs that saw an increase for park respondents in 2022 include: day camps and summer camps (up 3.9 points from 67.9%), mind-body balance programming (up 3.9 points from 52.4%), group exercise programs (up 1.3 points from 61.9%), festivals and concerts (up 1.2 points from 53.3%), adult sports teams (up 0.7 points from 59.1%), and fitness programs (up 0.5 points, from 55.8%).
Park respondents were far more likely than non-park respondents to report that they had plans to add more programming options at their facilities over the next several years. Nearly half (49.4%) of park respondents said they had such plans (up from 44.8% in 2021), compared with just 29.4% of non-park respondents (down slightly from 29.7% in 2021).
The most commonly planned program additions in 2022 for parks include:
- Fitness programs (up from No. 3)
- Environmental education programs (up from No. 7)
- Mind-body balance programs such as yoga (up from No. 4)
- Group exercise programs (down from No. 1)
- Teen programming (down from No. 2)
- Performing arts programs (did not appear in the top 10 for parks in 2021)
- Adult sports teams (up from No. 9)
- Educational programs (down from No. 6)
- Special needs programs (up from No. 10)
- Day camps and summer camps (did not appear in 2021)
Performing arts programs and day camps and summer camps replaced programs for active older adults and holidays and other special events from the top 10 in 2021. RM
