


A Look at Trends in YMCAs

In this section, we'll cover the trends reported by what we refer to as "Y respondents," which includes not only YMCAs and YWCAs, but other facilities that provide similar programs and services and are nonprofit in nature, such as JCCs and Boys & Girls Clubs. In addition to typically being nonprofit facilities, this group tends to stand out in other ways, such as a larger number of program offerings and community outreach. Respondents from Ys and similar facilities made up 8.3% of the survey audience in 2022.
Respondents from Ys were most likely to be located in the Midwest, with 30.4% of these respondents indicating they were from this region. The South Central region followed, with 23.9% of Y respondents. Slightly fewer respondents were from the Northeastern (17.4%) and South Atlantic (17.4%) states. And the Western region was home to 10.9% of Y respondents.
The largest number of Y respondents—45.5%—were from suburban communities. Another 30.4% were located in rural communities, and 26.1% were to be found in urban areas.
On average, Y respondents said they reach a population of 141,200 people, up from 106,700 in 2021. They were somewhat less likely to serve 20,000 or fewer people, while being slightly more likely to reach 100,000 or more, compared with respondents from other facility types. Some 36.2% of Y respondents said they reach a population of 20,000 or fewer, compared with 54.6% of non-Y respondents. At the other end of the spectrum, 21.3% of Y respondents said they reach a population of 100,000 or more, compared with 16.5% of non-Y respondents.
Y respondents managed an average of 4.6 individual facilities in 2022, up from 4 in 2021. They were somewhat more likely than non-Y respondents to report that they managed between one and three facilities. Some 72.3% of Y respondents said they manage one to three facilities, compared with 66.9% of non-Y respondents. Some 14.9% of Y respondents said they manage 10 or more individual facilities, a similar number to non-Y respondents (14.2%).
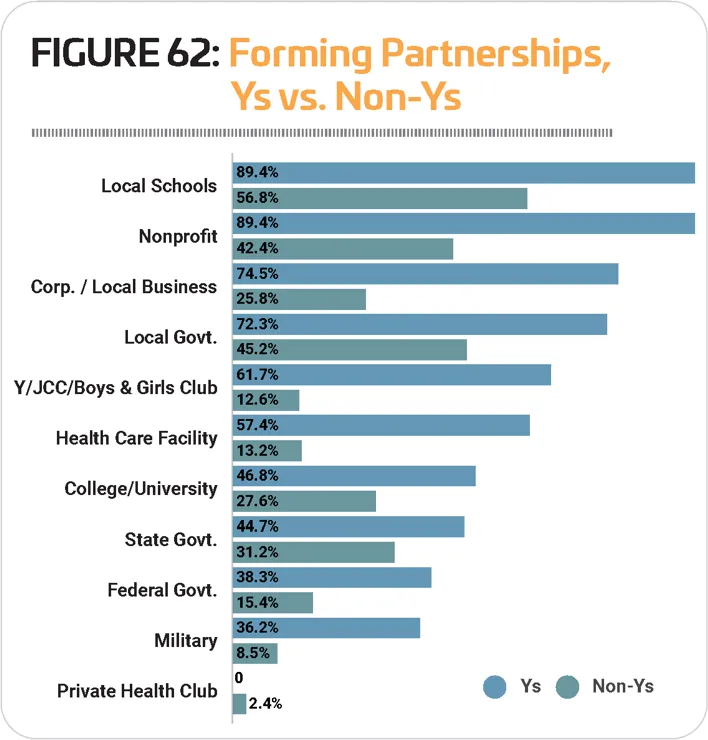
Respondents from Ys were among those most likely to report that they had formed partnerships with other organizations. Nearly all—97.9%—Y respondents said they have such partnerships, compared with 80.9% of non-Y respondents. With the exception of private health clubs, which no Y respondents partnered with, Y respondents were more likely to engage with every other kind of partner named in the survey than those from other facilities. The most common partners for Ys in 2022 were: local schools (89.4%, compared with 56.8% of non-Y respondents), nonprofit organizations (89.4% vs. 42.4%), corporate and local business (74.5% vs. 25.8%), local government (72.3% vs. 45.2%), and other Ys and similar organizations (61.7% vs. 12.6%). (See Figure 62.)
Respondents from Ys were most likely to report that they work with all ages as the primary audience for their facilities. Nearly half (48.9%) of Y respondents said they primarily reach all ages, compared with 34.9% of non-Y respondents. Another 29.8% of Y respondents said their primary audience is made up of children ages 4 to 12, and 21.3% said they primarily reach adults.
Revenues & Expenditures
The pandemic had a dramatic impact on revenues for Ys and similar facilities, with 83.9% of these respondents reporting that their revenues in 2020 had fallen (compared with 63.2% of non-Y respondents who reported a decrease in revenues in 2020). That said, they were also among the most likely to report increasing revenues in 2021, second only to camps. Some 60.9% of Y respondents said their revenues in 2021 had increased, while slightly less than a third (32.6%) reported a decrease, and 6.5% said their revenues for the year were unchanged. (See Figure 63.)
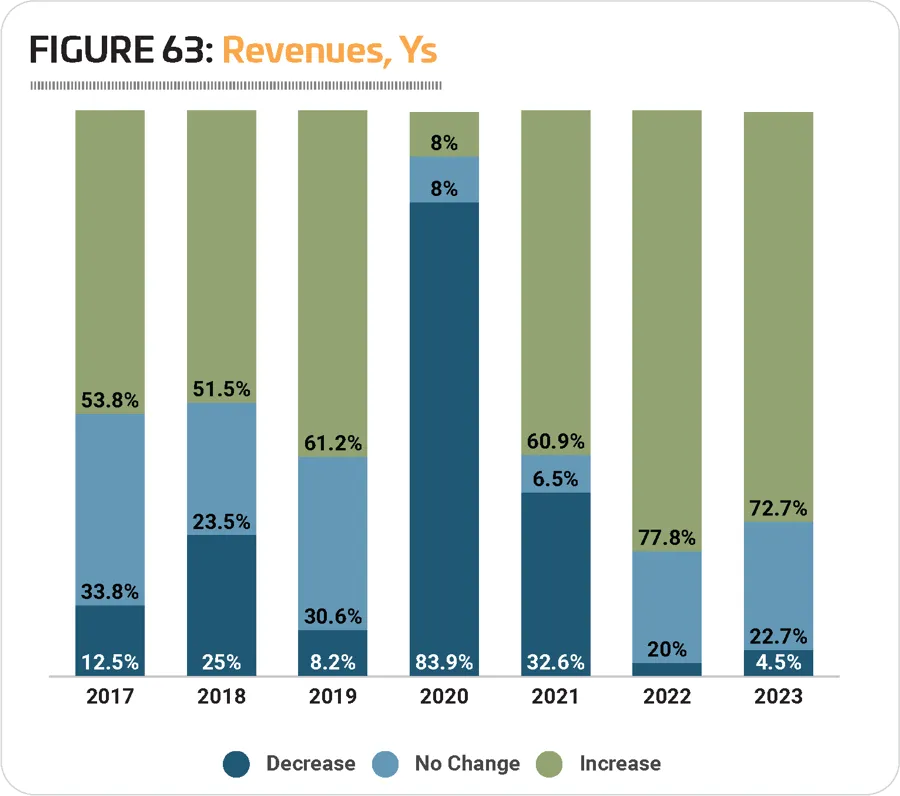
Looking forward, Y respondents are extremely positive about their revenue prospects, with more than seven out of 10 expecting an increase in 2022 (77.8%) and in 2023 (72.7%).
After reporting a 35.3% decrease to their average operating cost from 2019 to 2020, Y respondents saw a decrease in their average cost in 2021. In 2021, Y respondents' average operating cost was $3,570,000, 5.1% lower than the average for 2020 of $3,760,000.
However, despite this slight decrease, they are expecting their operating costs to grow significantly in 2022, to an average of $4,570,000, an increase of 28%. And in 2023, they expect a further increase of 5.5%, to an average of $4,820,000.
On average, Y respondents in 2022 reported that they recover 68.4% of their operating costs via revenues, down from 72.2% in 2021. Some 40% of Y respondents said they earn back at least 81% of their operating costs via revenues, compared with 27.7% of non-Y respondents. And while 18.8% of non-Y respondents earn back 20% or less of their operating costs via revenues, just 8.9% of Y respondents said they earn back 20% or less.
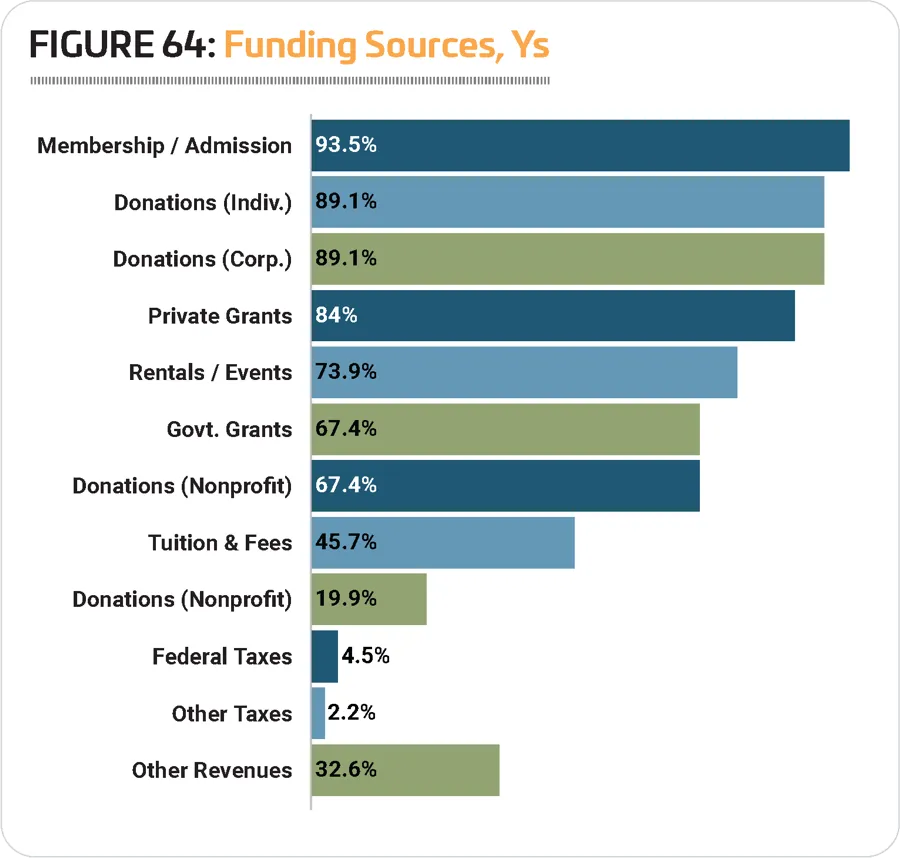
Outside of tax dollars, Y respondents were more likely to fund their facilities with every kind of funding covered in the survey than non-Y respondents. This includes their most common funding sources: membership and admission fees (93.5% of Y respondents funded their facilities with membership and admission fees, compared to 59.2% of non-Y respondents), individual donations (89.1% vs. 32.9%), corporate donations (89.1% vs. 19.8%), private grants (84% vs. 18.8%), and fees from rentals and private events (73.9% vs. 58.4%). (See Figure 64.)
Respondents from Ys were more likely than others to report that they had taken action to reduce their operating expenses, though far fewer had done so in 2022 than in 2021. Some 89.4% of Y respondents said they had taken such action, down from 97.4% in 2021. This compares with 83.3% of non-Y respondents who had taken such action in 2022 (down from 90.9%). The most common actions Y respondents had taken in order to reduce their costs include: reducing their hours of operation (68.1% of Y respondents had done so, compared with 37.9% of non-Y respondents), reducing staff levels (59.6% vs. 37.9%), increasing fees (46.8% vs. 39.5%), cutting programs and services (44.7% vs. 31.6%), and putting construction or renovation plans on hold (40.4% vs. 30.8%).
Y Facilities
When it comes to the number of people using their facilities, Ys, with their mostly indoor amenities, took a big hit in 2020 when the pandemic hit. A majority of Y respondents—91.2%—said the number of people using their facilities decreased in 2020. Many reported an increase in usage in 2021 (69.6%), but the year was still volatile, with 26.1% indicating the number of people using their facilities had fallen, and very few (4.3%) reporting no change. (See Figure 65.)
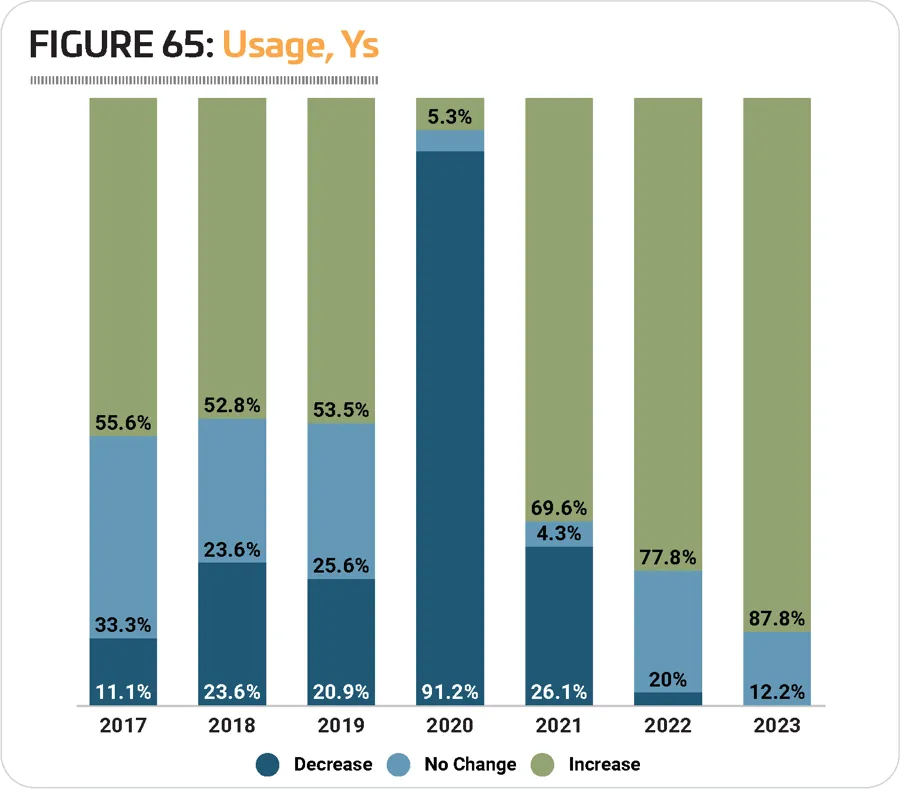
Y respondents were extremely positive about usage trends going forward, though. In 2022, 77.8% expect the number of people using their facilities to rise, while 20% expect no change and 2.2% expect a decrease. And in 2023, 87.8% of Y respondents are expecting to see increasing usage, while 12.2% projected no change, and none expected a decrease.
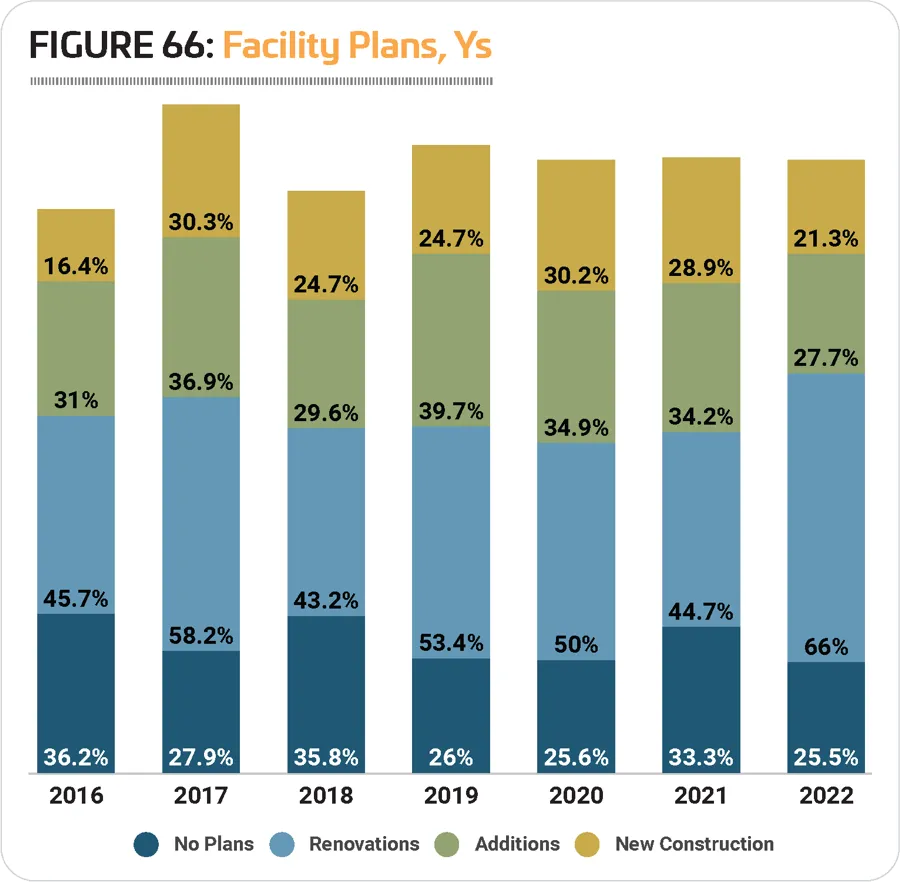
Almost three-quarters (74.5%) of Y respondents in 2022 said they have plans for construction over the next few years, up from 66.7% in 2021. An impressive two-thirds (66%) have plans to renovate their existing facilities, up from 44.7% in 2021. The number of Y respondents planning additions fell from 34.2% in 2021 to 27.7% in 2022, and the number planning to build new facilities fell from 28.9% in 2021 to 21.3% in 2022. (See Figure 66.)
Given these decreases in respondents planning additions and new construction, and the increases in those planning renovations, it's not surprising that the average budget for construction for Y respondents has fallen for the past couple of years. In 2022, Y respondents were planning to spend an average of $4,740,000 on their construction, an 8.7% decrease from 2021, when their average construction budget was $5,190,000. This in turn represented a 33.3% decrease from 2020, when the average was $7,780,000.
The 10 features most commonly found in Y respondents' facilities in 2022 include: indoor courts for sports like basketball and volleyball, locker rooms, fitness centers, exercise studio rooms, playgrounds, indoor aquatic facilities, childcare centers, classrooms and meeting rooms, Wi-Fi service, and open spaces, such as gardens and natural areas.
Almost half (48.9%) of Y respondents said they have plans to add features at their facilities in the next three years. This is up from 38.6% in 2021 and 38.4% in 2020, and compares with 38.2% of non-Y respondents in 2022 who are planning to add features at their facilities.
The most commonly planned additions for Y respondents in 2022 include: splash play areas, playgrounds, fitness centers, park shelters like gazebos or picnic shelters, fitness trails and outdoor fitness equipment, exercise studio rooms, outdoor courts for sports like tennis and basketball, synthetic turf sports fields, natural turf sports fields, and community centers or multipurpose centers.
Programming
As usual, 100% of Y respondents said they offer programming of some kind at their facilities. This compares with 96% of non-Y respondents.
The programs most commonly on offer at Y respondents' facilities in 2022 include: day camps and summer camps (provided by 89.4% of Y respondents), youth sports teams (87.2%), holiday events and other special events (85.1%), fitness programs (85.1%), group exercise programs (83%), mind-body balance programs like yoga or tai chi (80.9%), teen programming (76.6%), educational programs (74.5%), swimming programs (74.5%), aquatic exercise programs (74.5%), and functional fitness programs (74.5%).
The two program areas that saw growth from 2021 to 2022 include teen programming (up 10.8 points from 65.8%), and holidays and other special events (up 2.6 points from 82.5%).
The number of Y respondents who said they have plans to add programs at their facilities over the next few years grew from 34.2% in 2021 to 42.6% in 2022. This compares with 35.1% of non-Y respondents in 2022 who said they had plans to add programming.
The 10 most commonly planned program additions for Ys in 2022 were:
- Teen programming (no change from 2021 or 2020)
- Performing arts programs (up from No. 3)
- Sport training, such as golf or tennis lessons (did not appear in this list in 2021)
- Arts and crafts programs (up from No. 9)
- Group exercise programs (did not appear in 2021)
- Educational programs (did not appear in 2021)
- Functional fitness programs (up from No. 10)
- Environmental education programs (down from No. 6)
- Nutrition and diet counseling (down from No. 5)
- Youth sports teams (down from No. 8)
In 2022, sport training, group exercise and educational programs all rose into the top 10 planned programs, replacing adult sports teams, individual sports activities like running clubs, and special needs programs.
Top Challenges
Like other respondents, Ys overwhelmingly named staffing issues as the top concern for their facilities. In fact, 77.3% of Y respondents named staffing as a top industry concern, compared with 63.1% of non-Y respondents.
Smaller numbers of Y respondents named other concerns as top issues for their facilities. The next most common was marketing and increasing participation, a top concern for 50% of Y respondents and 35.5% of non-Y respondents.
Some 40.9% of Y respondents named equipment and facility maintenance as a top concern, compared with 51.2% of non-Y respondents. The same number of Y respondents, 40.9%, said youth fitness and wellness was a top concern, compared with just 13.9% of non-Y respondents. RM
