


Over its 17 years, the Industry Report has grown and changed as it adapts to trends while continuing to take the pulse of recreation, sports, fitness and aquatic venues. Major events have been reflected in the data, as with the Great Recession in the earlier years of the survey, and the coronavirus pandemic in the most recent years.
This year’s survey sees one major change. In working with a new partner on our survey delivery and data collection, we decided to change up the way some data is collected when it comes to budget amounts. You’ll see this reflected in the numbers for operating costs and construction budgets. In short, the former survey did not always take into account the highest highs, which drove average measurements lower. While this makes this year’s numbers more difficult to compare with previous years, it will yield a more accurate result going forward.
In terms of the major trends, after a few years of coronavirus impact, this 17th report shows a continued return to normalcy. Some respondents—49 of them, in fact—still name “COVID” as a major challenge, and some of the fallout from the pandemic, including difficulty finding enough staff, obstacles to construction planning and supply chain issues, continues to affect many facilities. On the other hand, a majority of respondents see participation at their facilities on the rise, and a read through the list of goals for the coming year is an exercise in optimism, with many making plans to build new facilities or add to what they’ve got, and others expanding their programming capabilities. The word “grow” appears 28 times in that list of 692 respondents’ goals. The word “improve”? 53 times. And the word “build”? 61. (And just in case you’re wondering, yes, 10 respondents directly mentioned pickleball, the trend du jour.)
All of that starts here, where we’ll break down the responses from the entire survey population. We’ll look at who they are, including the kinds of facilities they represent, region of the country they’re from and more. We’ll consider their operating budgets and revenues, staffing trends, construction plans and programming lineups, along with what they consider to be the biggest challenges in the industry.
Once we get through all of that, we’ll turn to some unique cohorts within the survey population. That begins with responses from those whose facilities include aquatics, on page 38. Then we’ll examine each of the major cohorts of facility types represented in the survey response, which includes parks and recreation departments and districts (see page 56), colleges and universities (see page 68), schools and school districts (see page 74), fitness facilities and health clubs (see page 80), and finally, nonprofit facilities like YMCAs, JCCs and Boys & Girls Clubs (see page 86).
If you’re still hankering for research after devouring all of that, head over to the RecManagement.com website, where we break down the data for camp facilities, as well as community and private recreation centers.
And if you’d like a weekly dose of research tidbits, be sure you’ve signed up to receive our weekly Rec Report e-newsletter in your inbox. Every week, we highlight a different data point, mixing and matching the information to bring you additional information not included in these pages.
Is there a piece of information you’d like, but can’t find in these pages? It never hurts to ask! Send your message to [email protected], and we’ll see if we can find the answer to your questions.
Finally, don’t forget to read your July issue of Recreation Management, where our annual Salary Survey will break down salaries and more career information for the Industry Report respondents.
Who You Are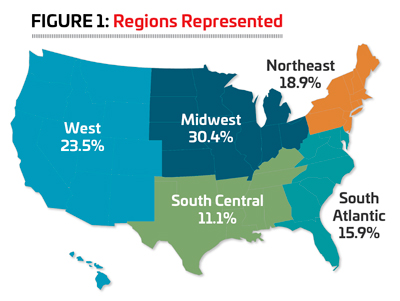
While we’ll give you a lot more detail about the respondents to the Industry Report in our July 2023 issue’s Salary Survey report, let’s begin here with a quick rundown of the demographics of our nearly 1,200 respondents.
While respondents to the survey held a variety of roles in their organizations, the majority hold leadership positions. The greatest number, 33.2%, said they are directors. Nearly one in five, 19.9%, are in administrative and management positions, including administrators, managers and superintendents. Some 15.6% of respondents said they are the chairman, CEO, president, vice president or owner of their organization or company. Another 12.9% work in operations and facility management, with titles including operations manager, facility manager, building manager or supervisor. Nearly one in 10, 9.9%, are in program and activity administration roles, including activity and program directors, managers, coordinators, specialists, coaches and instructors. A small number of respondents, just 1.4%, said they are faculty or teachers, and 7.1% said they hold a different title from the options provided.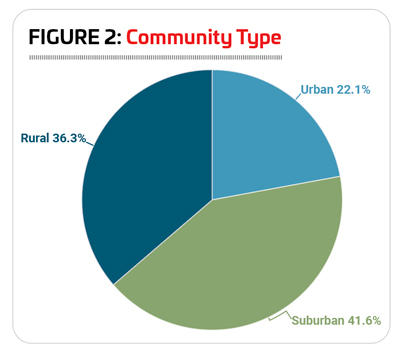
More than three out of 10 (30.4%) respondents in 2023 were from the Midwest, including Illinois, Indiana, Iowa, Kansas, Michigan, Minnesota, Missouri, Nebraska, North Dakota, Ohio, South Dakota or Wisconsin. (See Figure 1.)
They were followed by the West, home to nearly one-quarter (23.5%) of the respondents. The West includes Alaska, Arizona, California, Colorado, Hawaii, Idaho, Montana, Nevada, New Mexico, Oregon, Utah, Washington and Wyoming.
A little less than one-fifth of the respondents were from the Northeast, which includes the states of Connecticut, Maine, Massachusetts, New Hampshire, New Jersey, New York, Pennsylvania, Rhode Island and Vermont.
Some 15.9% of survey respondents call the South Atlantic region their home. This includes Delaware, Florida, Georgia, Maryland, North Carolina, South Carolina, Virginia, Washington, D.C., and West Virginia.
Finally, 11.1% of respondents said they were from the South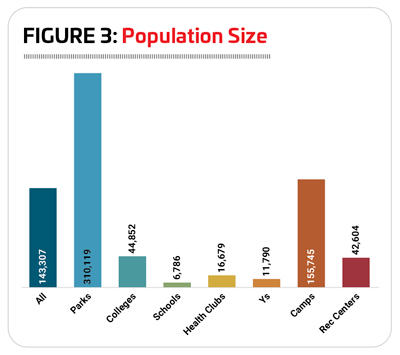 Central region, which includes Alabama, Arkansas, Kentucky, Louisiana, Mississippi, Oklahoma, Tennessee and Texas.
A single respondent (0.1%) was from outside the United States.
When it comes to community type, the largest number of respondents in 2023 reported from suburban communities. Some 41.6% of respondents were from the suburbs. The next largest group—36.3%--said they were located in rural areas, and another 22.1% were in urban communities. (See Figure 2.)
The average number of patrons reached by the facility representatives who respond to the survey has been on the rise in nearly every year since 2016, when it was 83,200. In 2023, respondents served an average of 143,307 patrons, up from 106,600 in 2022, and 97,450 in 2021. Note that one reason for the substantial increase was a change in the way the data is collected. The new collection method allowed respondents to provide a precise number rather than selecting from a range, which should yield greater accuracy overall.
Respondents from parks and camps had the largest audie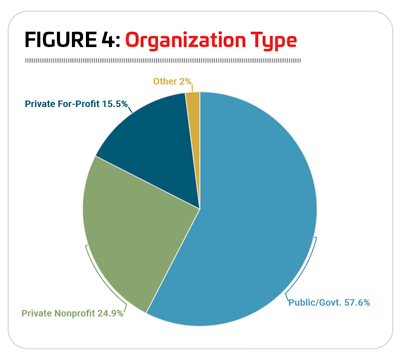 nces of patrons. Park respondents had an average of 310,119 patrons, while camps had an average of 155,745. They were followed by colleges and universities, as well as rec centers, who had an average of 44,852 and 42,604, respectively. The averages for health clubs and Ys were also similar, with health clubs reaching an average of 16,679 patrons and Ys reaching an average of 11,790. Schools had the smallest number of patrons, with an average of 6,786. (See Figure 3.)
A majority of respondents (57.6%) said they were with public or governmental organizations. Almost a quarter, 24.9% represent private, nonprofit organizations, such as Ys or Boys & Girls Clubs. Some 15.5% of respondents were with private, for-profit facilities, and 2% said they were with “other” types of organizations. (See Figure 4.)
As always the most numerous group of respondents were those from parks and recreation departments, park districts and similar organizations. Some 31.5% of respondents said they were from parks. They were followed by respondents from community or private recreation or sports centers (12.4%), colleges and universities (10.2%), schools and school districts (9.2%), private or youth camps, and campgrounds and RV parks (9%), YMCAs, YW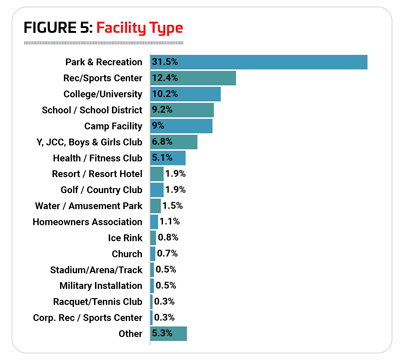 CAs, JCCs, Boys & Girls Clubs and similar facilities (6.8%), and health, fitness and medical fitness facilities (5.1%). (See Figure 5.)
Fewer respondents reported from other types of facilities, which include: resorts and resort hotels (1.9%); golf facilities and country clubs (1.9%); waterparks and amusement parks (1.5%); homeowners associations (1.1%); ice rinks (0.8%); churches (0.7%); stadiums, arenas and tracks (0.5%), military installations (0.5%); racquet and tennis clubs (0.3%) and corporate recreation or sports centers (0.3%). Another 5.3% of respondents work for “other” types of facilities, including childcare facilities and senior centers.
The vast majority of respondents from parks—98.1%—were with public or governmental organizations, with 1.1% representing private nonprofits, and 0.3% working with for-profit organizations. Schools likewise tilted heavily toward governmental and public organizations, at 79.8% of school respondents. Another 15.6% of school respondents were with private nonprofits, and 2.8% were with private, for-profit schools. Similarly, 60% of college respondents were with public schools, with 33.3% representing private nonprofit schools and 2.5% representing private for-profit schools. Rec centers also leaned most heavily toward public organizations, with more than half (56%) of the respondents. Another 22.7% of rec center respondents were with nonprofits, and 18.7% were with for-profit organizations.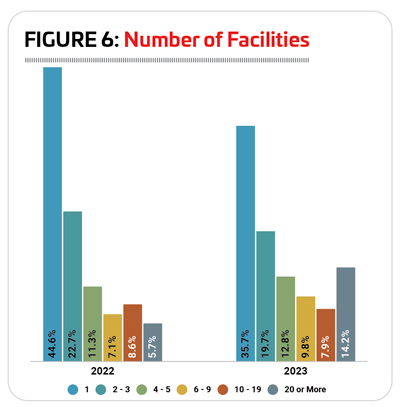
Health clubs were the only group most likely to represent for-profit organizations, with nearly six out of 10 (59.7%) of health club respondents indicating they were for-profit facilities. Another 27.3% were with nonprofits, and 13% said they were with public or governmental organizations.
Not surprisingly, Ys were by far most likely to report that they were nonprofit organizations, with 95% of Y respondents indicating they were nonprofits. Another 2.5% said they were public/governmental, and 1.3% said they represented for-profit organizations. Camps were more mixed, with nearly half (49.1%) reporting from nonprofit facilities, 28.3% from for-profit facilities and 19.8% from public/governmental facilities.
On average, respondents manage 8.5 facilities, up from 5.6 in 2022, 7.2 in 2021 and 8.3 in 2020. Fewer respondents in 2023 said they manage between one and three facilities, compared with 2022. Some 35.7% of respondents in 2023 manage a single facility, compared with 44.6% in 2022; and 19.7% of 2023 respondents manage between two and three facilities, compared with 22.7% in 2022. On the other hand, far more respondents in 2023 said they manage 20 or more facilities—14.2%, compared with just 5.7% in 2022. Some 12.8% of respondents in 2023 said they have four or five facilities to manage, while 9.8% have six to nine. Another 7.9% of respondents said they manage between 10 and 19 individual facilities. (See Figure 6.)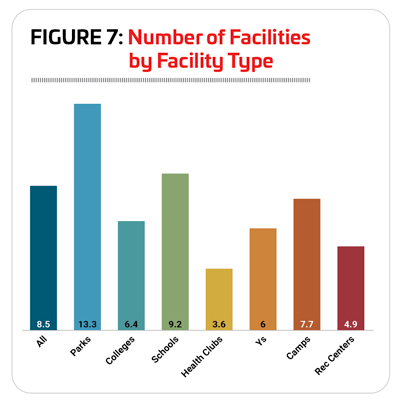
Breaking things down by community type, respondents in urban communities obviously deal with larger populations and manage a larger number of facilities than those in rural communities. In fact, those from urban communities reach an average population size of 201,988 and manage an average of 9.7 facilities. For suburban respondents, the average population reached is 190,900, and they manage an average of 8.8 facilities. Rural respondents reach an average population of 81,895, and manage an average of seven facilities. Nearly one-fifth (18.9%) of urban respondents said they manage 20 or more facilities. That number drops to 15.7% for suburban respondents and 9.8% for rural respondents.
As usual, park respondents manage the most facilities, with an average of 13.3 in 2023, up from nine in 2022. They were followed by respondents from schools, who manage an average of 9.2 facilities, and camps, with 7.7. Respondents from health clubs had the lowest number, on average, of facilities to manage, at 3.6. (See Figure 7.)
Recreation, sports and fitness facilities commonly find ways to work with other organizations, from nonprofits and government organizations to local businesses and friends groups, as a way to expand their capabilities. These kinds of partnerships can help facilities do more with less, whether it means the ability to reach a wider audience or th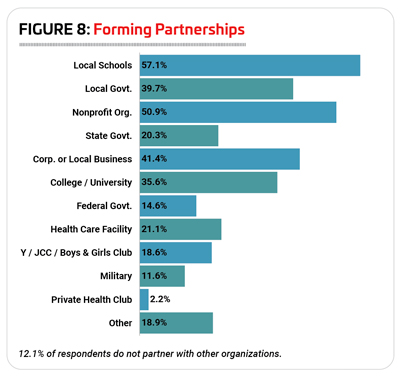 e power to expand a programming lineup. The majority (84.4%) of respondents said they currently work in partnership with other organizations, up from 82.3% in 2022, but still below the numbers reported for 2021 (87.9%) and 2020 (89%).
As usual, local schools are the most common type of partner for all types of facilities. Nearly six in 10 (57.1%) respondents said they had partnered with local schools. The next most common types of partners shifted quite a bit from 2022 to 2023, and include nonprofit organizations (50.9% of respondents had partnered with nonprofits); corporations or local business (41.4%, up from 30%); local government (39.7%, down from 47.5%); and colleges and universities (35.6%, up from 29.2%). (See Figure 8.)
Respondents from Ys, parks and rec centers were the most likely to report that they had partnered with other organizations, while those from camps and health clubs were the least likely to have partnered with others. Almost all Y respondents (97.5%) said they had partnered with other organizations. They were followed by park respondents (93.4%) and rec center respondents (89%). This compares with 72.8% of camp respondents and 73.3% of health club respondents. Colleges and schools fell in the middle, with 82.9% of college respondents and 82.2% of school respondents indicating that they had partnered with other organizations. (See Figure 9.)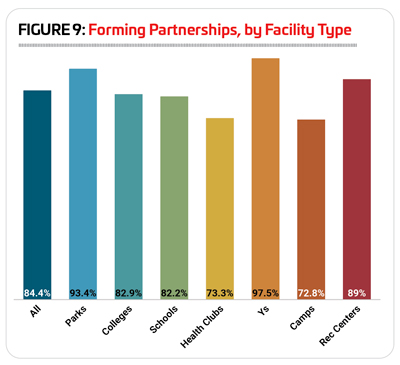
Given that they are by far the most likely to form partnerships, it logically follows that respondents from Ys are also the most likely to partner with the different types of organizations covered by the survey. The only exceptions were local government, colleges and universities, and private health clubs. Y respondents were more likely than their peers from other types of facilities to report that they had partnered with nonprofit organizations (86.1%), local schools (82.3%), corporations and local businesses (68.4%), other Ys (64.6%), health care and medical facilities (57%), state government (40.5%), military (34.2%), and federal government (27.8%).
Respondents from parks were the most likely to report partnering with local government (63% had done so), while college respondents were the most likely to have partnered with colleges and universities (70.9%), and health clubs were the most likely to have partnered with other private health clubs (13.3%).
When asked about the age range of their typical audience, respondents were by far most likely to indicate that they reach all ages. Some 43.2% of respondents said their facilities serve an all-ages audience. This is up substa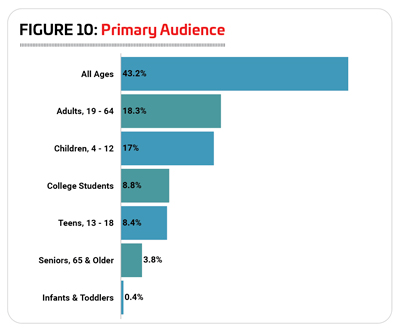 ntially from 2022, when 36.1% reached all ages. The next largest groups of respondents in 2023 primarily reach adults ages 19 to 64 (18.3%), and children ages 4 to 12 (17%). Smaller numbers of respondents said their audience was primarily made up of college students (8.8%), teens ages 13 to 18 (8.4%), seniors 65 and older (3.8%), and infants and toddlers (0.4%). (See Figure 10.)
The respondents most likely to reach all ages at their facilities included parks (64.3% said they reach all ages) and Ys (51.3%). Those who were most likely to serve an audience of adults ages 19 to 64 were most likely to be from health clubs (63.6%) and rec centers (20.1%). Respondents reporting that they reached an audience of children ages 4 to 12 were most likely to be from schools (26.6%) and Ys (26.3%). Teens were most likely to be the primary audience for respondents from schools and school districts (44%), while college students were obviously the most likely audience for colleges and universities (82.5%). Seniors were most likely to be the primary audience at health clubs (7.8%) and rec centers (6.8%). Finally, 2% of rec centers and 1.8% of schools said their primary audience was comprised of infants and toddlers.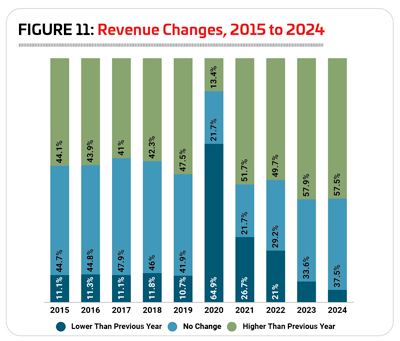
Revenues & Expenditures
Obviously, the shutdowns associated with the pandemic had a major impact on revenues for recreation, sports and fitness facilities. The year 2020 showed the most dramatic effect, with 64.9% of respondents reporting that their revenues declined from 2019. But 2021 and 2022 also showed a lingering impact, as 26.7% of respondents in 2021 and 21% in 2022 reported declining revenues.
Following the sharp declines in 2020, though, the year 2021 also saw revenues rise for more than half (51.7%) of respondents, and in 2022, nearly half (49.7%) of respondents saw their revenues rise. (See Figure 11.)
Looking forward, respondents were more typically optimistic about their potential for revenue growth this year and next, with 57.9% predicting revenues will be higher in 2023, and 57.5% expecting higher revenues in 2024. At the same time, 8.5% are still expecting their revenues in 2023 to be lower, and 5% expect lower revenues in 2024.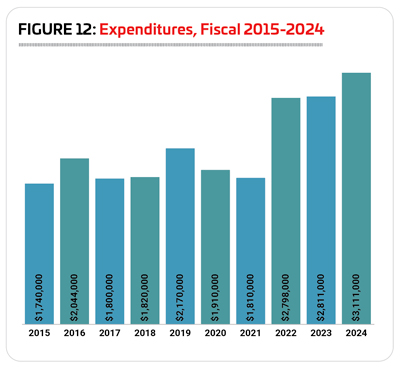
Before we dig into the data on operating expenditures, it should be noted that the survey instrument was changed in 2023, allowing us to capture more accurate data. Rather than selecting where their budgets fit into a range of options, respondents were allowed to enter an exact dollar amount. Because this method allows for much higher numbers to be input, the averages are trending higher. We’ll report the top reported number, as well as the median, beginning with this year’s survey, to give a more complete picture of the numbers reported. (Quick refresher for the forgetful: The median is the number that falls in the exact center of the spread.)
Using the prior survey instrument, we saw operating expenses climb relatively steadily from 2015 to 2019, before dropping 12% from 2019 to 2020, the year of the coronavirus pandemic, when many facilities were shuttered. (See Figure 12.)
In 2022, respondents reported an average operating expense of $2,798,000. The highest reported number was $131,761,000, and the median was just $700,000.
In 2023, respondents are projecting their average operating cost to increase by 0.5%, to an average of $2,811,000. And in 2024, they projected a 10.7% increase, to an average of $3,111,000.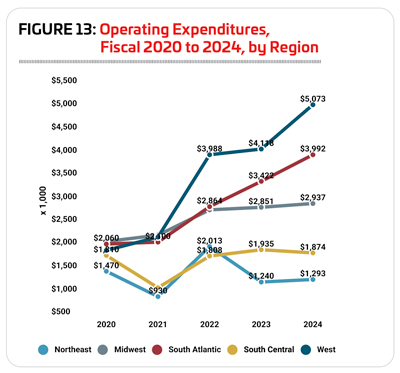
Considered by community type, urban respondents not only had much higher average operating costs than their suburban and rural counterparts, but they also projected the steepest increase in average operating costs from 2022 to 2024. In 2022, urban respondents spent an average of $4,317,000, 38.2% higher than the average for suburban communities ($3,123,000) and 144.3% higher than the average for rural respondents ($1,767,000). Remember that high of $131,761,000? That’s for an urban respondent. The median for urban respondents was $905,000. The high for suburban respondents was $108 million, with a median of $850,000. And the high for rural respondents was $30 million, with a median of $500,000.
Looking forward, urban respondents projected a 34.9% increase to their average operating cost from 2022 to 2024, to an average of $5,825,000. This compares with an 11.3% increase for rural respondents, to an average of $1,967,000, and a 6.2% decrease for suburban respondents, to an average of $2,928,000.
Respondents in the West reported the highest overall operating expenses, followed by the South Atlantic region. Both of these regions also predicted the steepest rise to their average operating cost from 2022 to 2024. In 2022, 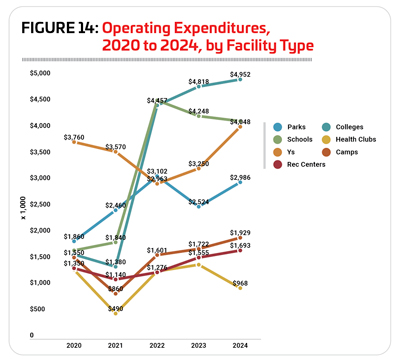 respondents in the West spent an average of $3,988,000 on their operating expenses. This is 39.2% higher than the average for the South Atlantic region ($2,864,000), 42.7% higher than the Midwest ($2,795,000), 98.1% higher than the Northeast ($2,013,000), and a whopping 120.6% higher than the South Central region ($1,808,000). (See Figure 13.)
The highest reported operating expense was found in the West—$131,761,000, with a median of $1 million. The Midwest had a high of $108 million with the median at $675,000. The Northeast had a high of $100.7 million, with a median of $420,000. The South Atlantic region had a high of $35 million, with a median of $695,000. And the South Central region had a high of $15 million, with a median of $800,000.
Looking forward, respondents from the South Atlantic region predicted the sharpest increase to their average operating expenditures from 2022 to 2024, with a rise of 39.4% to an average of $3,992,000. They were followed by the West, where respondents projected a 27.2% increase to an average of $5,073,000. Smaller increases were projected by respondents in the Midwest (up 5.1% to an average of $2,937,000 in 2024) and the South Central 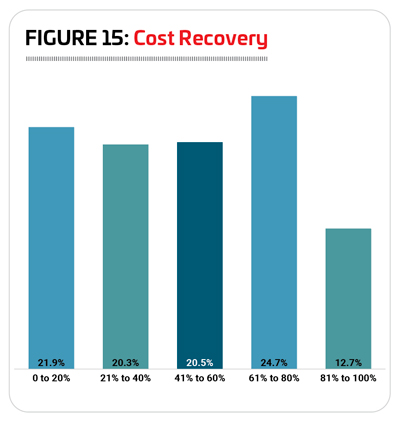 region (up 3.7% to an average of $1,874,00). And Northeastern respondents actually projected their operating expenses would fall 35.8% between 2022 and 2024, to an average of $1,293,000.
When it comes to the type of facility, respondents from colleges and schools reported the highest overall operating costs in 2022. School respondents in 2022 had an average operating expenditure of $4,553,000, 2.2% higher than the average for colleges, $4,457,000. They were followed by parks and Ys, with average operating expenditures in 2022 of $3,102,000 and $2,963,000, respectively. Camps were the next biggest spenders, at $1,601,000, and health clubs and rec centers spent the least on their operating costs, at $1,296,000 and $1,276,000, respectively. (See Figure 14.)
Editor’s Note: You’ll find the highest reported operating cost for 2022, along with median numbers in the individual sections that follow.
Looking forward, respondents from Ys and rec centers projected the steepest increase to their average operating expenditure from 2022 to 2024. Ys are expecting expenses to increase by 36.6%, to an average of $4,048,000, and rec centers projected a 32.7% increase, to an average of $1,693,000. They were followed by camp respondents, who projected a 20.5% increase to their operating costs, to an average of $1,929,000 in 2024, and college respondents, who expect their expenses to climb 11.1% to an average of $4,952,000.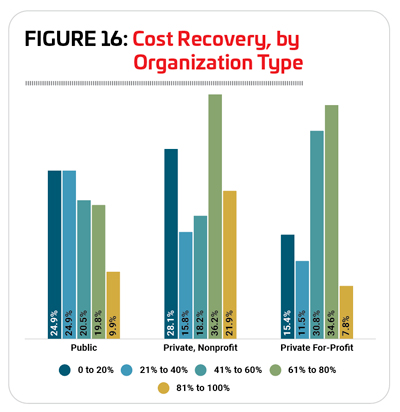
Respondents from health clubs, schools and parks all projected decreases to their average operating costs from 2022 to 2024. Health club respondents predicted a 25.3% decline, to an average of $968,000. Schools expect operating expenses to fall 8.7%, to an average of $4,155,000. And finally, parks projected very little change over the coming two years, expecting their average operating cost to fall 3.7%, to $2,986,000.
When it comes to cost recovery, respondents are relatively equally divided among categories, with around a fifth reporting that they earn back 0 to 20%, 21% to 40%, or 41% to 60% of their revenues. Nearly a quarter (24.7%) said they earn back between 61% and 80% of their costs via revenues. And 12.7% said they earn back between 81% and 100% of their costs via revenues. (See Figure15.)
Considered by organization type, we can see that public organizations are more likely than nonprofits and for-profit organizations to recover a smaller percentage of their operating costs via revenues, as one would expect. For public and governmental organizations, nearly half (49.8%) of respondents said they recover 40% or less of their operating costs via revenues. This compares with 43.2% of nonprofit organizations, and 26.6% of for-profit organizations. On the other hand, nearly three in 10 (29.8%) public organization respondents said they recover 81% or more of their operating costs via revenues. This compares with 58.1% of nonprofit organizations, and 42.4% of for-profit organizations. (See Figure 16.)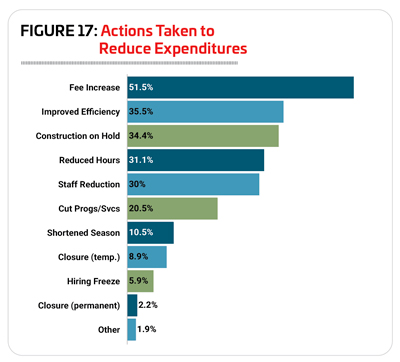
There was very little change in the number of respondents who reported that they had taken some kind of action to lower their operating costs. Some 83.3% of all respondents said they had taken such action, down from 83.8% in 2022 and 90.1% in 2021.
The most common method respondents relied on to improve their margins was to increase fees. More than half (51.5%) of respondents said they had increased their fees. At least three out of 10 also said they had: improved energy efficiency (35.5%); put construction or renovation plans on hold (34.4%); reduced their hours of operation (31.1%); or reduced staff (30%). (See Figure 17.)
After being the respondents most likely to have taken action to reduce their expenses for every year of the survey up until last year, Y respondents took second place this year. Camp respondents were the most likely to report that they had taken action to reduce their costs. In fact, some 88.5% of camp respondents said they had taken such action, down from 90.3% in 2022. They were followed by Ys, with 86.1% reporting they had taken action to reduce their expenses, down from 89.4%. Some 85.9% of college respondents had taken action to reduce their expenses, down from 90.9%. More than eight in 10 (80.4%) health club respondents said they had taken such action, 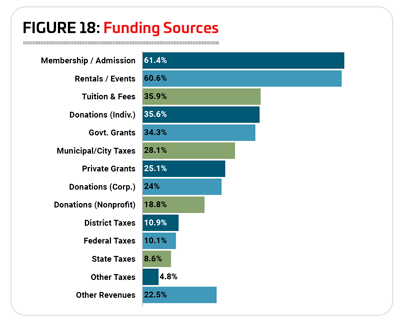 down from 86.7%. And 80.3% of park respondents said they had taken action to reduce their costs, down from 84.1% in 2022.
Only rec centers and schools were more likely to report that they have taken action to reduce their operating costs in 2023 than in 2022. Some 84.9% of rec center respondents said they had done so (up from 79.2% in 2022), and 73.4% of schools had taken action to reduce their costs (up from 63.9%).
Respondents from camps were the most likely to report that they had increased their fees (71.3% of camp respondents had done so), put construction or renovation plans on hold (51.7%), or improved energy efficiency (43.7%) in order to reduce their operating costs.
College respondents were the most likely to report that they had reduced their hours of operation (63.6%), cut programs or services (36.4%) or closed facilities temporarily (4.6%).
Respondents from health clubs were the most likely to report that they had reduced staff (44.6%). Park respondents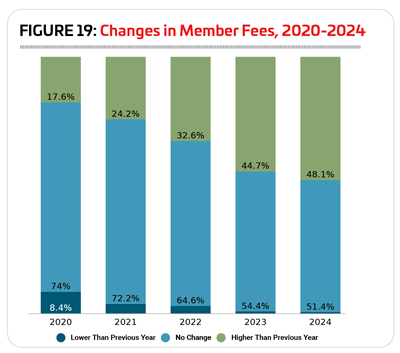 were the most likely to shorten their season of operation (16.5%). And finally, Ys, were the most likely to indicate that they had instituted a hiring freeze (9.7%) or closed facilities permanently (6.9%) in order to reduce their costs.
Asked about the sources of funding for their facilities, the most common responses were nonprofit donations (67.4% of respondents received funding through nonprofit donations), membership and admission fees (61.4%) and revenues from rentals and private events (60.6%). More than three in 10 respondents also said they received funding from tuition and fees (35.9%), private donations from individuals (35.6%), and government grants (34.3%). (See Figure 18.)
Membership & Usage
As in most years, around six in 10 respondents report that they charge a fee for membership or for usage of their facilities. Some 60.5% of respondents in 2023 said they currently charge a fee, representing virtually no change from 2022 (60.7%) and up slightly from 57% in 2021.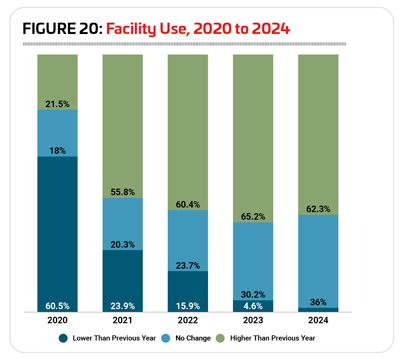
More than nine out of 10 respondents from Ys and health clubs said they charge a fee for membership or usage, with 96.2% of Y respondents and 92% of health club respondents indicating they do so. They were followed by colleges (74.6%), rec centers (64.6%), camps (60.8%) and parks (57.7%). Schools were the least likely to charge a membership or usage fee, with 21.5% of respondents indicating they do so.
Given the inflationary pressures of the past couple of years, it should come as no surprise that respondents are slightly more likely to raise their rates. In 2022, nearly two-thirds (64.6%) of respondents left their fees unchanged, but about a third (32.6%) raised their fees, up from 24.2% in 2021. And looking forward, 44.7% of respondents said they expect to increase their fees in 2023, and nearly half (48.1%) expect to raise their fees in 2024. (See Figure 19.)
Camp respondents were by far the most likely to report that they had increased their fees in 2022. More than half (54.1%) of camp respondents said they had done so. They were followed by rec centers (35.9% of rec center respondents said they had increased their fees) and health clubs (33.3%). Schools were the least likely to have increased their fees; just 18.2% of school respondents said they had done so in 2022.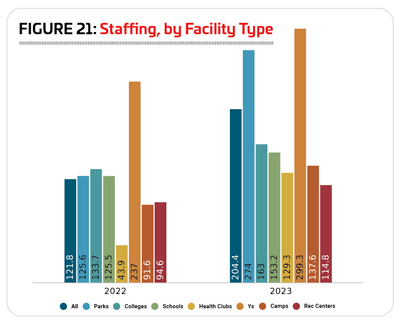
Camp respondents were also the most likely to report that they planned to increase their fees in 2023. Some 64.5% of camp respondents said they will increase their fees this year. They were followed by rec centers (46.2%) and Ys (44.4%). And again, schools were the least likely to be planning a fee increase, with just 17.4% of the respondents indicating that they planned to do so.
The pandemic year, 2020, obviously had a negative impact on the number of people using facilities, with respondents much more likely than in normal years to report that the number of people using their facilities had decreased. In fact, in 2020, 60.5% of respondents said the number of people using their facilities declined. Things began to return to normal in 2021, with just 23.9% reporting a decrease. And in 2022, while 15.9% of respondents still said usage of their facilities was dropping, the majority of respondents—60.4%—said usage of their facilities had increased. (See Figure 20.)
Looking ahead to this year and next, even more respondents are expecting attendance at their facilities to rise. In 2023, 65.2% of respondents said they expect an increase in the number of people using their facilities, while 30.2% expect no change and 4.6% expect a decrease. And in 2024, 62.3% expect the number of people using their facilities to increase, while 36% expect no change and 1.7% expect a decrease.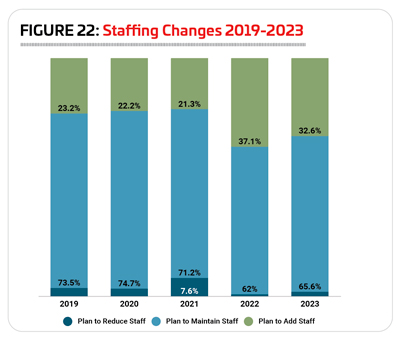
Respondents from Ys were by far the most likely to report that the number of people using their facilities increased in 2022. In fact, 84.4% of Ys said usage at their facilities increased last year. They were followed by parks, as 67.8% of park respondents reported an increase in usage, and health clubs (66.2%). Most likely to report a decrease in the number of people using their facilities in 2022 were schools, where 24.3% of respondents saw a decline in numbers.
In 2023, Ys again are the most likely to expect the number of people using their facilities to increase. Some 85.9% of Ys predicted an increase for 2023. They were followed by rec centers (79.7%) and health clubs (75%). Again, schools were the most likely to report that they expected usage of their facilities to decline, though just 10.3% of school respondents said that they expected the number of people using their facilities to drop.
Ys maintained their position as the most likely to expect increasing usage for the year 2024, with 84.1% of respondents reporting that they expected more people to use their facilities in 2024 than in 2023. They were followed by rec centers (70.5%) and health clubs (70.3%).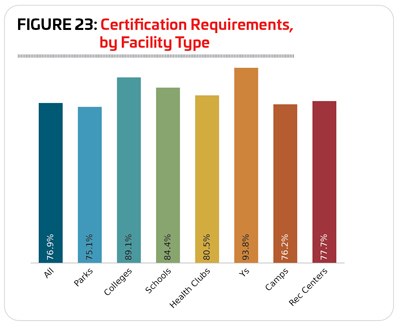
Staffing
On average, respondents to the Industry Report survey employ 204.4 workers, up from 121.8 in 2022 and 121.4 in 2021. This includes 36 full-time workers (up from 25.7), 52.8 part-time workers (up from 43.4), 47.7 seasonal workers (virtually unchanged, from 47.2 in 2022), and 67.9 volunteers (up from 40).
As always, Ys employed the largest number of people, with an average of 299.3 employees of all kinds, up from 237 in 2022. They were followed by parks, with an average of 274 employees, up from 125.6; and colleges, with an average of 163 total employees, up from 133.7. (See Figure 21.)
After 2022 saw a much higher than normal number of respondents plan to add staff at their facilities, 2023 brings that number back down, though not to historical averages. In 2022, 37.1% of respondents said they planned to increase their staff. In 2023, nearly a third (32.6%) of respondents said they had plans to increase their staff. Nearly two-thirds (65.6%) said they plan to maintain current staffing levels, and just 1.8% of respondents had plans to reduce staff. (See Figure 22.)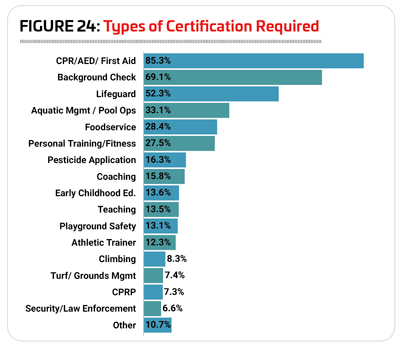
Certifications, from career-specific credentials like athletic trainer or Certified Park & Recreation Professional (CPRP) certification to broader certifications like CPR/AED/First Aid training allow professionals to prove their competency through testing and continuing education requirements, and they allow facility directors to weed through potential employees to find the folks most committed to maintaining their knowledge in the field. That said, the number of respondents to the Industry Report survey who require certification of any kind has been falling in recent years. In 2023, just over three-quarters (76.9%) of respondents said they currently require certification of some kind for at least some of their staff. This is down from 78.7% in 2022, 81.3% in 2021, 82.1% in 2020 and 83.2% in 2019.
Respondents from Ys were the most likely to require certification for some of their staff. Some 93.8% of Y respondents said they currently require certifications, up from 87.2% in 2022, but still below the number reported for 2021, 95.6%. They were followed by colleges (89.1% require certification), schools (84.4%), and health clubs (80.5%). Parks were the least likely to require certification of some of their staff members, though more than three-quarters (75.1%) said they do so. (See Figure 23.)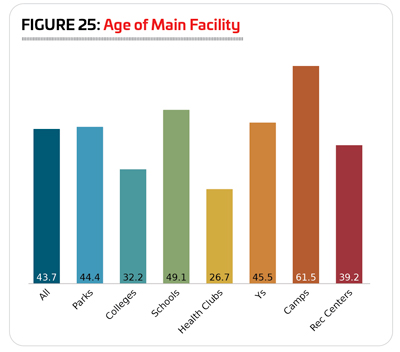
As usual, the most commonly required certification is CPR/AED/First Aid training. Some 85.3% of respondents who require any certification require this one. More than half of respondents who require any certification said they look for a background check (69.1%) or lifeguard certification (52.3%). More than a quarter require aquatic management or pool operations certification (33.1%), foodservice certification (28.4%), or personal training and fitness certification (27.5%). (See Figure 24.)
Respondents who include swimming pools or other aquatic elements at their facilities are, not surprisingly, much more likely to look for lifeguard and aquatic management or pool operations certifications for some of their staff members. While 52.3% of all respondents who require certification said they ask some staff members to achieve lifeguard certification, for those with aquatic facilities, that number jumps to 85.9%. And while 33.1% of all respondents require aquatic management and pool operations certifications, 56.5% of those with aquatic facilities do so.
Likewise, different types of facilities are much more likely to require certain types of certification, depending on their typical operations. Ys were more likely than others to require CPR/AED/First Aid certification (in fact, 100% of Ys that require any certification look for this one), background checks (87.9%), lifeguard certification (67.6%), aquatic management or pool operations 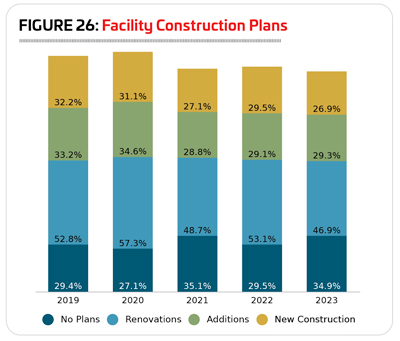 certification (43.2%), and childcare or early childhood education certification (50%). Camp respondents were the most likely to require foodservice certification (65.8%), climbing certification (36.7%) and security or law enforcement certification (12.7%). Respondents from parks were the most likely to require pesticide application certification (34.4%), playground safety certification (33.3%), turf and grounds management certification (10.4%) and CPRP certification (16.3%). Respondents from health clubs were the most likely to require personal trainer or fitness certifications (69.5%) as well as athletic trainer certification (25.4%). And finally, school respondents were the most likely to report that they require coaching certification (46.2%) or teaching certification (60.4%).
Facilities & Construction Plans
Despite the way new facilities seem to crop up every year, respondents’ flagship or main facilities have been trending older. In 2013, when we first asked respondents about the age of their flagship facility, the average was 27.5 years. In 2023, respondents’ flagship facilities average 43.7 years, up from 37.3 in 2022.
In fact, more than half of respondents (50.9%) said their flagship facility was at least 41 years old, with most of those—34.8% of all respondents—reporting that their main facility is at least 50 years old. Just 9.2% of respondents said their flagship facility had been around for 10 years or less. Some 18.2% have flagship facilities that are 21 to 30 years old, and 8.2% have flagship facilities that are 31 to 40 years old.
As usual, camps had the oldest facilities, while health 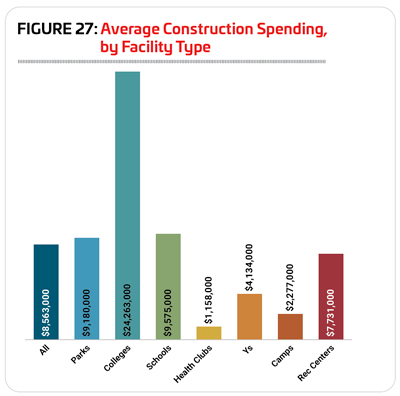 clubs and colleges had the newest facilities. Camp respondents reported the average age of their facilities at 61.5 years, up from 53 in 2022. Health club respondents, on the other hand, reported an average facility age of 26.7 years, up from 20.7 years, while college respondents reported an average age of 32.2 for their main facility, up from 25.5. Falling in the middle were rec centers (39.2 years on average, up from 35.1), parks (44.4 years, up from 35.5), Ys (45.5 years, up from 43.6), and schools (49.1 years, up from 37.6). (See Figure 25.)
After a fairly steady climb from 2013 to 2020, the number of respondents who report that they have plans for new construction, additions or renovations at their facilities has been more volatile for the past few years—no surprise, given inflationary pressures, staffing difficulties and construction costs. 2023 marked a return to numbers similar to 2021, with a little less than two-thirds (65.1%) of respondents in 2023 indicating they have plans for construction, very similar to the 64.9% reported in 2021.
In 2023, some 46.9% of respondents said they had plans for renovations at their existing facilities, down from 53.1% in 2022, and 48.7% in 2021. Another 29.3% were planning additions at their existing facilities, up slightly from 29.1%, and 26.9% were planning new construction, down from 29.5% in 2022. (See Figure 26.)
Respondents from camps and parks were the most likely to be planning construction in 2023. Some 74.5% of camp respondents said they had such plans, down from 92.1% in 2022, and 77% in 2021. And 74.3% of park respondents said they had plans for construction, down from 82% in 2022, but still above the 71.8% in 2021. More than six in 10 respondents from Ys (67.1%, down from 74.5% in 2022), and colleges (60.4%, up from 56.1%) were planning construction. Slightly fewer respondents from rec centers (58.1%, up from 55.4%), schools (53.5%, down from 57.1%) and health clubs (42.3%, down from 50%) in 2023 said they had plans for construction over the next few years.
Just as they are the most likely to be planning any kind of construction, camp and park respondents were also the most likely to be planning the different construction types covered by the survey. Some 58.8% of camp respondents said they were planning renovations, along with 54% of park respondents. Slightly fewer camp respondents, 43.1%, were planning new construction, along with 34.3% of park respondents. And 39.2% of camp respondents were planning additions, along with 36.7% of park respondents.
Before we dive into construction budgets, note that changes to this year’s survey instrument allowed respondents to fill in their exact dollar amount, rather than selecting from a range. Because of this, the numbers skew higher than in previous surveys, as the current instrument takes into account some of the highest-cost construction projects. Just consider the cost of a college stadium renovation, for example. After all, Texas A&M’s renovation of Kyle Field was a $450 million project a decade ago. Because of this, in addition to the average we usually report, we’ll let you know the highest number reported, along with the median amount. (Need a refresher? The median is the number that falls in the exact center of the distribution, so in this case, half of respondents are spending more than that amount, and half are spending less.)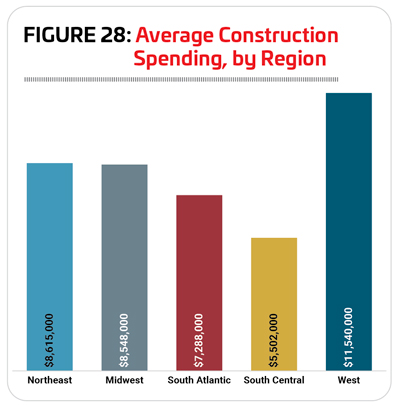
The average budget planned for construction for respondents in 2023 was $8,563,000, but some of the highest-cost projects are pulling that number upward. The median amount (the number that falls at the exact center of the distribution) planned for construction in 2023 is $1 million.
The highest spenders by a significant margin are colleges and universities, where the average amount planned for construction is $24,263,000. The maximum budget in this year’s survey for colleges and universities was $350 million, pulling the average up. The median construction cost for college and university respondents in 2023 was just $2 million. (See Figure 27.)
Schools were the next biggest spenders on construction, with an average of $9,575,000. The priciest school construction planned was $50 million. The median construction cost for schools and school districts was $2.5 million.
Park respondents fell third, with an average construction budget of $9,180,000 in 2023. The most expensive parks project in the survey was $275,000,000, and the median construction cost was $1 million.
Rec center respondents were planning to spend an average of $7,731,000 on their construction plans in 2023. The highest-cost project was $50 million, and the median construction cost was $1 million.
Y respondents were planning to spend an average of 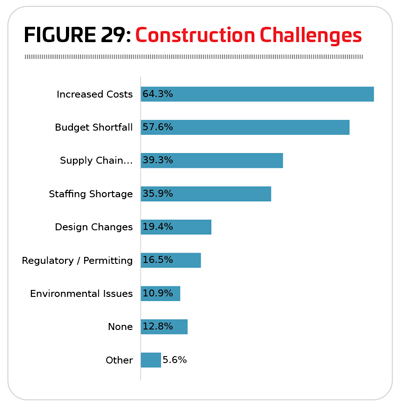 $4,134,000 on their construction plans in 2023, with a top cost of $25 million and a median cost of $1,725,000.
Camp respondents were planning to spend an average of $2,277,000, with a top cost of $27 million, and a median cost of $300,000.
Health clubs were planning to spend the smallest amount on their construction plans, with an average of $1,158,000, a top cost of $10 million, and a median cost of just $250,000.
Considered by region, respondents in the West were the biggest spenders. This region’s average construction spending planned in 2023 was $11,540,000—34.8% higher than the average for all respondents. The highest construction budget among Western respondents was $275 million, and the median cost was $1.7 million. (See Figure 28.)
The West was followed by the Northeast, with an average construction budget in 2023 of $8,615,000. The highest amount planned for construction in the Northeast was $200 million, and the median cost was $1 million.
Respondents in the Midwest had an average construction budget of $8,548,000. The highest amount planned was $350 million, and the median cost was $850,000.
South Atlantic respondents were planning an average construction budget of $7,288,000. The highest amount planned was $150 million, and the median cost was $500,000.
Finally, South Central respondents had the lowest 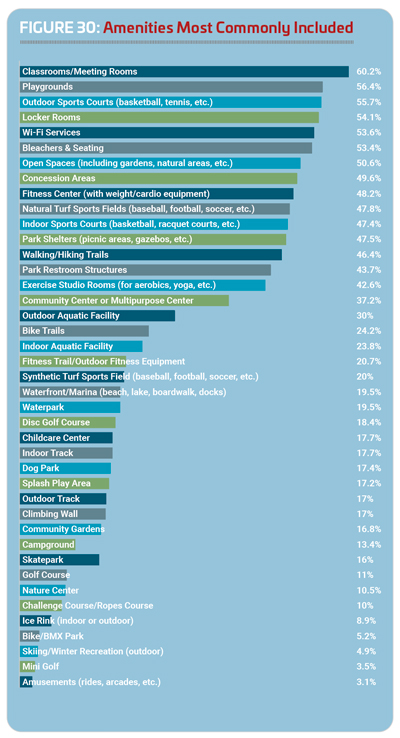 average construction budget in 2023, at $5,502,000. The highest amount planned was $50 million, and the median cost was $850,000.
Asked about challenges or setbacks they’ve faced in their construction and renovation planning process, just 12.8% of respondents said they’d experienced none. The biggest challenge was the increase in construction costs, with 64.3% of respondents indicating increased costs have had an impact on their construction projects. The next most common challenges were: (likely related) budget shortfalls (57.6%); supply chain disruptions (39.3%), and staffing shortages (35.9%). (See Figure 29.)
The top amenities included in respondents’ facilities in 2022 include: classrooms and meeting rooms (60.2% of respondents have them); playgrounds (56.4%); outdoor sports courts for sports like basketball, tennis and pickleball (55.7%); locker rooms (54.1%); Wi-Fi services (53.6%); bleachers and seating (53.4%); open spaces including gardens and natural areas (50.6%); concession areas (49.6%); fitness centers (48.2%); and natural turf sports fields for sports like football, baseball and soccer (47.8%). (See Figure 30.)
The number of respondents who claim to have specific amenities tends to vary slightly from year to year. That said, some of the amenities that have held top positions on the planning-to-add list for the past five years or more have shown some growth. Usually at the top of that list, splash play was up 1.6 percentage points. Dog parks were up 4.2 points, and fitness trails and outdoor fitness equipment were up 2.7. Waterparks saw the most significant jump, up 12.2 points from 2022. Other amenities that saw an increase of at least 1.5 points include: skateparks (up 3.3); outdoor aquatic facilities (up 3); park restroom structures (up 2.5); walking and hiking trails (up 1.9); park shelters (up 1.6); and community or multipurpose centers (up 1.6).
Respondents from parks were more likely than other respondents to include: playgrounds (83.7% of park respondents had playgrounds); park shelters (80.7%); park restroom structures (79.3%); outdoor sports courts (73.6%); natural turf sports fields (69.6%); community or multipurpose centers (58.7%); bike trails (45.7%); dog parks (40.5%); fitness trails and outdoor fitness equipment (36.4%); skateparks (35.3%) waterparks (34.2%); community gardens (30.7%); splash play areas (30.2%); golf courses (19.3%); ice rinks (15.2%); and bike/BMX parks (10.6%).
College and university respondents were the most likely to include: locker rooms (94.1%); indoor sports courts (84.9%); indoor aquatic facilities (51.3%); synthetic turf sports fields (47.9%); and indoor tracks (56.3%).
Respondents from schools were the most likely to include: bleachers and seating (79.8%); concessions (67.3%); and outdoor tracks (56.7%).
Health club respondents were the most likely to include fitness centers (87.5%) and exercise studio rooms (76.4%).
Respondents from Ys were the most likely to include classrooms and meeting rooms (79.7%) and childcare centers (57%).
Finally, camp respondents were the most likely to include: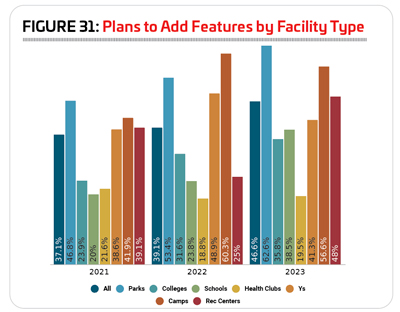 walking and hiking trails (76.4%); open spaces such as gardens or natural areas (75.5%); Wi-Fi services (66%); campgrounds (63.2%); waterfronts and marinas (51.9%); outdoor aquatic facilities (42.5%); climbing walls (35.8%); challenge courses or ropes courses (33%); disc golf courses (30.2%); nature centers (26.4%); mini golf courses (12.3%); skiing and winter recreation areas (7.5%); and amusements and arcades (3.8%).
This year saw a significant jump in the number of respondents who have plans to add features at their facilities over the next few years. In 2023, 46.6% said they had such plans, up from 39.1% in 2022, and 37.1% in 2021.
Only respondents from Ys and camps were less likely in 2023 than in 2022 to have plans to add features. Some 41.3% of Ys and 56.6% of camps in 2023 said they were planning to add features, down from 48.9% and 60.3%, respectively, in 2022.
The greatest increase from 2021 to 2022 in the number of respondents planning to add features at their facilities was found among rec center respondents. More than half of rec center respondents in 2023 (56.6%) said they had plans to add features at their facilities, an increase of 23 percentage points. The next largest jump was reported by school respondents, 38.5% of whom had plans in 2023 to add features at their facilities, an increase of 14.7 percentage points over 2022. Parks were the most likely to have plans in 2023 to add features at their facilities over the next three years, with 62.6% indicating they had such plans, up 9.2 percentage points from 2022. Smaller increases were reported by colleges (up 4.2 points to 35.8%), and health clubs reported virtually no change, with a 0.7-point increase to 19.5%. (See Figure 31.)
The top planned features for all facility types include:
1. Splash play areas (21.1% of respondents with plans to add features are planning to add splash play)
2. Park shelters (18.9%)
3. Playgrounds (17.8%)
4. Synthetic turf sports fields (17.6%)
5. Park restroom structures (17.4%)
6. Outdoor sports courts (15.1%)
7. Dog parks (13.2%)
8. Walking/hiking trails (12.9%)
9. Fitness trails and outdoor fitness equipment (12.7%)
10. Bike trails (12.5%)
11. Classrooms and meeting rooms (12.5%)
Programming Trends
The vast majority of respondents report that they provide programming of one kind or another at their facilities. In 2023, 95.8% of respondents said they currently provide programming options to their members and communities, down slightly from 96.4% in 2022, and 97.6% in 2021.
The top 10 most commonly offered programs include: 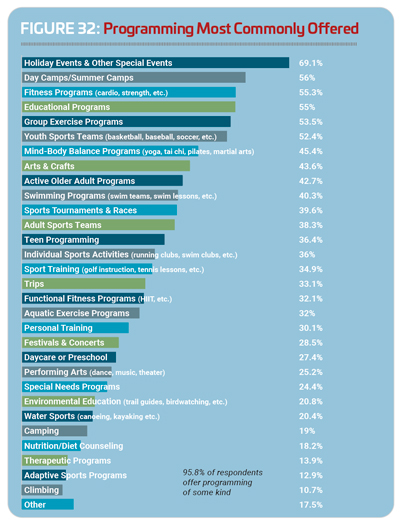 holiday events and other special events (69.1% of respondents host holiday activities and special events); day camps and summer camps (56%); fitness programs (55.3%); educational programs (55%); group exercise programs (53.5%); youth sports teams (52.4%); mind-body balance programs like yoga or tai chi (45.4%); arts and crafts (43.6%); programs for active older adults (42.7%); swimming programs such as learn-to-swim or swim teams (40.3%); and sports tournaments and races (39.6%). (See Figure 32.)
Many types of programming were offered by more respondents in 2023 than in 2022. Program types that saw growth of three or more percentage points include: holiday events and other special events (up 11.9 percentage points from 2022); trips (up 9.3); individual sports activities like running clubs or swim clubs (up 5.6); water sports such as canoeing and kayaking (up 5.6); programming for active older adults (up 4.8); festivals and concerts (up 4.3); educational programs (up 3.8); and daycare or preschool programs (up 3.2).
Y respondents were the most likely to offer programming, with a full 100% indicating they provide some type of programming at their facilities. They were followed by health clubs (98.6%), colleges and universities (98.2%), parks (98%), rec centers (97.8%), and schools (97%). Camp respondents were the least likely to offer programming at their facilities, though the vast majority (94.2%) said they do.
Respondents from parks were the most likely to offer holiday events and other special events, arts and crafts programs, programs for active older adults, sport training like golf or tennis lessons, and festivals and concerts.
College respondents were the most likely to offer sports tournaments and races, adult sports teams, and individual sports activities like running clubs or swim clubs.
School respondents were the most likely to provide youth sports programming.
Respondents from health clubs were the most likely to offer fitness programs, group fitness programs, functional fitness programs, personal training, nutrition and diet counseling, and therapeutic programs.
Respondents from Ys were the most likely to provide day camps and summer camps, educational programs, mind-body balance programs like yoga and tai chi, swimming programs, teen programming, trips, aquatic exercise programs, daycare and preschool, special needs programming, and adaptive sports programming.
Camp respondents were the most likely to offer environmental education, water sports like canoeing or kayaking, camping, and climbing programs.
Finally, rec center respondents were more likely than others to provide performing arts programs like theater and music.
Some 41.5% of respondents in 2023 said they had plans to add more programming options to their facilities’ lineup over the next three years. This is up substantially from 2022, when 35.7% had such plans.
The 10 more commonly planned program additions in 2023 were:
1. Educational programs (24.8%, down from 25.9% in 2022)
2. Mind-body balance programs (23.3%, down from 29.9%)
3. Teen programming (23.3%, up from 21.9%)
4. Environmental education (22.2%, up from 20.9%)
5. Group exercise programs (22%, down from 27.9%)
6. Fitness programs (20.3%, down from 27.9%)
7. Arts and crafts (19.2%, down from 21.9%)
8. Programs for active older adults (19%, down from 19.4%)
9. Special needs programs (18.8%, up from 17.4%)
10. Adult sports teams (18.3%, down from 19.9%)
New to the list this year are programs for active older adults, special 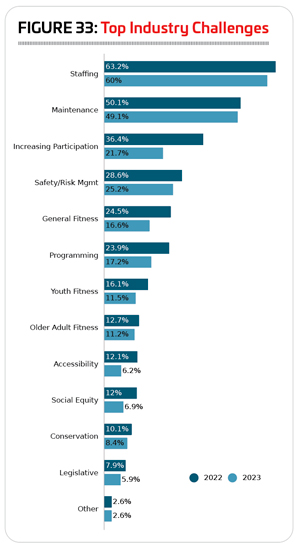 needs programs, and adult sports teams. They replace functional fitness, performing arts programs, and holidays and other special events.
More than half of respondents from rec centers, Ys and parks said they had pans to add programs over the next three years. Some 52.5% of rec center respondents, 51.9% of Ys, and 50.6% of parks said they were planning to add programs. More than one-third of respondents from colleges (36.8%) and camps (33.7%) said they planned to add programs. Slightly fewer (31.1%) health club respondents had such plans, and schools were the least likely to be planning to expand their programming lineup, with 20.8% of school respondents reporting they planned to do so.
When asked about various initiatives their organizations are involved in these 10 responses were the most common:
1. Wellness initiatives (45.7%, down from 47.5% in 2022)
2. Inclusion initiatives for those with physical disabilities (39.7%, no change)
3. Inclusion initiatives for those with developmental disabilities (35%, virtually unchanged from 35.4%)
4. Outreach to economically disadvantaged populations (34.3%, down from 39.7%)
5. Outreach to underserved populations (32.9%, down from 41.4%)
6. Programs to connect people with nature (30.5%, up from 28.9%)
7. Outreach to minority populations (30.2%, down from 35.7%)
8. Disaster recovery assistance (24.5%, up from 8.7%)
9. Initiatives to reduce hunger and improve nutrition (21.6%, up from 18.8%)
10. Resource conservation and green initiatives (20.3%, down from 25.1%)
Staffing Is Still Top Industry Challenge
Finding ways to do more with less, stretching budget dollars to ensure facilities are up-to-date and meeting the needs of their members or visitors, is always the top challenge facing recreation sports and fitness facilities. But over the past two years, a related issue—staffing troubles—has dominated the list of top industry challenges. While slightly fewer respondents named staffing their top challenge in 2023 than in 2022, it was still the biggest issue. Some 60% of respondents in 2023 said staffing was a top industry challenge, down from 63.2% in 2022. (See Figure 33.)
After staffing, equipment and facility maintenance was the next most common concern, with 49.1% calling it a top issue. This is down just slightly from 50.1% in 2022. It was followed by: safety and risk management (25.2%, down from 28.6%); marketing and increasing participation (21.7%, down from 36.4%); and creating new and innovative programming (17.2%, down from 23.9%). RM
