


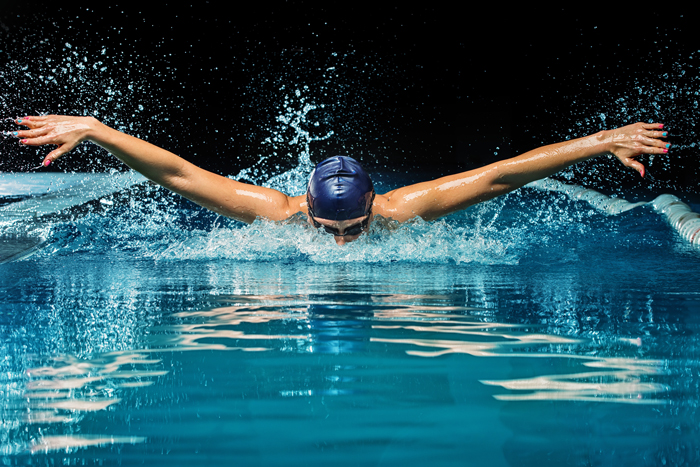
 In this section of the Industry Report, we’ll dive into the data provided by those survey respondents whose facilities include aquatic elements. This includes any respondent who has at least one indoor or outdoor pool, splash play area, waterpark or hot tub.
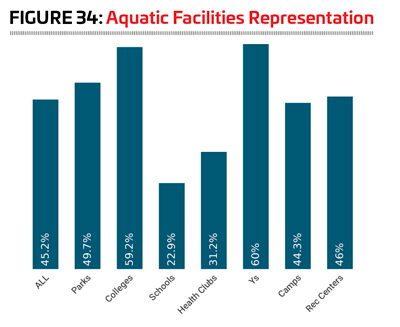
Fewer respondents in 2023 included aquatic features in their facilities than in 2022. Some 45.2% of respondents in 2023 said their facilities include aquatics, down from 49.9% in 2022, and 54.6% in 2021. More than half (54.8%) of respondents did not include aquatics.
Respondents from Ys, and those from colleges and universities were the most likely to include aquatics at their facilities. Some 60% of Y respondents and 59.2% of college respondents said their facilities included aquatics. They were followed by parks (49.7%), rec centers (46%), and camps (44.3%). (See Figure 34.)
Respondents who had aquatics at their facilities were most likely to have an outdoor pool. Some 64.2% of aquatic respondents said they had at least one outdoor pool, up from 60.4% in 2022. They were followed by indoor pools, with 51.3% of aquatic respondents indicating they have at least one indoor pool, down from 62.2% in 2022. Another 39.5% of respondents said they had splash play areas, down from 42.3% in 2022. Around three in 10 (29.2%) have a hot tub, spa or whirlpool, down from 35.7%. And 11.8% of aquatic respondents said they currently have a waterpark, down from 15.7% in 2022. (See Figure 35.)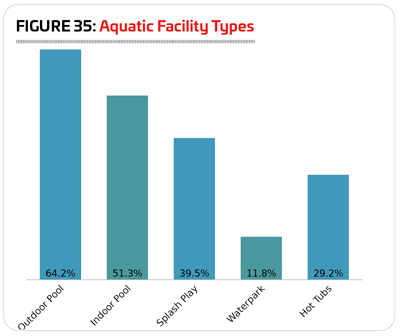
Outdoor pools were most likely to be found among facilities located in the South Atlantic region. In fact, 77.9% of aquatic respondents from the South Atlantic states said they currently have at least one outdoor pool. They were followed by the West (67.9%), the South Central region (63.6%), the Northeast (60.5%) and the Midwest (55%).
Predictably, indoor aquatic facilities were more common in colder regions. They were most commonly found among respondents from the Midwest, where 60% said they currently have indoor pools. They were followed by the Northeast, where 53.1% have indoor aquatic facilities. Less than half of respondents in the South Central region (49.1%), the West (47.2%) and the South Atlantic states (40.3%) said they currently have at least one indoor aquatic
facility.
Splash play areas were more common in warmer regions, with aquatic respondents in the West being most likely to include splash play. Some 46.2% of Western respondents said they have at least one splash play area. They were followed by the South Atlantic, where 43.6% have splash play, the South Central region (43.6%) and the Midwest (36.4%). Respondents in the Northeast were the least likely to have splash play areas, with 29.6% indicating they do.
Hot tubs, spas and whirlpools were most common for respondents in the West, where 36.8% of aquatic respondents said they currently have at least one. They were followed by the Midwest (32.1%), the South Atlantic region (31.2%) and the South Central region (25.5%). Just 16% of respondents in the Northeast said they currently have at least one hut tub, spa or whirlpool.
Waterparks were most common in the South Central region, where nearly a quarter (23.6%) of aquatic respondents said they currently have at least one waterpark. They were followed by the Midwest, where 17.1% of aquatic respondents have a waterpark. Far fewer respondents in the West (8.5%), South Atlantic (7.8%) and Northeast (3.7%) said they had a waterpark.
Just as you’d expect to find more indoor pools in colder climates and more splash play in the hotter south, different types of owners are more likely to build specific facility types. For example, you’d likely expect splash play areas to be mostly built by parks, whereas indoor pools might be more common among Ys and colleges.
Take outdoor pools, for beginners. Outdoor aquatic facilities are most common by far at camps, where 85.1% of aquatic respondents include outdoor aquatics, and at parks, with 84.9% of aquatic respondents including them. They were followed by rec centers, where 68.1% of aquatic respondents currently have an outdoor pool. They were much less common at Ys (43.8%), health clubs (37.5%), schools (28%), and colleges (22.5%).
On the other hand, indoor aquatic facilities were very common for aquatic respondents from health clubs, Ys, colleges and schools. Some 87.5% of aquatic respondents from health clubs, 83.3% from Ys, 83.1% from colleges and 80% from schools said they currently have at least one indoor aquatic facility. Far fewer respondents from rec centers (53.6%), parks (36.8%) and camps (6.4%) currently include indoor aquatics.
Splash play areas were most commonly found among 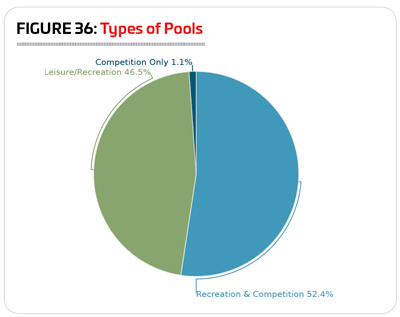 park respondents’ facilities, with 63.2% of park respondents who have aquatics indicating that they have at least one splash play area. They were followed by rec centers (53.6%) and Ys (27.1%).
Respondents from health clubs were by far the most likely to include hot tubs, spas and whirlpools. Some 70.8% of health club respondents with aquatics said they currently have at least one hot tub. They were followed by Ys (43.8%), colleges (36.6%) and rec centers (33.3%).
Finally, waterparks were most common for park respondents. Some 17.3% of aquatic respondents from park districts and departments said they currently have at least one waterpark.
As is generally the case, the vast majority of aquatic facilities are used for leisure activities and recreation, with some mixing in competitive activities like swim meets or water polo. More than half (52.4%) said their aquatic facilities offer a combination of recreational and competitive programming. Another 46.5% of aquatic respondents said their aquatic facilities are used for recreational programming and leisure activities. And just 1.1% of respondents said their pools are used for competition only. (See Figure 36.)
All of the competition-only facilities were to be found at schools and colleges. Some 12.5% of aquatic respondents from schools and 4.2% of those from colleges said their pools were only used for competition.
Ys were the most likely to combine recreational and competitive uses for their aquatic facilities, with 73.5% of Y respondents with aquatics indicating their facilities were designed for dual uses. They were followed by schools (70.8%) and colleges (67.6%).
Camps were by far the most likely to indicate that their aquatic facilities are used for recreation only. Some 93.5% of camp respondents with aquatics said their facilities were for recreation and leisure. They were followed, distantly, by health clubs (50%) and rec centers (49.3%).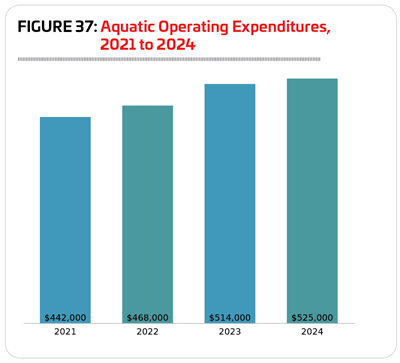
Pools & Budgets
In 2022, respondents whose facilities include aquatics spent 93% more on their overall operating budgets than those who have no aquatic elements at their facilities. Aquatic respondents had an overall operating budget in 2022 of $3,791,000, compared with $1,964,000 for non-aquatic respondents.
That said, over the next two years, aquatic respondents expected their overall operating cost to remain virtually unchanged, increasing just 1.7% to an average of $3,857,000, while non-aquatic respondents projected a more substantial 27.3% increase, to an average of $2,501,000.
When it comes to their operating costs for the aquatic side of their operations, respondents saw a 5.9% increase from 2021 to 2022, from an average aquatic operating cost of $442,000 to an average of $468,000. Looking forward, they expect their aquatic costs to increase by 12.2% between 2022 and 2024, to an average of $525,000. (See Figure 37.)
In a change from the norm, respondents from Ys for the first time did not report the highest average aquatic operating cost. In 2022, park respondents were the biggest spenders on aquatic operations, with an average budget of $800,000. This reflects a high of $17 million, and the median cost for park respondents’ aquatic operations was $190,000. Parks were followed by health clubs, with an average aquatic operating cost of $637,000, reflecting a high of $3 million, and a median of just $150,000; Ys, with an average of $481,000, a high of 3.4 million and a median of $215,000; and rec centers, with an average of $381,000, a high of $2.1 million and a median of $200,000.
Respondents from colleges, schools and camps had lower aquatic operating costs. College respondents with aquatics spent an average of $160,000 on their aquatic operations in 2022, with a high of $2 million and a median of $65,000. School respondents had an average aquatic operating budget of $155,000, with a high of $970,000 and a median of $70,000. Finally, camps had the smallest aquatic operating budgets, with an average of $67,000 in 2022, a high of $900,000 and a median of just $15,000.
Though they have the smallest aquatic operating budgets, respondents from camps projected the highest percentage increase to their aquatic operating budget between 2022 and 2024. The average for camps is projected to increase by 88.1%, from $67,000 in 2022 to $126,000 in 2024.
Respondents from rec centers, schools and Ys projected the next greatest increases, with rec center aquatic operating costs projected to rise 26.5%, from $381,000 in 2022 to $482,000 in 2024, school budgets up 21.9%, from $155,000 to $189,000, and Y budgets up 21.2%, from $481,000 to $583,000.
Parks and colleges projected the smallest increases, with aquatic operating budgets for park respondents increasing 6.9%, from $800,000 in 2022 to $855,000 in 2024, and college respondents’ budgets increasing 5%, from $160,000 to $168,000. Health club respondents actually projected a decrease, predicting that their aquatic operating budgets would fall by 3.5%, from $637,000 in 2022 to $615,000 in 2024.
Aquatic facility revenues are still recovering following the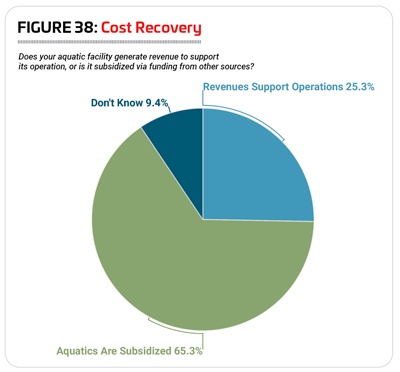 dramatic impact of the coronavirus pandemic. In 2020, 61.4% of aquatic respondents’ revenues dropped, and in 2021, more than a quarter (25.7%) reported a decrease. From 2021 to 2022, however, 44.6% of aquatic respondents said their aquatic revenues increased, while 37.7% said they remained the same and 17.7% said they saw their aquatic revenues decrease. Most likely to report an increase for 2022 were rec centers, with 61.7% indicating their aquatic revenues had increased. They were followed by Ys and parks, where 45.2% of aquatic respondents saw their aquatic revenues rise.
In 2023, more than half (50.5%) of aquatic respondents said they expect their aquatic revenues to increase. Another 42.9% expect no change, and just 6.6% are expecting aquatic revenues to decline. Respondents from health clubs were most likely to expect an increase, with well over three-quarters (78.9%) projecting higher aquatic revenues in 2023 than in 2022. They were followed by rec centers (62.3%) and Ys (54.8%).
Looking forward, 54.8% of aquatic respondents said they expect their aquatic revenues to be higher in 2024, while 41.6% are expecting no change, and 3.6% expect a decrease.
2023 saw no change to the number of aquatic respondents who report that their aquatic operations are supported by their aquatic revenues. Just over a quarter (25.3%) of aquatic respondents said their aquatic facilities and programs generate the revenues to support their operations, representing no change from 2022, and up from 19.5% in 2021. Another 65.3% said their aquatic facilities are subsidized via funding from other sources, down from 68.5%, with the difference joining the “I don’t knows” at 9.4%. (See Figure 38.)
Aquatic respondents from Ys, rec centers and health clubs were the most likely to report that their aquatic costs are paid for via aquatic revenues. Some 45.8% of Y respondents, 35.8% of rec center respondents and 29.2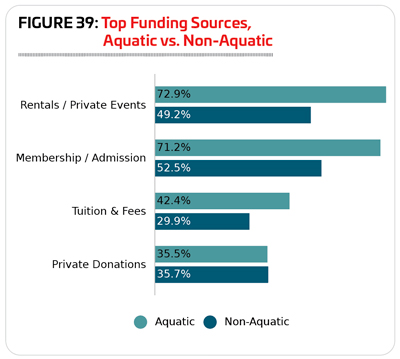 % of health club respondents said their aquatic revenues covered their aquatic costs.
On the other side of the spectrum, college respondents were the most likely to report that their aquatic operating costs are subsidized via funding from other sources. More than three-quarters (76.8%) of college respondents with aquatics said those operations were subsidized with funding from other sources. They were followed by camps (72.1%) and parks (69.3%).
The most common source of funding for aquatic facilities in 2023 was rentals and private events. Some 72.9% of aquatic respondents said that money earned from rentals and private events was a source of revenue for their facilities. This compares with less than half (49.2%) of non-aquatic facilities. Other common sources of funding for aquatic facilities included membership and admission fees (71.2% vs. 52.5% of non-aquatic respondents), tuition and fees (42.4% vs. 29.9%), and private donations from individuals (35.5%). (See Figure 39.)
More than a quarter of aquatic facilities also received funding from: government grants (33%); city/municipal taxes (29.3%); and private corporate donations 25.1%).
Respondents with aquatic facilities were more likely than those without aquatics to report that they had taken action to reduce their expenditures over the past few years. Nearly nine in 10 (87.1%) aquatic respondents said they had taken such action (down from 90.1% in 2022, and 93.3% in 2021), compared with 79.8% of non-aquatic respondents (up from 77.4%).
The most common ways aquatic respondents sought to 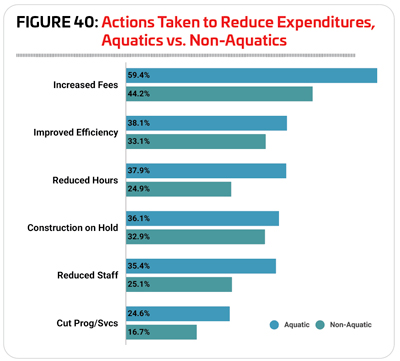 reduce their expenses were: increasing their fees (59.4%, compared with 44.2% of non-aquatic respondents); improving energy efficiency (38.1% vs. 33.1%); reducing their hours of operation (37.9% vs. 24.9%); putting construction or renovation plans on hold (36.1% vs. 32.9%); staff reductions (35.4% vs. 25.1%); and cutting programming or services (24.6% vs. 16.7%). (See Figure 40.)
Programming
A majority of aquatic respondents, 86.9%, said they currently provide aquatic programming at their facilities, down from 95.5% in 2022. This includes everything from learn-to-swim and water safety to aquatic exercise programs, water polo and more. A full 100% of aquatic respondents from Ys said they currently include aquatic programming at their facilities. More than nine out of 10 respondents from health clubs (95.8%), schools (96%), and colleges (94.4%) currently include aquatic programming. Fewer respondents from rec centers (88.2%), camps (85.1%), and parks (81.8%) included aquatic programming.
The top 10 most common aquatic programs at aquatic facilities in 2023 were:
1. Leisure swim (90.2%) +2.5
2. Learn-to-swim for children (76.6%) +2.3
3. Lifeguard training (73.3%) +3.2
4. Lap swim (73.1%) +1.1
5. Aquatic exercise programs (62.5%)
6. Water safety programs (55.1%) +1
7. Learn-to-swim for adults (52.9%)
8. Youth swim teams (49.3%)
9. Swim meets and competitions (46.3%)
10. Special needs aquatic programs (31.1%)
The most growth was seen in lifeguard training, which saw an increase of 3.2 percentage points over 2022. Other programs that saw growth from 2022 to 2023 include leisure swim (up 2.5), learn-to-swim for children (up 2.3), lap swim (up 1.1) and water safety programs (up 1 percentage point).
Long well known for their aquatic programming—and especially their focus on swim lessons and swim safety—Ys are most likely to offer many different types of aquatic programming. Ys were more likely than their counterparts from other facility types to provide learn-to-swim for children, lifeguard training, water safety programs, learn-to-swim for adults, youth swim teams, and special needs aquatic programs.
Health club respondents were the most likely to provide leisure swim time, lap swim time, aquatic exercise programs, and aqua-therapy programs.
School respondents were the most likely to provide swim meets and competitions, diving and dive teams, and school or collegiate swim teams.
Finally, college respondents were the most likely to offer water polo, and adult swim teams.
Some 22.6% of aquatic respondents said they were planning to add more aquatic programs to their facility’s lineup over the next few years. This is up slightly from 21% in 2022, and 21.9% in 2021.
Respondents from schools were the most likely to be planning to add more aquatic programs at their facilities. Some 32% of school respondents said they had plans to add aquatic programs—a big change from 2022, when no school respondents were planning to make program additions. They were followed by colleges, where 29.6% were planning to add programs (up from 24.3% in 2022), Ys (28.6%, down from 29.7%), rec centers (25%, down from 28.6%), and parks (24.3%, up from 21%). Far fewer respondents from camps (8.5%, up from 6.7% in 2022) and health clubs (8.3%, down from 18.2%) had plans to add aquatic programming at their facilities.
The 10 most commonly planned aquatic programs in 2023 were:
1. Special needs aquatic programs (planned by 30.8% of those who will be adding programs, up from 25.4%)
2. Learn-to-swim for adults (27.7%, up from 20.3%)
3. Aquatic exercise programs (27.7%, up from 20.3%)
4. Learn-to-swim for children (26.9%, up from 23.7%)
5. Lifeguard training (21.5%, up from 16.9%)
6. Water safety programs (20%, up from 15.3%)
7. Youth swim teams (19.2%, up from 11.9%)
8. Aqua-therapy (19.2%, up from 11.9%)
9. Swim meets and competitions (19.2%, up from 11.7%)
10. Water polo (17.7%, up from 11.9%)
This year, aquatic respondents from schools were the most likely to be planning to add the most different types of programs, including: special needs aquatic programs, aquatic exercise programs, lifeguard training, aqua-therapy programs, water polo, adult swim teams, and lap swim.
They were followed by camps, where respondents were more likely than their peers from other types of facilities to be planning to add learn-to-swim for adults, learn-to-swim for children, water safety programs, and leisure swim time.
Park respondents were the most likely to be planning to add youth swim teams, swim meets and competitions, and diving and diving teams.
Finally, respondents from colleges were the most likely to be planning to add school or collegiate swim teams.
Aquatic Facility Construction & Features
Far fewer aquatic respondents in 2023 were planning construction at their facilities than in 2022. In 2023, two-thirds (66.8%) of respondents whose facilities include aquatics said they were planning construction, compared with 74.4% in 2022, but higher than in 2021, when 65.1% had construction plans. Aquatic respondents in 2023 were only slightly more likely than non-aquatic respondents to have construction plans. Some 63.7% of non-aquatic respondents in 2023 had plans for construction, down from 66.7% in 2022, and 64.1% in 2021.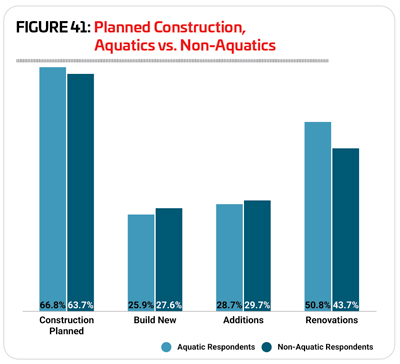
While they were more likely to be planning construction of any kind, aquatic respondents were actually less likely than non-aquatic respondents to be planning additions or new construction, while they were much more likely to be planning renovations. More than half (50.8%) of aquatic respondents said they had plans for renovations, compared with 43.7% of non-aquatic respondents. On the other hand, 25.9% of aquatic respondents were planning new construction, and 28.7% were planning additions, compared with 27.6% of non-aquatic respondents planning new construction, and 29.7% planning additions. (See Figure 41.)
Aquatic respondents were planning to spend 20% more on their construction plans than non-aquatic respondents in 2023. Aquatic respondents were planning to spend an average of $9,427,000, while non-aquatic respondents were planning to spend an average of $7,856,000 on construction.
The top 10 features covered by this survey that were most commonly found among aquatic respondents’ facilities in 2023 include:
1. Pool lifts and accessibility equipment (found among 71.1% of aquatic respondents’ facilities, up from 63.4% in 2022, but about the same as 2021, when 71.3% said they had pool lifts)
2. Automatic chemical feeders (71.1%, up from 66.8%)
3. Diving boards (49.5%, up from 43%)
4. Zero-depth entry (42.1%, up from 32.8%)
5. Waterslides (37.7%, up from 35.5%)
6. Water play structures (32%, up from 27.9%)
7. Splash pads (25.4%, up from 20.4%)
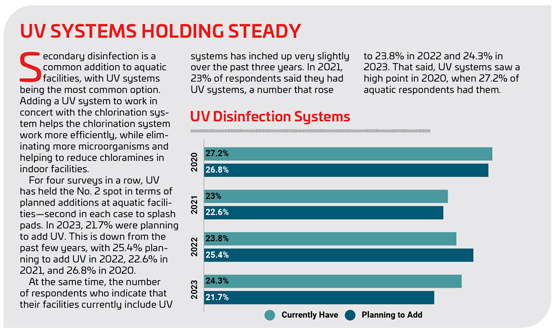
8. UV disinfection systems (24.3%, up from 23.8%)
9. Variable speed pumps (21.2%, up from 15.8%)
10. Pool inflatables (17.9%, up from 16.2%)
Aquatic respondents from park facilities were more likely than others to include many of the more recreational items on the list, including: waterslides, water play structures, splash pads, lazy rivers, poolside cabanas, and poolside climbing walls.
Aquatic respondents from schools were the most likely to use automatic chemical feeders, diving boards, variable frequency drives, and ozone systems.
Aquatic respondents from health clubs were the most likely to use saline chlorination systems, or advanced oxidation process, or AOP, systems.
Aquatic respondents from Ys were the most likely to include pool lifts and accessibility equipment, UV disinfection systems, variable speed pumps, and wave pools.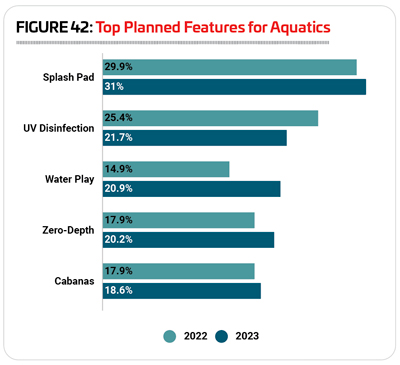
Aquatic respondents from camps were more likely than others to include pool inflatables, as well as pool obstacle or ninja courses.
Finally, aquatic respondents from rec centers were the most likely to include zero-depth entry pools, solar pool heating, and surf machines.
Some 22.5% of aquatic respondents in 2023 said they had plans to add features to their aquatic facilities over the next several years, down from 23.8%, but virtually unchanged from 22.2% in 2021. Aquatic respondents from Ys, rec centers and parks were the most likely to have such plans. Some 26.5% of aquatic respondents from Ys, 26.3% from rec centers and 24.8% from parks said they were planning to add aquatic features at their facilities. They were followed by schools (24%), health clubs (20.8%), and camps (17%). Aquatic respondents from colleges were the least likely to be planning to add aquatic features to their facilities, with 12.7% indicating they would do so over the next several years.
As has been the case for the past couple of years, the most commonly planned addition in 2023 was splash pads. More than three out of 10 (31%) aquatic respondents with plans to add features at their facilities said they would be adding splash pads, up from 29.9% in 2022 and 27.4% in 2021. In addition, 21.7% were planning to add UV disinfection (down from 25.4% in 2022), 20.9% were planning to add water play structures (up from 14.9%), 20.2% were planning to add zero-depth entry (up from 17.9%), and 18.6% were planning to add poolside cabanas (up from 17.9%). (See Figure 42.) RM
