


In this section, we take a look at the latest trends among respondents from parks and recreation agencies, including park departments, park districts, state park districts and similar organizations. The largest cohort covered in the survey, these respondents made up 31.5% of the survey respondents, representing virtually no change from 2022, when 31.6% of the survey respondents were from parks agencies.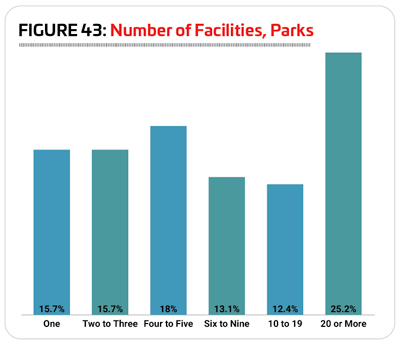
Park respondents were most likely to be from the Midwest or the West. Nearly three in 10 park respondents said they were located in the Midwest (29.9%), and a similar number (28.6%) said they were located in the West. Another 18% were from the Northeast, while 14.3% were from the South Atlantic region, and 9.2% were from the South Central states.
Park respondents were most likely to be from suburban communities, with 44.2% indicating they call the suburbs home. Around a third (34%) were located in rural communities, and 21.8% said they were located in urban areas.
On average, park respondents said they serve 310,000 people, though the median for these respondents was 10,000.
On average, park respondents said they manage 13.3 individual facilities, up from nine in 2022 and 11.1 in 2021. The maximum number of facilities managed by a park respondent is 51, and the median is six. Nearly four in 10 (37.6%) park respondents said they manage 10 or more facilities, up from 26% in 2022. This compares with just 15.1% of non-park respondents. On the other hand, while 44.6% of non-parks respondents said they have just a single facility to manage, only 15.7% of parks respondents manage just a single facility. Another 15.7% said they manage two to three individual facilities, while 18% have four to five facilities to manage, and 13.1% manage six to nine separate facilities. (See Figure 43.)
Park respondents were most likely to report that their audience was made up of all ages. In fact, nearly two-thirds (64.3%) of park respondents said they reach all ages, compared with just a third (33.6%) of non-park respondents. Another 19.2% of park respondents said their primary audience was made up of children ages 4 to 12, and 10.5% primarily served adults. Much smaller numbers said their primary audience was made up of seniors (3.8%), or teens or college students (2.2%).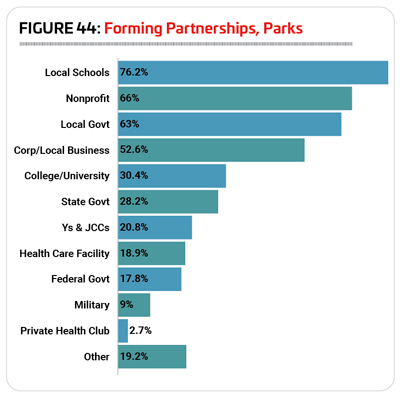
A majority of park respondents (93.4%) said that they have partnered with outside organizations, representing virtually no change from 2021, when 93.8% of park respondents worked with outside organizations. This compares with just 80.6% of non-park respondents in 2023 who said they partner with other organizations.
The most common partners for parks were local schools, with more than three-quarters (76.2%) of park respondents indicating they had partnered with them, up from 75% in 2022. They were followed by nonprofit organizations (66%, up from 58.5%), local government (63%, down from 71%), and corporations and local businesses (52.6%, up from 32.4%). (See Figure 44.)
Revenues & Expenditures
While in most years, around half (a little more or a little less) of park respondents see their revenues increase year-over-year, the coronavirus pandemic obviously had a major impact, with nearly two-thirds (65.5%) of park respondents seeing their revenues fall, as facilities closed and attendance fell. Things turned around quickly for parks, though, and in 2021, just 23.5% saw declining revenues while 54.2% saw their revenues increase. 2022 saw numbers continuing to return to normal, with 50.2% of park respondents reporting that their revenues had increased and 32.3% reporting no change. Still, 17.5% of park respondents reported that their revenues in 2022 fell from 2021. (See Figure 45.)
Looking forward, park respondents are more optimistic, with 55.9% expecting their revenues to be higher in 2023 than in 2022, and 57.3% expecting their revenues to be even higher in 2024. At the same time, the percentage who expect their revenues to decline falls to 10.4% for 2023 and just 4.9% for 2024.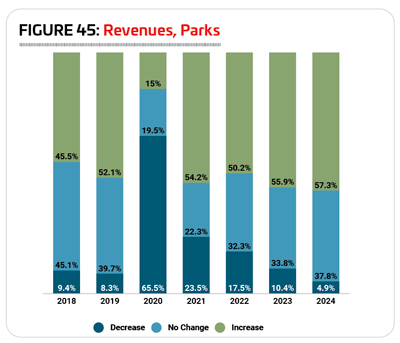
In 2022, park respondents spent an average of $3,102,000 on their operating expenses. The highest reported operating expense was $132 million, while the median was $695,000. In other words, while one park respondent spent $132 million, half of all park respondents spent $695,000 or less on their annual operating budget.
Park respondents expect lower overall operating costs in 2023 and 2024, compared with 2022, spending $2,523,000 in 2023, and $2,986,000 in 2024. At the same time, the median operating cost increases 0.7% from 2022 to 2023, from $695,000 to $700,000, and then increases a further 4.7% in 2024, to $733,000.
Park respondents report a wide range of cost recovery rates, with the greatest number—18.1%—reporting that they earn back 20% to 40% of their operating costs via revenues. This compares with 10.4% of non-park respondents. Another 17.3% of park respondents earn back between 0 and 20% of their operating cost via revenues (vs. 12.6% of non-park respondents), while 14.5% earn back between 40% and 60% (compared with 12.9% of non-park respondents). Another 17.3% of park respondents said they earn back 60% to 80% of their operating costs via revenues (vs. 15.5% of non-park respondents), and just 6% of park respondents earn between 80% and 100% of their operating costs via revenues (compared with 9.7% of non-park respondents). Around one-quarter (26.6%) of park respondents did not know their cost recovery rate.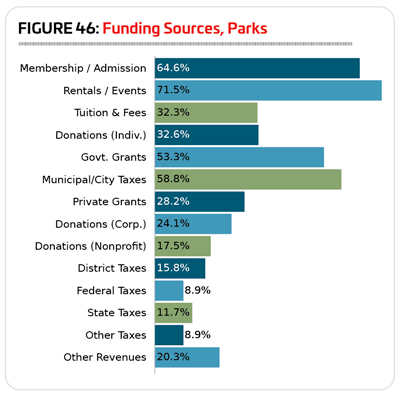
When it comes to sources of funding for their facilities, rentals and private events, membership or admission fees, and municipal/city taxes were the most common for park respondents. More than seven in 10 (71.5%) said that rentals and private events were a source of funding for their facilities, representing virtually no change from 2022 (71.9%). Another 64.6% received funding from membership or admission fees (64.9% in 2022), and 58.8% received funding through city or municipal taxes (down from 62.6%). More than half of park respondents (53.3%), also rely on government grants to fund their facilities, up from 43.3%. (See Figure 46.)
Park respondents were far more likely than other respondents to rely on facility rentals and private events, with 71.5% of parks using rentals and events as a source of funding, compared with 52.9% of non-park respondents. Municipal and city taxes were also far more likely to be a source of funding for park respondents (58.8%) than for non-park respondents (13.6%).
Park respondents in 2023 were less likely than in 2022 to indicate that they had taken action over the past several years to reduce their operating costs. Some 80.3% of park respondents had taken such action, down from 84.1% in 2022 and 91.2% in 2021. This compares with 85.5% of non-park respondents in 2023 who had taken action to reduce their expenses, virtually unchanged from 2022 (85.6%). The most common measures park respondents had employed to reduce their operating expenses include: increasing fees (53.2%, up from 42.9% in 2022); improving energy efficiency (35.9%, up from 27.1%); putting construction or renovation plans on hold (34.2%, up from 33.5%); reducing their hours of operating (29.9%, down from 42.9%); or reducing staff (29.6%, down from 41.2%).
Park Facilities
After seeing a dramatic decrease in the number of people 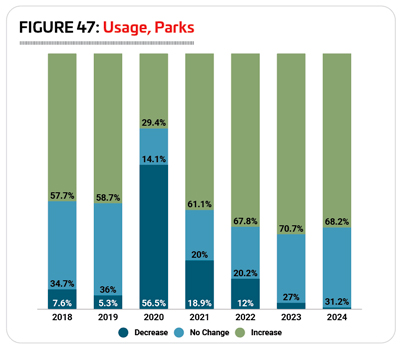 using their facilities amidst the beginning of the pandemic in 2020, attendance at park facilities has been getting back to normal ever since. In 2022, more than two-thirds (67.8%) of park respondents said the number of people using their facilities increased over the previous year. Another 20.2% reported no change, and 12% said the number of people using their facilities decreased in 2022. (See Figure 47.)
In 2023, more than seven out of 10 park respondents (70.7%) expect the number of people using their facilities to increase, while 27% expect no change, and 2.3% expect a decrease. Expectations for 2024 are fairly similar, with 68.2% expecting the number of people using their facilities to increase, 31.2% expecting no change, and just 0.6% expecting a decrease.
Nearly three-quarters (74.3%) of park respondents indicated that they have plans for construction over the next several years, down from 82%. This compares with 62.4% of non-park respondents. More than half (54%) of park respondents were planning renovations to their existing facilities, down from 62.9% in 2022. More than one third had plans to make additions to their existing facilities (36.7%, up from 31.5%), or build new facilities (34.3%, down from 40.4% in 2022). (See Figure 48.)
Park respondents in 2023 were planning to spend an average of $9,180,000 on their construction plans. The highest reported construction budget was $275 million, and the median construction budget was $1 million.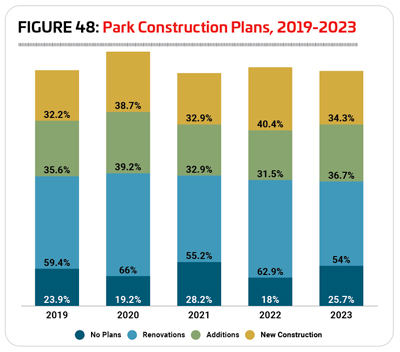
There was little change in the features most commonly found among park respondents’ facilities from 2022 to 2023. The 10 most common park features in 2023 include: playgrounds (83.7% of park respondents have playgrounds); park shelters such as gazebos and picnic shelters (80.7%); park restroom structures (79.3%); outdoor sports courts for sports like basketball, tennis and, of course, pickleball (73.6%); walking and hiking trails (71.2%); bleachers and seating (70.4%); natural turf sports fields (69.6%); open spaces like gardens and natural areas (67.9%); concession areas (63.3%); and classrooms and meeting rooms (62.5%). Classrooms and meeting rooms rose into the top 10, switching places with community or multipurpose centers.
Park respondents in 2023 were far more likely to report that they had plans to add features at their facilities over the next few years than non-park respondents. In fact, 62.6% of park respondents in 2023 said they were planning to add features at their facilities, up from 53.4% in 2022 and 48.6% in 2021. This compares with just 39.3% of non-park respondents in 2023 who have plans to add features at their facilities, up from 32.5% in 2022 and 29.8% in 2021.
The most commonly planned additions for park respondents in 2023 include:
1. Splash play areas (planned by 29.2% of park respondents who will be adding features)
2. Park restroom structures (24%)
3. Dog parks (21.9%)
4. Park shelters (21%)
5. Playgrounds (19.7%)
6. Walking and hiking trails (18.5%)
7. Bike trails (18%)
8. Outdoor sports courts (17.6%)
9. Outdoor fitness areas and fitness trails (16.3%)
10. Synthetic turf sports fields (15.5%)
Programming
Park respondents were a bit more likely than non-park respondents to indicate that they provide programming of any kind at their facilities. While 94.8% of non-park respondents said they host programming at their facilities, 98% of park respondents do so, up from 97.7% in 2022.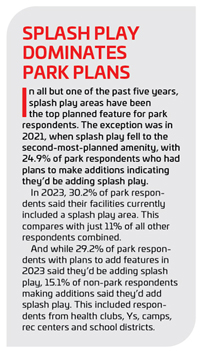
The most common programs found in park respondents’ facilities include: holidays and other special events (87.8% of park respondents host special events and holiday events); youth sports teams (74.2%); day camps and summer camps (66.8%); arts and crafts (62.3%); programs for active older adults (62.3%); educational programs (62%); group exercise programs (60.8%); fitness programs (59.3%); adult sports teams (56.7%); and festivals and concerts (56.7%).
Programs that saw an increase for park respondents in 2023 include: holidays and other special events (up 6.2 percentage points from 81.6%); youth sports teams (up 4.1 from 70.1%); fitness programs (up 3 from 56.3%); educational programs (up 2.2 from 59.8%); festivals and concerts (up 2.2 from 54.5%); and programs for active older adults (up 1.4 from 60.9%).
Park respondents were much more likely than non-park respondents to report that they had plans to add programming options at their facilities over the next several years. More than half (50.6%) of park respondents said they had such plans (up from 49.4% in 2022 and 44.8% in 2021), compared with 37.5% of non-park respondents (up from 29.4% in 2022 and 29.7% in 2021).
The most commonly planned program additions in 2023 for parks include:
1. Teen programming (up from No. 5)
2. Environmental education programs (no change)
3. Educational programs (up from No. 8)
4. Programs for active older adults (did not appear in the top 10 for parks in 2022)
5. Fitness programs (down from No. 1)
6. Arts and crafts (did not appear in 2022)
7. Group exercise programs (down from No. 4)
8. Adult sports teams (down from No. 7)
9. Mind-body balance programs such as yoga (down from No. 3)
10. Special needs programs (down from No. 9)
Programs for active older adults and arts and crafts programs replaced performing arts programs and day camps and summer camps.
Outreach, Conservation & Other Initiatives
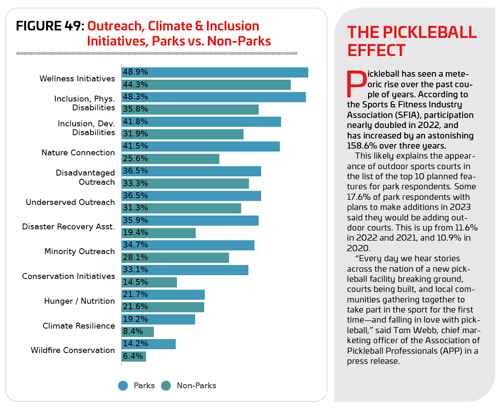
We asked Industry Report respondents about their involvement in a variety of initiatives related to inclusion and outreach, conservation and wellness, and in every case, park respondents were the most likely to be rising to the challenge. Some 93.9% of park respondents said they were involved in at least one initiative on the list.
The initiatives park respondents were most commonly involved in include: wellness initiatives (48.9% of park respondents vs. 44.2% of non-park respondents); inclusion for those with physical disabilities (48.3% vs. 35.8%); inclusion for those with developmental disabilities (41.8% vs. 31.9%); providing a connection to nature (41.5% vs. 25.6%); and outreach to economically disadvantaged communities (36.5% vs. 33.3%).
Beyond the most common initiatives, park respondents were much more likely than non-park respondents to be involved in: disaster recovery assistance (35.9% vs. 19.4%); conservation initiatives (33.1% vs. 14.5%); and climate resilience initiatives (19.2% vs. 8.4%). (See Figure 49.) RM
