


In this section, we’ll take a closer look at the responses from professionals working for colleges and universities, who made up 10.2% of the survey respondents in 2023, virtually unchanged from 2022 (10.1%).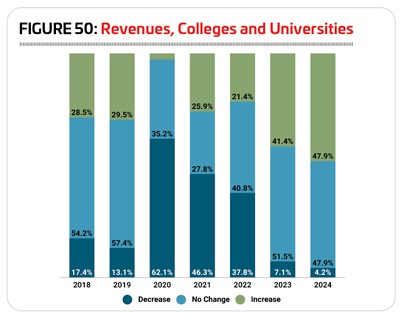
As was the case last year, the majority of college respondents in 2023 were from either the Midwest or the Northeast. Some 38% of college respondents said they were located in the Midwest, and 22% were located in the Northeast. Another 16% of college respondents were from the Western states, and the South Atlantic region and the South Central region were each home to 12% of college respondents.
College respondents were most likely to be located in suburban communities. Some 40% said they could be found in the suburbs. Another 39% said they were from urban communities, and 21% were located in rural areas.
On average, college respondents are reaching an average population of 44,850 people, up from 18,200 in 2022 and 32,110 in 2021. The median population size in 2023 is 4,000.
A majority of college respondents (60%) said they were with public colleges and universities. Another 33.3% were with private, nonprofit schools, and 2.5% said they were with private, for-profit schools.
On average, college respondents manage 6.4 individual facilities, up from 3.2 in 2022, and 3.7 in 2021. They were just about as likely to manage three or fewer facilities than non-college respondents, but much less likely to manage 10 or more. Some 55.5% of college respondents said they manage one to three individual facilities, compared with 55.3% of non-college respondents. On the other hand, while 13.6% of college respondents manage 10 or more individual facilities, 23.1% of non-college respondents have 10 or more facilities to manage. 
College and university respondents were just slightly less likely than others to report that they had partnered with external organizations, though a majority had done so. Some 82.9% of college respondents said they had formed partnerships with other organizations (up from 80% in 2022), compared with 84.6% of non-college respondents. College respondents were far more likely than others to report that they had partnered with other colleges and universities. More than seven in 10 (70.9%) college respondents said they had partnered with other colleges, compared with 31.6% of non-college respondents. Far fewer college respondents formed other types of partnerships, but the most common were: local schools (27.4% of college respondents had partnered with local schools); nonprofit organizations (24.8%); corporations or local businesses (23.1%); and health care and medical facilities (17.9%).
Revenues & Expenditures
After being the least likely to report any revenue increases in 2020, respondents from colleges and universities were among the most likely to report that their revenues had fallen in 2021 and in 2022. While the worst hit accompanied the pandemic, with 62.1% of college respondents reporting a decrease in revenue in 2020, more college respondents than usual reported revenue decreases in 2021 (46.3%) and in 2022 (37.8%). Another 21.4% said their revenues had increased in 2022, and 40.8% said their revenues had remained unchanged. (See Figure 50.)
College respondents had more positive expectations for 2023 and 2024. In 2023, 41.4% expect their revenues to increase, 51.5% expect no change, and 7.1% expect their revenues to fall. And in 2024, 47.8% expect revenues to increase and 47.9% expect no change. Just 4.2% of college respondents expect their revenues to decrease in 2024.
In 2022, college respondents spent an average of $4,457,000 on their operating expenses. The highest reported operating cost was $108 million, while the median was $892,000.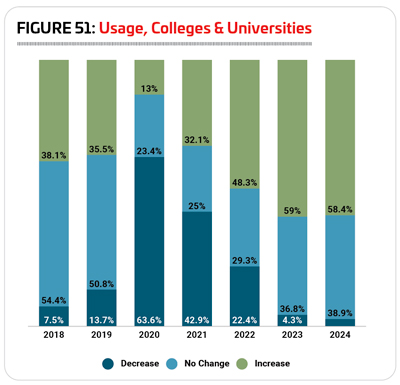
College respondents expect their average operating cost to increase by 8.1% from 2022 to 2023, to an average of $4,818,000. They expect a further increase of 2.8% in 2024, with the average operating cost rising to $4,952,000.
While the largest number of college respondents (42.3%) did not know their cost recovery rate, the next largest group said they earned back 20% or less of their operating costs via revenues. Some 21.1% of college respondents said they earned back 20% or less, compared with 19.4% of non-college respondents. Another 7% of college respondents earn back between 21% and 40% of their operating costs via revenues (compared with 19.4% of non-college respondents). Slightly more (11.3%) earn back between 41% and 60% of their costs via revenues (compared with 19.7% of non-college respondents). Less than one in 10 college respondents said they earn back 61% to 80% (9.9%, compared with 24.3% of non-college respondents) or more than 80% of their costs via revenues (8.5%, compared with 11.9% of non-college respondents).
Not surprisingly, the top source of revenues for college and university respondents’ facilities is tuition and fees. Some 83% of college respondents said that tuition and fees were a source of funding for their facilities, compared with just 30.3% of non-college respondents. The next most common sources of revenue for college respondents were: membership and admission fees (68%); facility rentals and private events (57%); donations from individuals (34%); and corporate donations (20%).
While college respondents are usually less likely than other respondents to report that they had taken action to reduce their operating expenses, over the past three years, that trend has reversed. In 2021, 93.3% of college respondents had taken such actions, and in 2022 90.9% of college respondents said they had taken action to reduce their operating costs. In 2023, 85.9% of college respondents said they had taken action over the past few years to reduce their operating costs. This compares with 83% of non-college respondents. The most common measures college respondents used to reduce their costs include: reducing their hours of operation (63.6% of college respondents vs. 27.2% of non-college respondents); reducing their staff (43.4% vs. 28.4%); cutting programming or services (36.4% vs. 18.6%); putting construction or renovation plans on hold (33.3% vs. 34.6%); and improving energy efficiency (32.3% vs. 35.9%).
College Facilities
After witnessing the major impact of the pandemic on facility usage in 2020 and 2021, college respondents are seeing the number of people using their facilities increase again. While 63.6% of college respondents in 2020 and 42.9% in 2021 said the number of people using their facilities had fallen, in 2022, 22.4% of college respondents saw the number of people using their facilities decline, while 29.3% reported no change and 48.3% reported an increase. (See Figure 51.)
In 2023, a majority (59%) of college respondents said they expect the number of people using their facilities to increase, with 36.8% expecting no change and 4.3% expecting a decrease. And in 2024, 58.4% of college respondents expect usage to rise, while 38.9% expect no change and just 2.7% anticipate a decline.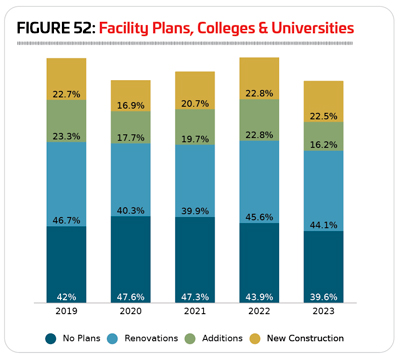
Respondents from colleges and universities were somewhat less likely than other respondents to report that they had plans for construction over the next few years. Some 60.4% of college respondents said they had such plans (up from 56.1%) in 2022), compared with 65.6% of non-college respondents.
The numbers of college respondents planning various types of construction has held relatively steady over the past five years. In 2023, 22.5% of college respondents said they were planning to build new facilities, compared with 22.8% in 2022 and 20.7% in 2021. Another 16.2% said they planned to make additions to their existing facilities, down from 22.8% in 2022 and 19.7% in 2021. And 44.1% of college respondents said they are planning renovations to their existing facilities, compared with 45.6% in 2022 and 39.9% in 2021. (See Figure 52.)
College respondents in 2023 were planning to spend an average of $24,263,000 on their construction plans. The highest planned construction budget was $350 million, and the median cost was $2 million.
The 10 features most commonly found among college respondents’ facilities in 2023 include: locker rooms; fitness centers; indoor sports courts for sports like basketball and volleyball; classrooms and meeting rooms; exercise studio rooms; natural turf sports fields; bleachers and seating; outdoor courts for sports like basketball and tennis; indoor tracks; and Wi-Fi services.
College respondents were less likely than non-college respondents to report in 2023 that they had plans to add features at their facilities over the next several years. Some 35.8% of college respondents had such plans, compared with 47.8% of non-college respondents. That said, this represents a continued increase for college respondents. In 2022, 31.6% of college respondents said they had plans to add features, and in 2021, just 23.9% of college respondents were planning to add features at their facilities.
The most commonly planned additions for college respondents in 2023 include:
1. Synthetic turf sports fields (planned by 27.9% of college respondents with plans to add features)
2. Fitness trails and outdoor fitness equipment (20.9%)
3. Climbing walls (18.6%)
4. Exercise studio rooms (18.6%)
5. Indoor running track (18.6%)
6. Disc golf courses (16.3%)
7. Locker rooms (14%)
8. Open spaces like gardens
and natural areas (14%)
9. Outdoor sports courts (11.6%)
10. Indoor sports courts (11.6%)
Programming
The number of college respondents who said they provide programming of any kind at their facilities increased slightly in 2023, to 98.2%. In 2022, 96.4% of college respondents provided programming, a number that changed little from 2021 (96.7%) and 2020 (96%).
Fitness programs continue to top the list of most commonly offered programs among college respondents. Some 83% of college respondents said they currently offer fitness programs, down from 85.7% in 2022.
Other common programs at colleges and universities include: group exercise programs (76.8%, no change from 2022); mind-body balance programs like yoga (67.9%, down from 69.6%); individual sports activities like running clubs or swim clubs (61.5%, up from 55.4%); functional fitness programs (60.7%, up from 55.4%); adult sports teams (58%, down from 58.9%); personal training (57.1%, up from 48.2%); sports tournaments and races (51.8%, down from 60.7%); educational programs (50.9%, up from 48.2%); and swimming programs (50.9%, up from 42.9%).
The number of college respondents with plans to add programs at their facilities has been on the rise over the past several years. In 2023, 36.8% of college respondents said they were planning to add programs. This is up from 35.1% in 2022, and 29.8% in 2021 and 2020.
The most commonly planned program additions for college and university respondents include:
1. Aquatic exercise programs (did not appear in the top 10 for 2022)
2. Functional fitness programs (down from No. 1 in 2022)
3. Mind-body balance programs like yoga (down from No. 2)
4. Nutrition and diet counseling (did not appear in 2022)
5. Day camps and summer camps (did not appear in 2022)
6. Personal training (down from No. 4)
7. Educational programs (down from No. 6)
8. Group exercise programs (down from No. 3)
Tied for ninth place were: environmental education programs; programs for active older adults; sport training like golf or tennis lessons; youth sports teams; adaptive sports programs; and climbing programs. None of these appeared on the list of top planned program additions in 2022.
Falling off the list from 2022 were fitness programs, adult sports teams, sports tournaments and races, individual sports activities like running clubs, and swimming programs. RM
