


Over the next pages, we’ll take a look at the survey responses from professionals working in schools and school districts. This group made up 9.2% of all respondents, down from 11.2% in 2022.
The greatest number of school respondents were located in the Midwestern region of the United States. Some 39% of school respondents said they were from the Midwest. The Northeast followed, with 22% of school respondents. Some 14.6% of school respondents could be found in the South Atlantic, as well as in the West. And 9.8% of school respondents called the South Central region their home.
As always, school respondents were most likely to be located in rural communities, and were much more likely to be from rural areas than other respondents. Well over half (53.7%) of school respondents said they were from rural communities, compared with 34.7% of non-school respondents. Another 32.9% of school respondents were from suburban communities, and 13.4% were from urban areas.
School respondents largely worked for public schools, with 79.8% indicating they work with public schools or school districts. Another 15.6% said they were with private, nonprofit schools, and 2.8% said they worked for private, for-profit schools.
On average, school respondents are reaching a population of 6,780 people, down from 22,410 in 2022 and 14,060 in 2021. The median population size for schools in 2023 is 600 people.
On average, school respondents said they manage 9.2 facilities, up from 7.1 in 2022. Some 44.7% of school respondents said they manage between one and three individual facilities. Another 27.6% manage between four and nine facilities, and 27.7% manage 10 or more individual facilities.
Respondents from schools and school districts were much less likely to report that they had partnered with outside organizations in 2023 than in 2022. Some 82.2% of school respondents said they had partnered with others, down from 92.1% in 2022 and 90.4% in 2021. This compares with 84.6% of non-school respondents who had partnered with other organizations in 2023. The most common partners for school respondents include: other local schools (56.1% of school respondents had partnered with other schools); local government (31.8%); nonprofit organizations (30.8%); colleges or universities (26.2%); and corpora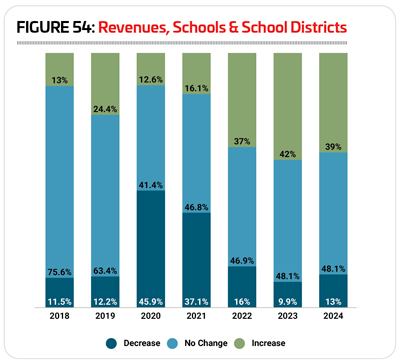 tions or local businesses (20.6%).
As usual, school respondents were most likely to report that teens between the ages of 13 and 18 made up their primary audience. Some 44% of school respondents said they primarily reached teenagers, compared with just 4.8% of non-school respondents. Another 26.6% of school respondents said they primarily reached children ages 4 to 12, while 17.4% serve an all-ages audience. Smaller numbers of school respondents said they primarily served adults ages 19 to 64 (7.3%), infants and toddlers (1.8%), seniors (1.8%), or college students (0.9%).
Revenues & Expenditures
In most years of the survey, school respondents have tended to report fairly stable revenues, with a majority in each year not seeing any change up or down. The coronavirus pandemic upended this trend, first by driving up the number of school respondents reporting decreasing revenues (from 12.2% in 2019 to 45.9% in 2020 and 37.1% in 2021), and then, as normal operations began to become more dominant, with higher numbers reporting increases beginning in 2022.
In 2022, 37% of school respondents said their revenues were higher than in 2021, while 46.9% reported no change and 16% reported a decrease. (See Figure 54.)
School respondents were most likely to be expecting no further changes to their revenues in 2023 and 2024, when 48.1% said they expect no change. Some 42% were expecting their revenues to increase in 2023, and 39% were expecting an increase in 2024. Finally, 9.9% expected revenues to fall in 2023, and 13% expected a decrease in 2024.
In 2023, school respondents spent an average of $4,553,000 on their operating expenses. The highest reported operating cost was $35 million, while the median cost was $625,000.
Looking forward, school respondents actually projected lower average operating expenditures over the next two years. The average for 2023 is 6.7% lower than 2022, at $4,248,000. In 2024, school respondents projected a further decrease of 2.2%, to an average of $4,155,000.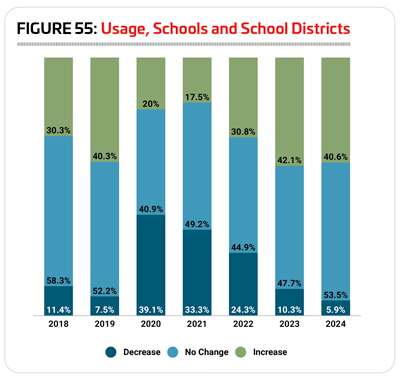
While the largest number of school respondents (38.3%) did not know their cost recovery rate, the next largest group said they earned back 20% or less of their operating costs via revenues. Some 21.7% of school respondents said they earned back 20% or less, compared with 13.9% of non-school respondents. Another 18.3% of school respondents said they earn back between 21% and 40% of their operating costs via revenues (compared with 13.1% of non-school respondents). Less than one in 10 school respondents said they earn back between 41% and 60% (6.7% of school respondents, compared with 14.4% of non-school respondents); between 61% and 80% of their costs (8.3%, compared with 17.3% of non-school respondents); or more than 80% of their costs via revenues (6.7% vs. 8.6% of non-school respondents).
School respondents’ facilities were far more likely to receive some portion of their funding from taxes than other respondents. Some 45.7% of school respondents said that district taxes were a source of funding for their facilities, compared with just 7.6% of non-school respondents. Federal taxes were a source of funding for 42% of school respondents, but only 7.1% of non-school respondents. Some 39.5% of school respondents received funding via city or municipal taxes, compared with 27% of non-school respondents. And 38.3% of school respondents received funding from state taxes, compared with just 5.8% of non-school respondents. More than three in 10 school respondents also were funded via tuition and fees (30.9%) or government grants (30.9%).
Respondents from schools and school districts in 2023 were more likely than those in 2022 to report that they had taken action over the past several years to reduce their operating costs. Some 73.4% of school respondents in 2023 said they had taken such action, up from 63.8% in 2022 and 71.4% in 2021. This compares with 84.2% of non-school respondents in 2023 who had taken such action (down from 87.2%).
The measure school respondents were most likely to deploy to reduce their operating costs in 2023 was improving their energy efficiency. Some 38% of school respondents said they had improved their energy efficiency over the past several years, up from 34.5% in 2022. Other actions school respondents had taken to reduce their costs include: increasing fees (30.4%); putting construction or renovation plans on hold (22.8%); reducing staff (16.5%); or reducing their hours of operation (10.1%).
School Facilities
School respondents typically are most likely to report steady numbers of people using their facilities over time. The pandemic, of course, disrupted everything, and the years 2020 and 2021 showed a departure from the norm for schools, with much larger numbers than usual reporting a decrease in usage.
In 2022, things began to stabilize again for school respondents, and while 24.3% still reported a decrease in the number of people using their facilities, 44.9% reported no change and 30.8% saw usage of their facilities rise. (See Figure 55.)
School respondents are most likely to expect the number of people using their facilities to either hold steady or increase in 2023 and 2024. Some 47.7% of school respondents expect no change in 2023, while 53.5% expect no change in 2024. And 42.1% expect to see the number of people using their facilities to increase in 2023, while 40.6% expect an increase in 2024. Just 10.3% of school respondents expect the number of people using their facilities to decline in 2023, and just 5.9% expect a decrease in 2024.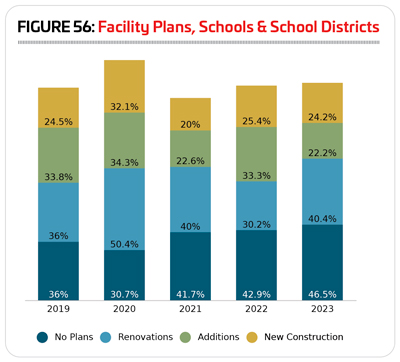
The percentage of school respondents who report that they have plans for construction has been falling over the past several years, from 69.3% in 2020, to 58.3% in 2021, 57.1% in 2022 and now 53.5% in 2023. This compares with 66.3% of non-school respondents in 2023 who have plans for construction over the next several years.
School respondents were most likely to be planning renovations. Some 40.4% of school respondents said they would be renovating their existing facilities, up from 30.2% in 2022. Another 22.2% said they are planning additions (down from 33.3%), and 24.2% are planning new construction (down from 30.2%). (See Figure 56.)
School respondents in 2023 were planning to spend an average of $9,575,000 on their construction plans. The highest planned construction budget was $50 million, and the median cost was $2.5 million.
The most common features found among school respondents’ facilities in 2023 come as no surprise, largely supporting their youth sports and physical education activities. They include: locker rooms, bleachers and seating, indoor courts for sports like basketball and volleyball, classrooms and meeting rooms, fitness centers, outdoor sports courts for sports like tennis and basketball, concession areas, natural turf sports fields, playgrounds and outdoor running tracks.
Some 38.5% of school respondents in 2023 said they had plans to add features at their facilities over the next few years, up from 23.8% in 2022 and 20% in 2021. This compares with nearly half (47.4%) of non-school respondents in 2023 who have plans to add features to their facilities.
The 10 most commonly planned features for school respondents include:
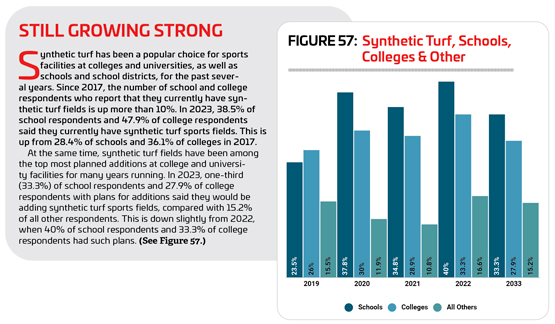
1. Synthetic turf sports fields (33.3%)
2. Outdoor sports courts (21.4%)
3. Bleachers and seating (19%)
4. Community gardens (16.7%)
5. Natural turf sports fields (16.7%)
6. Concession areas (14.3%)
7. Park shelters, such as gazebos and picnic shelters (14.3%)
8. Walking and hiking trails (11.9%)
9. Indoor sports courts (11.9%)
10. Locker rooms (11.9%)
Programming
The vast majority of school respondents—97%—said they offer programming at their facilities, up from 93.7% in 2022.
As always, the most common program provided at school respondents’ facilities was youth sports teams. Some 85.7% of school respondents in 2023 said their facilities provide a home for youth sports teams, compared with 49% of non-school respondents. This is up from 2022, when 82.5% of school respondents included youth sports teams, as well as 2021 (77.9%).
The other top programs found at school respondents’ facilities in 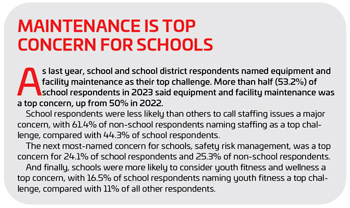 2023 include: educational programs (66.3%); fitness programs (50%); individual sports activities such as running clubs (44.9%); sports tournaments and races (40.8%); group exercise programs (38.8%); holidays and other special events (38.8%); daycare or preschool programs (36.7%); day camps and summer camps (35.7%); special needs programs (34.7%), and performing arts programs (34.7%).
Respondents from schools and school districts were among the least likely to be planning to add programs at their facilities over the next few years, though the number is up from the past two years. More than one-fifth (20.8%) of school respondents in 2023 said they had plans to make programming additions at their facilities, up from 12.7% in 2022 and 14.7% in 2021. This compares with 43.6% of non-school respondents in 2023 who have plans to add programs at their facilities.
The top planned program additions for school respondents include:
1. Fitness programs (no change from 2022)
2. Group exercise programs (no change from 2022)
3. Mind-body balance programs such as yoga (did not appear among top planned programs
for schools in 2022)
4. Special needs programs (up from No. 8)
5. Day camps and summer camps (did not appear in 2022)
6. Nutrition and diet counseling (down from No. 4)
7. Youth sports teams (up from No. 9)
8. Personal training (up from No. 10)
A whole slew of programs was tied for the next spot, including educational programs (down from No. 5), teen programming (down from No. 6); environmental education (did not appear in 2022); performing arts programs (down from No. 3); aquatic exercise programs (did not appear in 2022); swimming programs (did not appear in 2022); and therapeutic programs (did not appear in 2022). RM
