


In this final section of the Industry Report, we’ll cover the trends reported by Y respondents. This includes not only YMCAs and YWCAs, but also facilities that provide similar programs and services and are nonprofit in nature, such as JCCs and Boys & Girls Clubs. Respondents in this group made up 6.8% of the survey population (down from 8.3% in 2022).
Respondents from Ys were most likely to be from the Midwestern region of the U.S., with 36.1% of these respondents indicating they were from the middle region of the country. They were followed by the Northeast, which was home to 23.6% of Y respondents. Another 15.3% of Y respondents were from the West. And 12.5% were from the South Atlantic region, with another 12.5% located in the South Central region.
The largest number of Y respondents—47.2%—were from suburban communities. Another 30.6% were located in rural communities, and 22.2% said they were located in urban areas.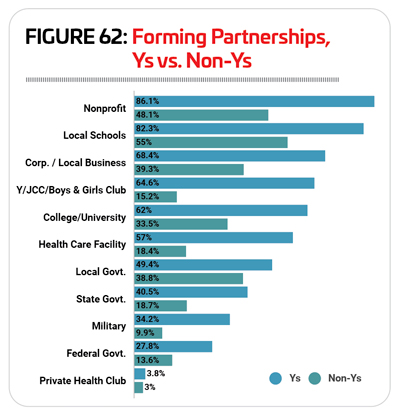
On average, Y respondents are reaching an audience of 11,790 people. The median population size for Ys is 3,000 people.
Y respondents managed an average of six individual facilities in 2023, up from 4.6 in 2022. They were more likely than other respondents to report that they manage just one to three individual facilities. Some 73.1% of Y respondents have between one and three facilities to manage, compared with 54% of non-Y respondents. Another 13.4% of Y respondents manage between four and nine facilities, compared with 23.3% of non-Y respondents. And 13.4% of Y respondents said they manage 10 or more individual facilities, compared with 22.7% of non-Y respondents.
Respondents from Ys were among the most likely to report that they had formed partnerships with other organizations. Nearly all—97.5%—Y respondents said they have formed such partnerships, compared with 83.5% of all other respondents. In fact, Ys were more likely to engage with every kind of partner named in the survey than all other respondents combined. The most common partners for Ys in 2023 were: nonprofit organizations (86.1% of Ys had partnered with nonprofits, compared with 48.1% of non-Y respondents); local schools (82.3% vs. 55%); corporations or local businesses (68.4% vs. 39.3%); other Ys and similar organizations (64.6% vs. 15.2%); and colleges and universities (62% vs 33.5%). (See Figure 62.)
Respondents from Ys were most likely to report that they work with all ages as the primary audience for their facilities. More than half (51.3%) of Y respondents said they primarily reach all ages, compared with 42.7% of non-Y respondents. Another 26.3% of Y respondents said their primary audience is made up of children ages 4 to 12, compared with 16.3% of non-Y respondents. Smaller numbers of Y respondents said that they primarily reached adults (15%), teens (5%) or seniors (2.5%)
Revenues & Expenditures
Ys quickly recovered from the dramatic impact of the pandemic in 2020, which led to a decline in revenues for 83.9% of Y respondents. In 2021, a majority 60.9% saw their revenues rise, year-over-year, though nearly a third (32.6%) still saw declining revenues. The year 2022 presented a mixed picture, with half (50.2%) of Y respondents seeing their revenues increase over 2021, nearly a third (32.3%) reporting no change, and 17.5% reporting a decrease. (See Figure 63.)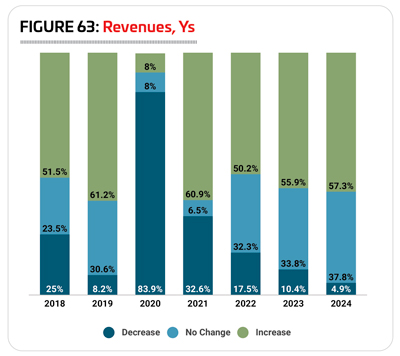
Looking forward, Y respondents were more optimistic, though less so than in previous years. For example, while 72.7% of Y respondents in 2022 expected to see their revenues increase in 2023, just 55.9% of Y respondents in 2023 expect their revenues to increase this year. Another 33.8% expect no change, and 10.4% are anticipating a decline in revenues. 2024 paints a slightly rosier picture, with 57.3% expecting revenues to increase, 37.8% expecting no change, and 4.9% expecting their revenues to fall.
In 2023, Y respondents spent an average of $2,963,000 on their operating expenses. The highest reported annual operating cost was $31 million, and the median was $1.9 million.
Looking forward, Y respondents projected a 9.7% increase to their average operating cost from 2022 to 2023, with the average cost rising to $3,250,000. They expected a further increase of 24.6% in 2024, raising the average operating cost to $4,048,000.
While the largest number of Y respondents (35.4%) did not know their cost recovery rate, the next largest numbers earned back higher percentages of their operating costs via revenues than most other respondents. Some 25% of Y respondents said they earned back 61% to 80% of their operating costs via revenues, and 16.7% earned back more than 80%, compared with 15.5% and 7.7%, respectively, of non-Y respondents. Another 12.5% of Y respondents said they earn between 41% and 60% of their operating cost back via revenues, compared with 13.6% of non-Y respondents. And just 10.5% of Y respondents earn back 40% or less of their operating cost via revenues, compared with 29.1% of non-Y respondents.
The funding profile for Y respondents differed from many o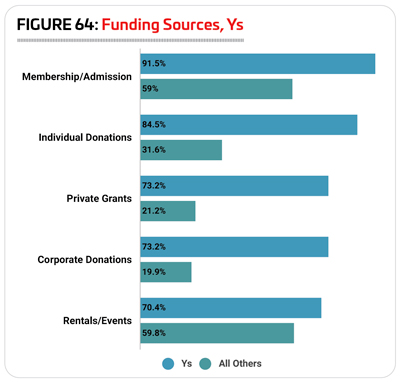 thers, with Ys being far more likely to receive funding through membership fees, donations from individuals or companies, private grants and facility rentals or events. The vast majority—91.5%—of Y respondents said their facilities were funded with membership and admission fees. This compares with 59% of non-Y respondents. More than seven out of 10 Y respondents also said their facilities were funded by: individual donations (84.5% of Y respondents, vs 31.6% of non-Y respondents); private grants (73.2% vs. 31.6%); corporate donations (73.2% vs. 19.9%); and facility rentals and private events (70.4% vs. 59.8%). (See Figure 64.)
Respondents from Ys were slightly more likely than others to report that they had taken action to reduce their operating expenses over the past several years. Some 86.1% of Y respondents said they had taken such action, compared with 83.1% of non-Y respondents. This is down from 89.4% of Y respondents who had taken action to reduce their expenses in 2022’s survey, and 97.4% in 2021.
The most common methods Y respondents had used to reduce their costs include: increasing their fees (61.1%, compared with 50.6% of non-Y respondents); reducing their hours of operation (43.1% vs. 30.1%); putting construction or renovation plans on hold (37.5% vs. 34.2%); improving energy efficiency (33.3% vs. 35.7%); and reducing staff (33.3% vs. 29.8%). Also of note, Ys were more likely than others to report that they had instituted a hiring freeze: 9.7% of Ys had done so, compared with 5.6% of non-Y respondents.
Y Facilities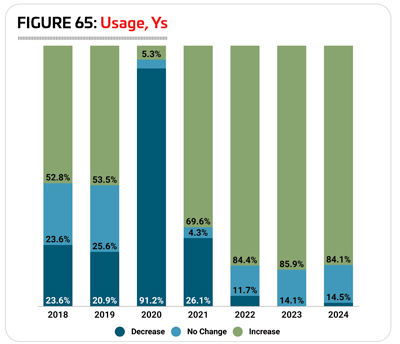
Like health clubs, which are also heavily reliant on membership dues to fund their operations, Y facilities’ likelihood of seeing increasing (or decreasing) revenues is strongly correlated with the number of people using their facilities. And also like health clubs, Ys saw a significant impact in 2020, as pandemic-related closures kept people home. Some 91.2% of Y respondents saw the number of people using their facilities drop in 2020. The year 2021 was still a bit volatile, with more than two-thirds (69.6%) reporting an increase in usage, while 26.1% still reported declines. Ys very quickly recovered, and in 2022, a large majority (84.4%) said the number of people using their facilities had increased, while 11.7% reported no change and just 3.9% reported a decrease. (See Figure 65.)
Looking forward, Y respondents were extremely positive. In 2023, 85.9% are expecting the number of people using their facilities to increase, while 14.1% expect no change, and none expect to see a decline. And in 2024, 84.1% of Y respondents are expecting usage of their facilities to increase, while 14.5% expect no change and 1.4% expect a decrease.
Respondents from Ys were just slightly more likely than others in 2023 to indicate that they have plans for construction over the next few years. Some 67.1% of Y respondents in 2023 have construction plans, compared with 64.9% of non-Y respondents. This is down from 74.5% of Y respondents in 2022 who had plans for construction, but still higher than 2021, when 66.7% were planning construc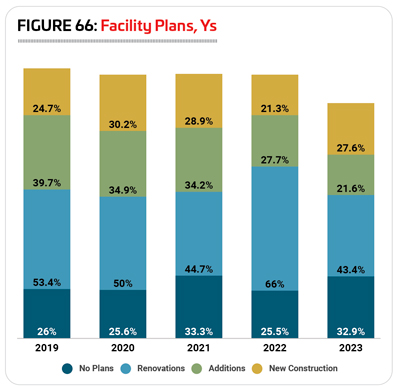 tion. Some 43.4% of Y respondents said they were planning renovations to their existing facilities, down from 66% in 2022. Another 21.6% were planning additions to their existing facilities, down from 27.7%. And 27.6% said they were planning new construction, up from 21.3%. (See Figure 66.)
Y respondents in 2023 were planning to spend an average of $4,134,000 on their construction plans. The highest planned construction budget was $25 million, and the median construction budget was $1,725,000.
The 10 features most commonly found in Y respondents’ facilities in 2023 include: classrooms and meeting rooms; indoor courts for sports like basketball and volleyball; locker rooms; fitness centers; exercise studio rooms; playgrounds; Wi-Fi services; childcare centers; bleachers and seating; and indoor aquatic facilities.
Fewer Y respondents were planning to add features at their facilities over the next three years. Some 41.3% said they had such plans, down from 48.9% in 2022. This compares with 47% of non-Y respondents in 2023 who are planning to add features at their facilities.
The most commonly planned additions for Y respondents in 2023 were:
1. Park shelters (36.4% of Y respondents with plans to make additions were planning to add park shelters)
2. Playgrounds (30.3%)
3. Outdoor sports courts (27.3%)
4. Synthetic turf sports fields (27.3%)
5. Classrooms and meeting rooms (27.3%)
6. Childcare center (27.3%)
7. Park restroom structures (24.2%)
8. Splash play areas (21.2%)
9. Open spaces such as gardens and natural areas (21.2%)
10. Locker rooms (21.2%)
Programming
As usual, 100% of Y respondents said they offer programming of some kind at their facilities. This compares with 95.5% of non-Y respondents.
The programs most commonly offered at Y respondents’ facilities in 2023 include: day camps and summer camps (provided by 93.7% of Y respondents); holidays and other special events (84.8%); youth sports teams (82.3%); educational programs (75.9%); fitness programs (74.7%); group exercise programs (74.7%); teen programming (70.9%); mind-body balance programs like yoga or tai chi (68.4%); swimming programs (68.4%); and daycare or preschool programs (63.3%).
The number of Y respondents with plans to add programs at their facilities has grown over the past few surveys. In 2023, more than half (51.9%) of Y respondents said they had plans to add programs at their facilities, up from 42.6% in 2022 and 34.2% in 2021. This compares with 40.7% of non-Y respondents in 2023 who said they plan to add programming at their facilities.
The 10 most commonly planned program additions for Ys in 2023 were:
1. Nutrition and diet counseling (up from No. 9)
2. Adult sports teams (did not appear in this list in 2022)
3. Educational programs (up from No. 6)
4. Teen programming (down from No. 1)
5. Environmental education (up from No. 8)
6. Special needs programs (did not appear in 2022)
7. Sports tournaments and races (did not appear in 2022)
8. Performing arts (down from No. 2)
9. Sport training, such as golf or tennis lessons (down from No. 3)
10. Aquatic exercise programs (did not appear in 2022)
In 2023, adult sports teams, special needs programs, sports tournaments and races, and aquatic exercise programs rose into the top 10, replacing arts and crafts programs, group exercise programs, functional fitness programs, and youth sports teams.
Top Challenges
As was the case last year, Ys overwhelmingly named staffing issues as the top concern for their facilities. Nearly three-quarters (74.6%) of Y respondents in 2023 said staffing was their top concern, compared with 58.8% of non-Y respondents and down just slightly from 77.3% in 2022.
A smaller number of Y respondents named other issues as top challenges for their facilities. The next most common was safety and risk management, a top concern for around a third (33.8%) of Y respondents, and 24.5% of non-Y respondents.
More than three in 10 (32.4%) also named equipment and facility maintenance as a top challenge, but they were much less likely to consider maintenance a concern than non-Y respondents (50.5%). RM
