


Survey Methodology
This report is based on a survey conducted for Recreation Management by Stamats Inc., an independent research company. An e-mail was broadcast and respondents were invited to participate. From the launch of the survey on 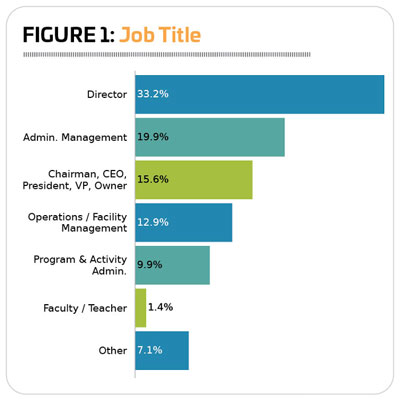 Feb. 6, 2023, to the closing of the survey on March 27, 2023, 1,182 responses were received. The findings of this survey may be accepted as accurate, at a 95% confidence level, within a sampling tolerance of approximately +/- 2.8 percent.
There’s no denying the myriad challenges of the past several years, from the shutdowns and social distancing requirements of the coronavirus pandemic to the staffing challenges, supply chain disruptions, inflationary pressures and more. Despite these difficulties, the professionals who have been navigating aquatic, recreation, sports and fitness facilities through the turmoil have remained content with the work that they do. And that makes sense—most respondents have logged a lot of years working in this industry, and they are generally more educated and more highly paid than the average American.
Welcome to our 16th Annual Salary Survey! Over the next handful of pages, we’ll reveal what respondents to the Industry Report survey had to tell us about their experience, their salaries, and their satisfaction with their work.
 All About the Respondents
Editor’s Note: For more details on respondents to the Industry Report survey, including the types of organizations they represent and the regions they hail from, read our Annual State of the Industry Report, featured in the June 2023 issue, and found online at recmanagement.com/industry-research.
Given that readers of Recreation Management magazine tend to hold decision-making positions, it comes as no surprise to find that survey respondents tend to be older professionals. Nearly half (45.9%) said they were 55 years old or older. And another 27.4% were between the ages of 45 and 54. Around one-fifth (19.6%) were between the ages of 35 and 44. Just 7.1% were younger than 35.
Ethnically, the survey population is not very diverse, with 88.3% of respondents indicating they are white, representing little change from 2022, when 89% were white. Just 4.9% of respondents were Hispanic (up from 3.9% in 2022), 3.8% were black, 1.3% were Asian/Pacific Islanders, and 0.9% were Native American or Alaskan Natives. The remaining 2% represented “other” or “unknown” 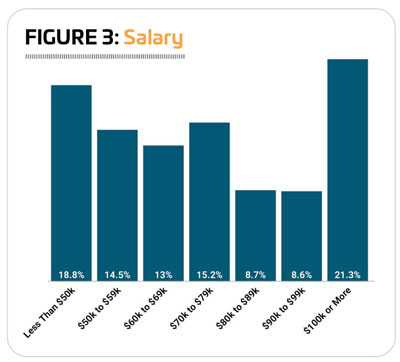 ethnicities.
Respondents to the survey tend to hold leadership positions, and the largest number—around a third at 33.2%—said they were directors at their organizations. The next largest group, at 19.9%, were in administration and management positions, including titles such as administrator, manager or superintendent. Another 15.6% of respondents were chairman, CEO, president, vice president or owner of their organizations. Professionals in operations and facility management made up 12.9% of the respondents. This includes titles such as operations manager, facility manager, building manager and supervisor. Another 9.9% of respondents were in program and activity administration, including activity or program directors, managers, coordinators, specialists, coaches and instructors. A very small number—1.4%—were faculty or teachers. Finally, 7.1% said they were in “other,” unspecified job roles. (See Figure 1.)
Experience Adds Up
 Respondents to the Industry Report survey were highly likely to have completed a degree. In fact, more than three-quarters (78.3%) said they had earned at least a bachelor’s degree. Some 43.7% had a bachelor’s degree, 32.7% had a master’s degree, and 1.9% had an advanced degree, like a Ph.D. Another 5.8% of respondents said they had earned a two-year associate’s degree, and 12.3% had attended college without earning a degree. Finally, 3.7% said that a high school diploma was their highest level of educational achievement.
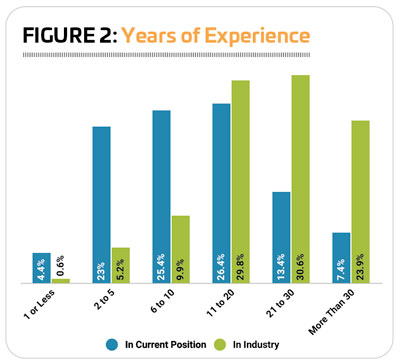
The average respondent to the Industry Report survey has held their current position for 13.3 years, up from 12.3 in 2022 and 11.7 in 2021. Slightly more than one-fifth (20.8%) have been in their current position for more than 20 years, representing virtually no change from 2022 (20.7%). Another 26.4% have been in their current position for 11 to 20 years, up from 25.1% in 2022. A similar number (25.4%) have been in their current position for between six and 10 years. Finally, 27.4% have been in their current position for five years or less.
 Respondents have racked up even more experience in the industry, with an average of 23.2 years, up from 21.9 years in 2022. Well over half (54.5%) said they have been working in the industry for more than 20 years, representing virtually no change from 2022 (54.9%). Nearly a fifth (23.9%) have been working in the industry for 30 years or more. Another 29.8% have been involved in the industry for between 11 and 20 years. Some 9.9% have been working in this industry for six to nine years, and just 5.8% have been working in the industry for five years or less. (See Figure 2.)
Enough Chitchat, Let’s Talk Money
In 2023, the average respondent reported an annual salary of $101,090. The maximum salary reported was $2.5 million, and the median salary was $71,000.
More than one-fifth (21.3%) of respondents said their annual salary was $100,000 or more. Another 17.3% earned between $80,000 and $99,999. More than a quarter (28.2%) earned between $60,000 and $79,999. One-third (33.3%) earned less than $60,000 a year. (See Figure 3.)
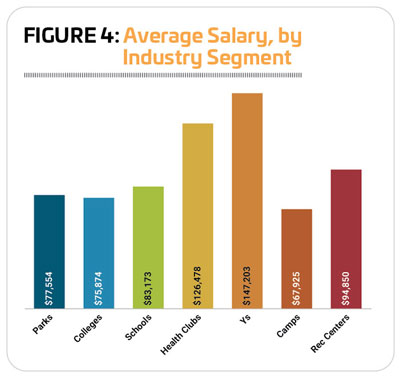
 When it comes to industry segment, the highest salaries were earned by respondents working for YMCAs and similar facilities, and health clubs. Y respondents reported earning an average salary of $147,203—45.6% higher than the average for all respondents, though interestingly these respondents had the lowest median salary at $60,000. Health club respondents reported earning an average salary of $126,4790—25.1% higher than the average for all respondents. Their median salary was $64,500. (See Figure 4.)
Respondents from rec centers and schools were the next highest earners, with rec center respondents reporting an average salary of $94,850 (and a median salary of $65,000) and school respondents reporting an average salary of $83,173 (and a median salary of $87,000). They were followed by park respondents, who reported an average salary of $77,554 (with a median salary of $72,000) and college respondents, who reported an average salary of $75,874 (with a median salary of $71,000). The lowest earners were respondents from camps, who reported an average salary of $67,925 (with a median salary of $62,000).
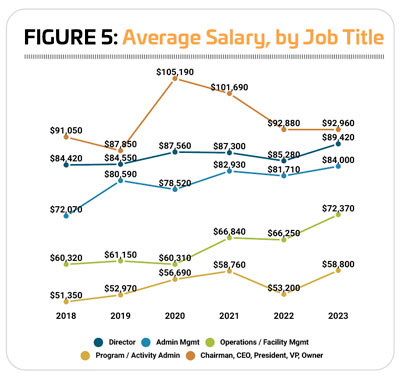
Considered by job roles, the highest-paid respondents held the position of CEO, president or a similar position. They reported an average salary in 2023 of $92,960, representing an increase of just 0.1% over 2022, when their average salary was $92,880. They were followed by respondents in 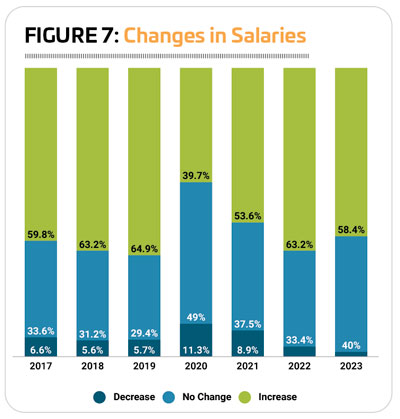 the director positions, who had an average salary in 2023 of $89,420, a 4.9% increase over 2022, when their average salary was $85,280. Respondents holding administration and management positions reported an average salary in 2023 of $84,000, an increase of 2.8% from $81,710 in 2022. Respondents in operations and facility management reported an average salary in 2023 of $72,370, a 9.2% increase from 2022, when their average salary was $66,250. Finally, respondents in program and activity administration reported an average salary in 2023 of $58,800, an increase of 10.5% from the average in 2022 of $53,200, making the lowest-paid respondents the biggest winners in terms of year-over-year salary growth. (See Figure 5.)
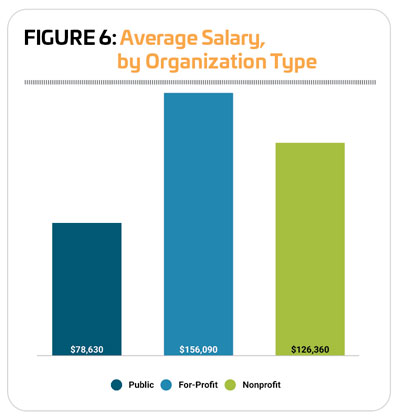
Considered by organization type, it comes as little surprise that the highest-paid respondents worked for private, for-profit organizations. For these respondents, the average salary in 2023 was $156,090, 54.4% higher than the average salary of all respondents ($101,090). They were followed by respondents working for private, nonprofit organizations. Their average salary in 2023 was $126,360, 25% higher than the average for all respondents. Finally, respondents working for public or governmental organizations reported an average annual salary of $78,630, 22.2% lower than the average annual salary for all respondents. (See Figure 6.)
As was the case with so many other data points covered b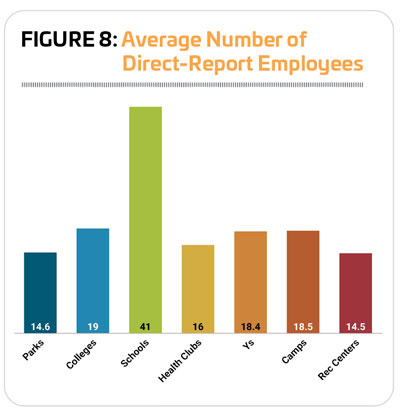 y the Industry Report survey, the typically reported salary increases saw a departure from the norm in the year 2020. Where in most years, well over half of respondents to the survey report that their salaries have increased, in 2020, 39.7% reported an increase, and 11.3% reported a decrease. That was a short-lived trend, though, and in 2021, salary increases began to shift back toward expectations, with 53.6% of respondents reporting an increase in that year.
2022 saw a return to pre-pandemic trends, with 63.2% of respondents reporting that their salaries increased year-over-year. Another third (33.4%) saw no change to their salaries in 2022, and just 3.4% reported a decrease.
Looking into expectations for 2023, nearly six in 10 (58.4%) respondents said they expect to see their salaries increase this year. Another 40% are expecting no change, and just 1.6% are anticipating a decrease to their salaries. (See Figure 7.)
On the Job
On average, respondents said they have 18.5 employees reporting directly to them, representing virtually no change from 2022 (18.2). The greatest number of direct reports was 600, and the median was eight.
Respondents from schools had the largest number of direc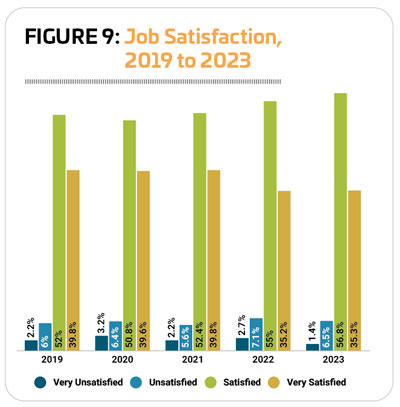 t reports, with an average of 41. The largest number of direct reports for school respondents was 600, and the median was 20. All other industry segments fell more closely in line with the across-the-board average, ranging from lows of 14.5 (for rec centers) and 14.6 (for parks) to highs of 19 (colleges), 18.5 (camps) and 18.4 (Ys). Health clubs fell in the middle of this group, with an average of 16 direct reports. (See Figure 8.)
When it comes to job satisfaction, professionals working in aquatics, recreation, sports and fitness are a relatively happy lot. Even in the midst of the pandemic and the challenges around staffing that have followed on its heels, job satisfaction amongst survey respondents has remained very high, and it even ticked up a notch this year. More than one-third (35.3%) of survey respondents said they are very satisfied in their current position (representing virtually no change from 2022, when 35.2% were very satisfied), and 56.8% said they were satisfied in their current position (up from 55% in 2022). Just 6.5% of survey respondents said they were unsatisfied with their current position, and 1.4% were very unsatisfied, the lowest number reported in at least the past five years. (See Figure 9.) RM
