


In this section of the report, we’ll examine the survey responses from schools and school districts.
Nearly half of respondents from schools were located in the Northeast in 2024. Some 47.6% of school respondents said they call the Northeastern region of the U.S. home. They were followed by the Midwest, where 28.6% of school respondents are located. Another 9.5% are located in the South Atlantic region, and 9.5% are also located in the South Central region of the U.S. Just 4.8% of school respondents said they were from the West.
In a departure from the norm, school respondents were not most likely to be located in rural communities in 2024. Instead, more than half (52.4%) of school respondents said they were located in suburban areas. The remainder were divided evenly between urban communities (23.8%) and rural areas (23.8%). 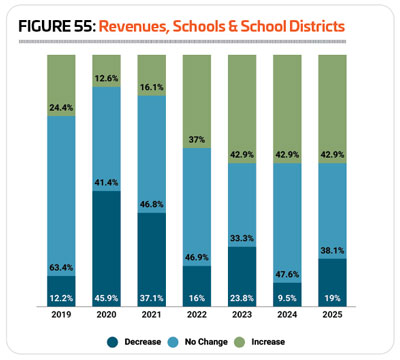
School respondents were most likely to work for public schools, rather than private schools. In fact, nearly three-quarters (74%) of school respondents said they were with public schools or school districts. Another 15.6% were with private, nonprofit schools, and 9.4% said they worked with private, for-profit schools.
On average, school respondents said they serve 6,400 people per year, down slightly from 6,780 in 2023. This reflects a high of 86,500, and a low of 180. The median audience size for schools is 1,250 people, up from 600 in 2023.
On average, school respondents said they manage 5.3 facilities, down from 9.2 in 2023. More than half (56.5%) of school respondents said they manage between one and three individual facilities. Another 26% manage between four and nine facilities, and 17.4% manage 10 or more individual facilities.
Respondents from schools and school districts were only slightly less likely than others to report that they had partnered with outside organizations in 2024. Some 84% of school respondents said they had partnered with others, up from 82.2% in 2023. This compares with 85.4% of non-school respondents who had partnered with other organizations in 2024.
The most common partners for school respondents include: other local schools (76% of school respondents had partnered with other local schools); nonprofit organizations (32%); local government (28%); colleges and universities (24%); corporations and local businesses (12%); and state government (12%).
When it comes to the age group they work with, school respondents were most likely to report that teens between the ages of 13 and 18 made up their primary audience. Half (50%) of school respondents said their primary audience was teenagers, compared with just 3.9% of non-school respondents. Another 19.2% of school respondents said they served an all-ages audience, and 15.4% primarily reach children ages 4 to 12. Another 11.5% of school respondents primarily work with infants and toddlers, and 3.8% said their audience is primarily made up of adults.
Revenues & Expenditures
Respondents from schools and school districts were more likely in 2023 than 2022 to report that their revenues increased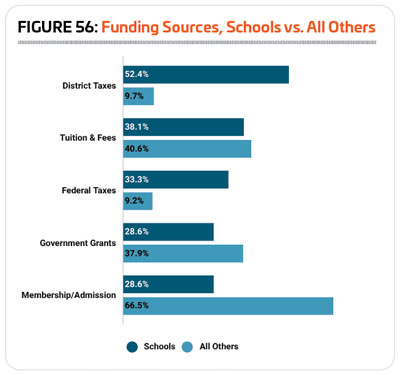 or decreased. Some 42.9% of school respondents said their revenues increased in 2023, while 37% reported an increase in 2022. And 23.8% of school respondents reported that their revenues decreased in 2023, compared with 16% reporting a decrease in 2022. One-third (33.3%) of school respondents said their revenues remained unchanged in 2023. (See Figure 55.)
The number of school respondents who expect to see their revenues increase in 2024 and 2025 holds steady at 42.9%, the same number who reported an increase in 2023. Nearly half (47.6%) of school respondents said they expect their revenues to remain unchanged in 2024, while 9.5% are anticipating a decrease. And 38.1% of school respondents said they expect their revenues to hold steady in 2025, while 19% expect revenues to decline.
In 2024, school respondents spent an average of $3,279,000 on their operating expenses. The highest reported operating cost was $32 million, while the median cost was $300,000.
School respondents projected a 25.6% increase to their average operating cost from 2023 to 2024, to an average of $4,120,000.
On average, school respondents in 2024 said they earn back 61.1% of their costs via revenues, reflecting a high of 100% and a low of 5%. The median cost recovery rate for schools in 2024 was 75.5%.
Respondents from schools were much more likely to receive funding from taxes than other respondents. More than half 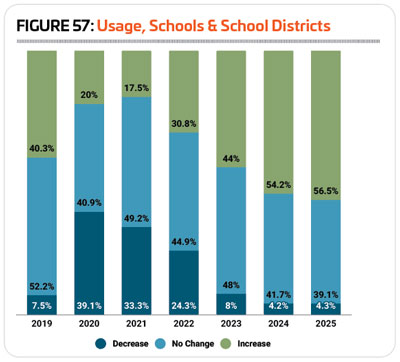 (52.4%) of school respondents said they received funding via district taxes, compared with 9.7% of non-school respondents. And one-third (33.3%) of school respondents said they received funding via federal taxes, compared with just 9.2% of non-school respondents. The other most common sources of funding for schools and school districts were tuition and fees (38.1% of school respondents said they received funding via tuition and fees), government grants (28.6%) and membership or admission fees (28.6%). (See Figure 56.)
Respondents from schools and school districts were much more likely in 2024 to report that they had taken action over the past several years to reduce their operating expenditures. Some 90.5% of school respondents in 2024 had taken such action, up from 73.4% in 2023 and 63.8% in 2022. This compares with 82.9% of non-school respondents in 2024 who had taken action to reduce their costs.
School respondents were most likely to indicate that they had improved energy efficiency as a method to reduce their operating expenditures. Some 57.1% of school respondents said they had improved their energy efficiency, up from 38% in 2023. Other actions school respondents had taken to reduce their costs include: increasing fees (42.9%), putting construction or renovation plans on hold (42.9%), and reducing staff (38.1%).
Facilities & Amenities
Respondents from schools and school districts were more likely to report that the number of people using their facilities had increased in 2023 than in any year since before the pandemic, while being far less likely to report a decrease. Some 44% of school respondents said the number of people using their facilities had increased in 2023, up from 30.8% in 2022, 17.5% in 2021 and 20% in 2020. Another 48% of school respondents said the number of people using their facilities remained the same in 2023, and 8% reported a decrease. (See Figure 57.)
More than half of school respondents said they expected the number of people using their facilities to increase in 2024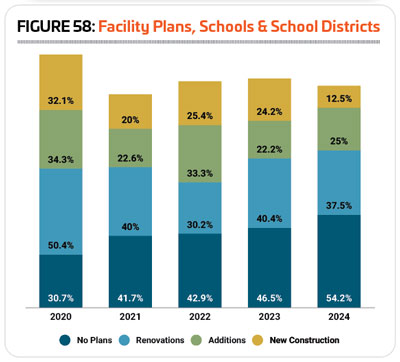 (54.2%) and 2025 (56.5%). Some 41.7% of school respondents expect no change in 2024, and 39.1% are anticipating no change in 2025, while around 4% are expecting to see usage decline in both of those years.
The number of school respondents who are planning construction at their facilities has fallen over the past few years, and in 2024, less than half (45.8%) of school respondents said they are planning construction. This is down from 53.5% in 2023, 57.1% in 2022 and 58.3% in 2021. This compares with 69.1% of non-school respondents in 2024 who have plans for construction over the next several years.
School respondents were most likely to be planning renovations to their existing facilities. Some 37.5% of respondents said they had renovations planned, down from 40.4% in 2023. Another 25% of school respondents said they are planning additions to their existing facilities (up from 22.2%), and 12.5% said they are planning new construction, down from 24.2%. (See Figure 58.)
School respondents in 2024 were planning to spend an average of $1,315,000 on their construction plans. The highest planned construction budget was $10 million, and the median cost was just $100,000.
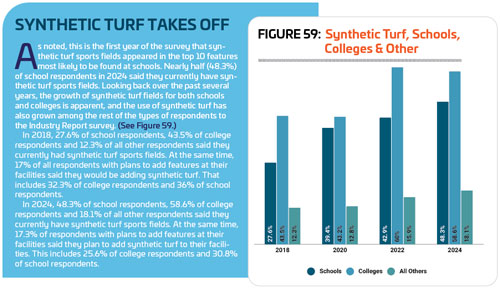
The most common features found in school respondents’ facilities tend to support youth sports and physical education activities. They include: locker rooms, indoor courts for sports like basketball and volleyball, classrooms and meeting rooms, bleachers and seating, natural turf sports fields, outdoor courts for sports like tennis or basketball, concession areas, fitness centers, playgrounds and synthetic turf sports fields. Note that this is the first time that synthetic turf fields have appeared in this list of top amenities for schools.
Some 43.3% of school respondents in 2024 said they had plans to add features at their facilities over the next few years,
up from 38.5% in 2023 and 23.8% in 2022. This compares with 47.1% of non-school respondents in 2024 who have plans to add features to their facilities.
The most commonly planned features for school respondents in 2024 include:
1. Synthetic turf sports fields (30.8%)
2. Outdoor running tracks (30.8%)
3. Playgrounds (23.1%)
4. Concession areas (23.1%)
5. Open spaces including gardens and natural areas (15.4%)
6. Natural turf sports fields (15.4%)
7. Locker rooms (15.4%)
Programming
More than nine out of 10 (92.3%) school respondents said they currently offer programming of some kind at their facilities, down from 97% in 2023 and 93.7% in 2022.
In most years, the most common program offering for school respondents is youth sports. This year, however, youth sports fell to the third most common program offering for schools and school districts. The most common program for school respondents in 2024 was educational programs, provided by 79.2% of respondents’ facilities. The other most common program types for schools were: holiday events and other special events (provided by 75% of school respondents), youth sports teams (66.7%), individual sports activities such as running clubs (58.3%), swimming programs (58.3%), day camps and summer camps (58.3%), sports tournaments and races (50%), sport training such as golf or tennis lessons (45.8%), and special needs programs (45.8%).
Respondents from schools and school districts continued to be among those least likely to be planning to add programs at their facilities over the next few years. Some 19.2% of school respondents in 2024 said they had plans to add programs, compared with 44.6% of non-school respondents. This is down just slightly from 2023, when 20.8% of school respondents had plans to add programs, but still higher than 2022 (12.7%) and 2021 (14.7%).
The top planned program additions for school respondents include fitness programs, group exercise programs and aquatic exercise programs. Fewer school respondents said they were planning to add environmental education programs, educational programs, adult sports teams, teen programming, programs for active older adults, sport training such as tennis lessons or golf instruction, daycare or preschool programs, sport tournaments or races, adaptive sports programs, and personal training. RM
