


In the next few pages, we’ll examine the answers to the Industry Report survey from respondents working for colleges and universities, who made up 13.1% of the total survey respondents in 2024, up from 10.2% in 2023.
College respondents were most likely to be from the Midwest or South Central regions of the U.S. Some 29.6% of college respondents were located in the Midwest, and 23.9% were to be found in the South Central states. Another 19.7% were located in the West, and 18.3% were in the Northeast. Just 8.5% of college respondents said they were located in the South Atlantic region.
College respondents were most likely to be located in suburban communities, with 39.4% indicating they are located in a suburban area. Another 35.2% said they were from urban communities, and 25.4% were located in rural areas.
On average, college respondents said they serve 422,000 patrons per year, though the median number of patrons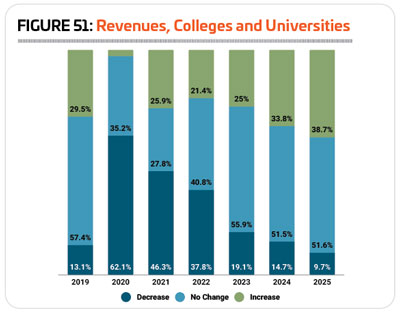 reached per year was 12,000, up from 4,000 in 2023.
Nearly seven out of 10 (69.8%) college and university respondents said they worked for public schools. Another 23% were with private, nonprofit schools, and 7.1% worked for private, for-profit colleges.
On average, college respondents manage just two individual facilities, down from 6.4 in 2023, and 3.2 in 2022. Some 60.4% of college respondents said they manage between one and three individual facilities, compared with 50.2% of non-college respondents. Non-college respondents were twice as likely to manage 10 or more facilities as college respondents, with 11% of college respondents reporting that they manage 10 or more, and 22.6% of non-college respondents reporting that they manage 10 or more facilities.
College and university respondents were somewhat less likely than others to report that they had partnered with other organizations, though a majority had done so. Some 82.6% of college respondents said they had formed partnerships with other organizations (representing virtually no change from 82.9% in 2023), compared with 85.8% of non-college respondents.
While they were less likely overall to form partnerships, college and university respondents were more than twice as likely as non-college respondents to partner with other colleges and universities. More than two-thirds (67.4%) of college respondents said they had formed such partnerships, compared with just 33.1% of non-college respondents. The next most common partners for college respondents include: local schools (27% of college respondents had partnered with local schools), corporations or local businesses (22.1%), nonprofit organizations (18.6%), and local government (11.6%).
Revenues & Expenditures
After being extremely hard-hit by the coronavirus pandemic—62.1% of college respondents saw a decrease in revenue in 2020, and 46.3% reported a decrease in 2021—colleges and universities have slowly returned to trends more typical before the pandemic hit. In 2023, 25% of college respondents said the revenue at their facilities was higher than in 2022. Another 55.9% reported no change, and 19.1% reported a decrease. (See Figure 51.)
In 2024, around one-third (33.8%) of college respondents said they are expecting their revenues to increase, while 51.5% anticipate no change, and 14.7% are expecting a decrease. And in 2025, 38.7% expect higher revenues, with 51.6% expecting no change and 9.7% expecting a decrease.
In 2023, college respondents spent an average of $6,763,000 on their operating expenses. The highest reported operating cost was $107 million, and the median was $1,004,000.
College respondents expect very little change to their operating costs in the next two years, reporting a 0.2% increase from 2023 to an average of $6,779,000 in 2024, and then a decrease of 0.7% in 2025 to an average of $6,734,000.
On average, college respondents said they earn back 65.5% of their operating costs via revenues. This reflects a high of 100% and a low of just 5%. The median cost recovery rate for colleges and universities was 80%.
The top source of revenues for college and university respondents’ facilities comes from tuition and fees. Nearly nine out 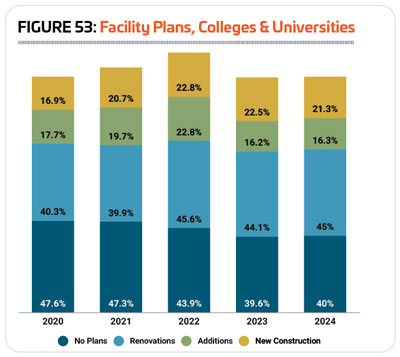 of 10 (88.2%) of college respondents said tuition and fees were a source of funding for their facilities, compared with 34.2% of non-college respondents. The next most common sources of funding for college respondents were: membership and admission fees (66.2%), facility rentals and private events (63.2%), and private donations from individuals (35.3%).
Over the past four years, college respondents have been more likely than other respondents to report that they have taken action to reduce their operating expenses. In 2024, 86.8% of college respondents had taken such action, up from 85.9% in 2023. This compares with 82.7% of non-college respondents in 2024 who had taken action to reduce their expenses (virtually unchanged from 83% in 2023).
The most common ways college respondents reduced the operating costs were reducing their hours of operation (58.8% of college respondents vs. 23.6% of non-college respondents), putting construction or renovation plans on hold (41.2% vs. 33.3%), reducing staff (39.7% vs. 26.2%), and cutting programming or services (36.8% vs. 18.1%). While increasing fees was the most common way for all respondents to tackle their operating costs, college respondents were less likely than others to take this approach, with 30.9% indicating they had increased fees, compared with 53.3% of non-college respondents.
Buildings & Amenities
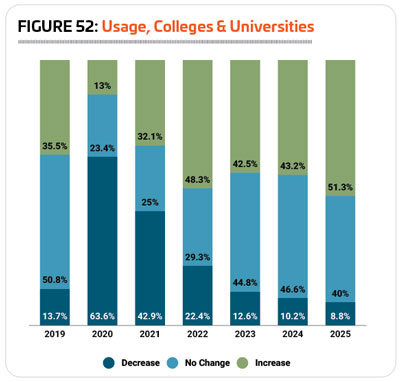
The number of college respondents reporting that the number of people using their facilities has decreased year-over-year has fallen steadily since the dramatic numbers of 2020, when 63.6% reported a decrease. In 2023, just 12.6% of college respondents said the number of people using their facilities decreased. Another 44.8% reported no change, and 42.5% reported an increase. (See Figure 52.)
In 2024, 43.2% of college respondents said they expect the number of people using their facilities to increase, while 46.6% are anticipating no change and 10.2% are expecting a decrease. And in 2025, more than half (51.3%) of college respondents are expecting an increase in usage of their facilities, while 40% expect no change and 8.8% expect a decrease.
Respondents from colleges and universities were less likely than other respondents in 2024 to report that they had plans for construction over the next few years. Some 60% of college respondents said they had such plans (virtually unchanged from 60.4% in 2023), compared with 69.4% of non-college respondents.
The number of college respondents planning different types of
construction changed only negligibly in 2024. Some 45% of college respondents were planning renovations to their existing facilities, up from 44.1% in 2023. Another 16.3% were planning additions to their existing facilities, compared with 16.2% in 2023. And 21.3% were planning new construction, down only slightly from 22.5%. (See Figure 53.)
College respondents in 2024 were planning to spend an average of $16.9 million on their construction plans. The highest planned construction budget was $448 million, and the median cost was $1 million, down from $2 million in 2023.
The 10 features most commonly found among college respondents’ facilities in 2024 include: fitness centers, locker rooms, indoor sports courts for sports like basketball and volleyball, classrooms and meeting rooms, exercise studio rooms, bleachers and seating, outdoor sports courts for sports like basketball and tennis, indoor aquatic facilities, synthetic turf sports fields, and indoor walking and running tracks.
College respondents were much less likely than others to report in 2024 that they had plans to add any features to their facilities over the next few years. Some 33.1% of college respondents had such plans, compared with 49.1% of non-college respondents. This is down slightly from 2023, when 35.8% of college respondents were planning to add features.
The most commonly planned additions for college respondents in 2024 include:
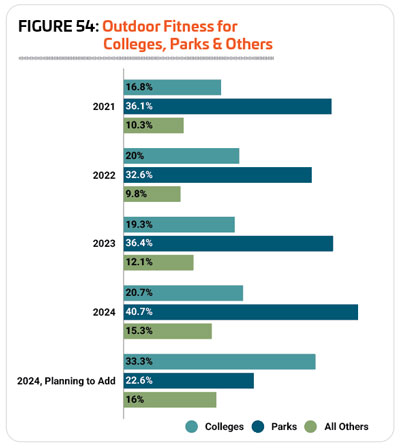
1. Fitness trails and outdoor fitness equipment (33.3% of college respondents with plans to add features will add outdoor fitness areas)
2. Synthetic turf sports fields (25.6%)
3. Locker rooms (25.6%)
4. Bleachers and seating (17.9%)
5. Outdoor sports courts (15.4%)
6. Fitness centers (15.4%)
7. Natural turf sports fields (15.4%)
8. Classrooms and meeting rooms (15.4%)
9. Climbing walls (15.4%)
10. Walking and hiking trails (15.4%)
Programming
Some 93% of college respondents said they provide programming at their facilities in 2024, down from 98.2% in 2023.
The most common type of programming offered by college respondents’ facilities continues to be fitness programs. Some 81.3% of college respondents said they currently offer fitness programs, down from 83% in 2023.
The next most common programs at colleges and universities include group exercise programs (76.3%, virtually unchanged from 76.8% in 2023), mind-body balance programs like yoga (71.3%, up from 67.9%), functional fitness programs (62.5%, up from 60.7%), adult sports teams (60%, up from 58%), personal training (56.3%, down from 57.1%), sports tournaments and races (50%, down from 51.8%), educational programs (48.8%, down from 50.9%), individual sports activities such as running clubs (46.3%, down from 61.5%), and swimming programs (45%, down from 50.9%).
Nearly one-third (32.6%) of college respondents in 2024 said they had plans to add more programs at their facilities over the next few years. This is down from 36.8% in 2023, and 35.1% in 2022, but still higher than the number who had such plans in 2021 (29.8%).
The most commonly planned program additions for college and university respondents in 2024 include:
1. Functional fitness programs (up from No. 2 in 2023)
2. Aquatic exercise programs (down from No. 1)
3. Educational programs (up from No. 7)
4. Holiday events and other special events (did not appear in the top planned programs for 2023)
5. Group exercise programs (up from No. 8)
6. Special needs programs (did not appear in 2023)
7. Swimming programs (did not appear in 2023)
Several different types of programs were tied for the eight spot, including personal training, camping programs, water sports like kayaking, sports tournaments and races, and fitness programs.
Falling off the list of top planned programs for 2023 were nutrition and diet counseling, day camps and summer camps, environmental education, programs for active older adults, sport training like golf lessons, youth sports teams, adaptive sports programs and climbing programs. RM
