


In the next few pages, we’ll examine how the answers of respondents from parks and recreation agencies stack up. This includes parks departments, park districts, state park districts and similar organizations. Always the largest group of respondents to the survey, this cohort comprises 42.5% of the total survey population, up from 31.5% in 2023.
As usual, park respondents were most likely to be from the Midwest or West. More than one-quarter of park respondents
were located in the Midwest (29.7%), and slightly fewer were located in the Western region of the U.S. (27.3%). Another 16.8% of park respondents were from the South Atlantic region, 14.1% were from the Northeast, and 11.7% were from the South Central region of the U.S. A single park respondent (representing 0.4% of the response) was from outside the United States.
More than half (50.8%) of park respondents said they were located in suburban communities. Another 26.2% were located in rural communities and 23% were found in urban areas.
On average, park respondents said they serve 528,000 patrons in a given year, though the median response was 20,000.
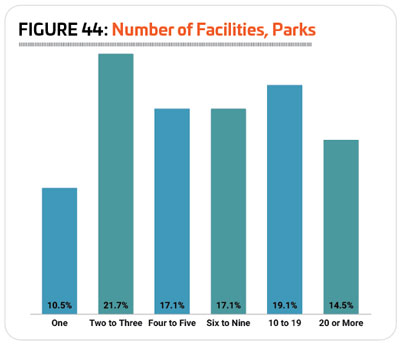
Park respondents manage an average of 9.4 separate facilities, down from 13.3 in 2023. The maximum number of individual facilities managed by a park respondent was 50, and the median was six. More than one-third (33.6%) of park respondents said they manage 10 or more facilities, down from 37.6% in 2023. This compares with just 9.1% of non-park respondents. At the other end of the spectrum, just 10.5% of park respondents manage only a single facility, compared with 34.9% of non-park respondents. Another 21.7% of park respondents said they manage two to three individual facilities, while 17.1% manage four to five facilities, and 17.1% manage between six and nine separate facilities. (See Figure 44.)
As you might expect, park respondents were most likely to report that their audience was made up of all ages. Some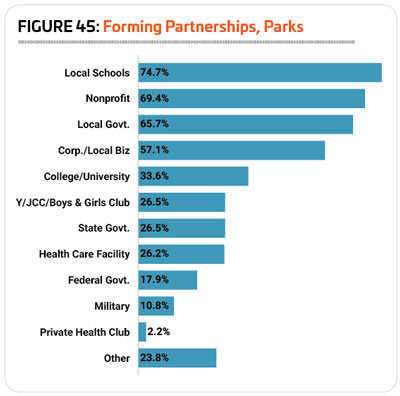 60.1% of park respondents said they reach all ages, compared with 39.1% of non-park respondents. Another 19.9% of park respondents said their primary audience was made up of children ages 4 to 12, and 12% primarily reached adults. Far fewer park respondents said they primarily served teenagers (4.3%), seniors (2.8%), infants and toddlers (0.6%) or college students (0.3%).
A majority of park respondents (92.9%) said they have partnered with other organizations, down only slightly from 2023, when 93.4% worked with outside organizations. This compares with 80% of non-park respondents in 2024 who said they partner with other organizations. The most common partners for parks were local schools, with nearly three-quarters (74.7%) of park respondents indicating they had partnered with them, down from 76.2% in 2023. They were followed by nonprofit organizations (69.4%, up from 66%), local government (65.7%, up from 63%) and corporations and local businesses (57.1%, up from 52.6%). (See Figure 45.)
Revenues & Expenditures
After a couple of difficult years in 2020 and 2021 in terms of revenue, when the pandemic impact led to unexpected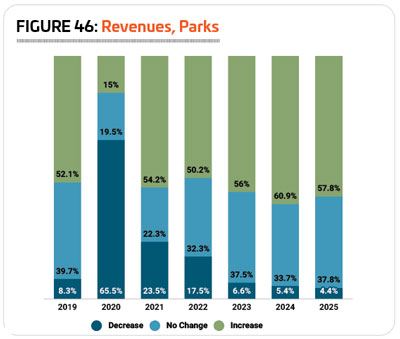 challenges, park respondents have largely recovered, with revenues increasing for 56% of park respondents in 2023, while 37.5% reported no change and 6.6% reported a decrease. (See Figure 46.)
Looking forward, park respondents are expecting a similar picture for revenues over the next couple of years. In 2024, 60.9% of park respondents are anticipating their revenues to increase, while 33.7% expect no change and 5.4% are expecting a decrease. And in 2025, 57.8% of park respondents expect increased revenues, while 37.8% are anticipating no change, and 4.4% are expecting revenues to drop.
In 2023, park respondents spent an average of $3,597,000 on their operating expenses, reflecting a 16% increase from 2022’s average of $3,102,000. However, at the same time, the median expenditure for park respondents fell 1.7%, from a median of $695,000 in 2022 to $683,000 in 2023.
Looking forward, the average operating cost for park respondents falls 22.7% between 2023 and 2025, to an average of $2,781,000. At the same time, the median expenditure fell even more steeply, dropping 34.8% to a median cost of $445,000.
On average, park respondents said they recover 51.6% of their operating costs via revenues, but the actual cost recovery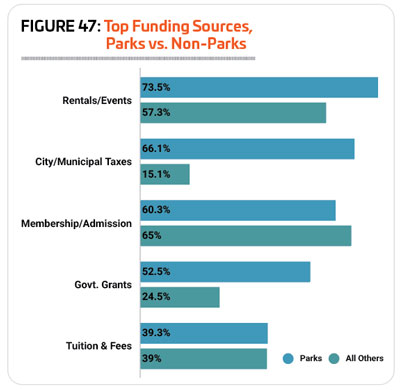 rates vary widely from one respondent to another, with the highest reported recovery rate at 100% and the lowest at 0.
The top source of funding for park respondents’ facilities came from rentals and private events. Nearly three-quarters (73.5%) of park respondents said they received funding for their facilities via rentals and private events, compared with 57.3% of non-park respondents. Around two-thirds (66.1%) of park respondents received funding for their facilities from city or municipal taxes, compared with just 15.1% of non-park respondents. Park respondents were also much more likely than others to receive funding via government grants, with 52.5% of park respondents indicating this as a source of funding, compared with 24.5% of non-park respondents. While membership and admission fees were the third most common source of funding for parks respondents, with 60.3% indicating they receive funding this way, this was a more common source of funding for non-park respondents, 65% of whom indicated they receive funding via membership and admission fees. (See Figure 47.)
Park respondents in 2024 were just slightly more likely than in 2023 to report that they had taken action over the past several years to reduce their operating costs. Some 81.3% of park respondents in 2024 had taken such action, up from 80.3% in 2023, but still below the 84.1% reported for 2022. This compares with 85.8% of non-park respondents in 2024 who had taken action to reduce their costs, representing virtually no change from 2023 (85.5%).
The most common measures park respondents in 2024 relied on to reduce their operating costs included: increasing fees (55%, up from 53.2%); improving energy efficiency (39.4%, up from 35.9%); putting construction or renovation plans on hold (34.7%, virtually unchanged from 34.2%); reducing their hours of operation (27.1%, down from 29.9%); and reducing staff (23.9%, down from 29.6%).
Facility Use & Construction Plans
After a major impact on attendance and usage of park facilities in the early phase of the pandemic in 2020, park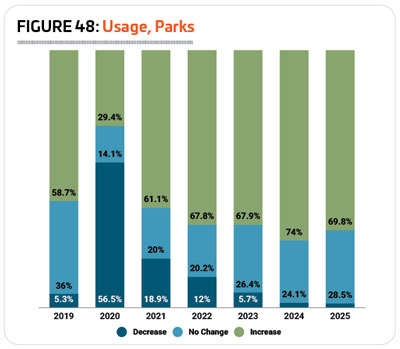 respondents have seen growing usage since, with more than two-thirds of respondents in 2022 (67.8%) and 2023 (67.9%) reporting an increase in the number of people using their facilities. At the same time, 20.2% of respondents saw no change in the number of people using their facilities in 2022 and 26.4% saw no change in 2023, while 12% and 5.7%, respectively, reported a decrease. (See Figure 48.)
Looking forward, nearly three-quarters (74%) of park respondents expect the number of people using their facilities to increase in 2024, and 69.8% are expecting an increase in 2025.
There was very little change from 2023 to 2024 in the number of park respondents who report that they have plans for construction over the next several years. Nearly three-quarters (74.6%) of park respondents in 2024 said they were planning construction, representing virtually no change from 74.3% in 2023. This compares with 65.4% of non-park respondents in 2024 who have plans for construction.
Park respondents were most likely to be planning renovation to their existing facilities. More than half (55.3%) of park respondents in 2024 said they were planning renovations, up from 54% in 2023. Another 36.9% of park respondents were planning to build new facilities (up from 34.3%), and 31.5% were planning to make additions to their existing facilities (down from 36.7%). (See Figure 49.)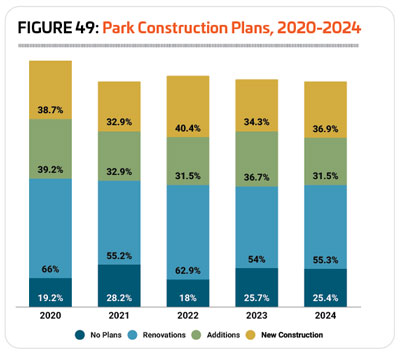
The median budget for construction spending for park respondents in 2024 was $2 million, double the median cost in 2023 of $1 million.
Other than some minor growth in their occurrence, there was no change to the top amenities included in park respondents’ facilities in 2024. The 10 most common park features in 2024 include: park shelters such as gazebos and picnic shelters (84.5% of park respondents had them, up from 80.7% in 2023); playgrounds (83.9%, virtually unchanged from 83.7%); park restroom structures (81.1%, up from 79.3%); walking and hiking trails (75.4%, up from 71.2%); outdoor sports courts for sports like basketball, tennis and, of course, pickleball (75.1%, up from 73.6%); open spaces like gardens and natural areas (73.3%, up from 67.9%); bleachers and seating (71.8%, up from 70.4%); natural turf sports fields (68.7%, down from 69.6%); classrooms and meeting rooms (66.1%, up from 62.5%); and concession areas (63.5%, virtually unchanged from 63.3%).
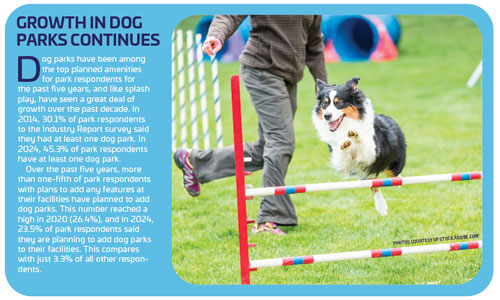
Park respondents in 2024 were much more likely to report that they had plans to add features at their facilities over the next few years than non-park respondents. Some 57.8% of park respondents in 2024 said they were planning to add features at their facilities, down from 62.6% in 2023, but up from 2022 (53.4%) and 2021 (48.6%). This compares with 38.8% of non-park respondents in 2024 who have plans to add features at their facilities, down from 39.3% in 2023, but still above 2022 (32.5%) and 2021 (29.8%).
The most commonly planned additions for park respondents in 2024 include:
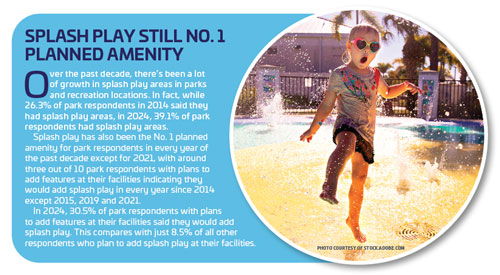
1. Splash play areas (planned by 30.5% of park respondents who will be adding features)
2. Dog parks (23.5%)
3. Fitness trails or outdoor fitness equipment (22.6%)
4. Park restroom structures (21.2%)
5. Walking and hiking trails (20.4%)
6. Playgrounds (19%)
7. Park shelters (18.6%)
8. Synthetic turf sports fields (16.8%)
9. Community gardens (16.4%)
10. Bike trails (16.4%)
Despite pickleball’s continuing popularity across the country, outdoor sports courts fell from the No. 8 to the No. 11 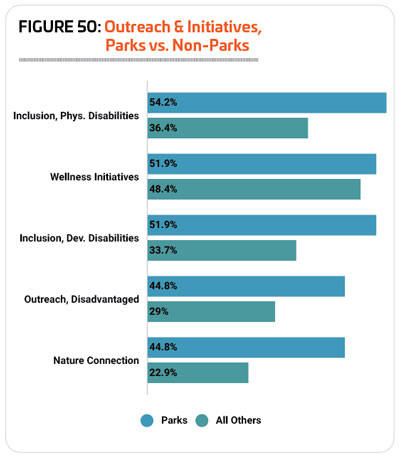 position, with 14.6% of park respondents who plan to add features planning outdoor sports courts, while community gardens rose to the 10th position on the list.
Park Programming
Park respondents were more likely than non-park respondents to report that they provide programming of any kind at their facilities. While 92.6% of non-park respondents host programming at their facilities, 98.7% of park respondents do so, up from 98% in 2023 and 97.7% in 2022.
The most common programs found in park respondents’ facilities in 2024 include: holiday events and other special events (89% of park respondents offer this type of programming, up from 87.8% in 2023); youth sports teams (75.7%, up from 74.2%); day camps and summer camps (68.4%, up from 66.8%); arts and crafts programs (68.1%, up from 62.3%); educational programs (66.8%, up from 62%); group exercise programs (64.8%, up from 60.8%); programs for active older adults (62.8%, virtually unchanged from 62.3%); festivals and concerts (59.1%, up from 56.7%); fitness programs (57.1%, down from 59.3%); and adult sports teams (56.5%, virtually unchanged from 56.7%).
Park respondents were more likely than non-park respondents to report that they had plans to add programming options at their facilities over the next few years. More than half (50.2%) of park respondents in 2024 said they had such plans, representing virtually no change from 2023 (50.6%), but up from 2022 (49.4%) and 2021 (44.8%). This compares with 38.8% of non-park respondents in 2024 who are planning to add programs, up from 37.5% in 2023, 29.4% in 2022 and 29.7% in 2021.
The most commonly planned additions to park respondents’ programming lineups in 2024 include:
1. Environmental education programs (up from No. 2)
2. Programs for active older adults (up from No. 4)
3. Fitness programs (up from No. 5)
4. Mind-body balance programs such as yoga and tai chi (up from No. 9)
5. Teen programs (down from No. 1)
6. Educational programs (down from No. 3)
7. Adult sports teams (up from No. 8)
8. Holiday events and other special events (did not appear in the top 10 for parks in 2023)
9. Group exercise programs (down from No. 7)
10. Arts and crafts programs (down from No. 6)
Holiday events and other special events replaced special needs programs, which fell in the No. 10 position in 2023.
Inclusion, Outreach, Conservation & Other Initiatives
We asked respondents to the Industry Report to gauge their involvement in a variety of different initiatives related to inclusion and outreach, wellness, and conservation, and park respondents were more likely than non-park respondents to be involved in every initiative measured.
The initiatives park respondents were most commonly involved in include: inclusion initiatives for individuals with physical disabilities (54.2% of park respondents, up from 48.3% in 2023, vs. 36.4% of non-park respondents); wellness initiatives (51.9%, up from 48.9%, vs. 48.4% of non-park respondents); inclusion initiatives for those with developmental disabilities (51.9%, up from 41.8%, vs. 33.7% of non-park respondents); outreach to economically disadvantaged populations (44.8%, up from 36.5%, vs. 29% of non-park respondents); and providing a connection to nature (44.8%, up from 41.5%, vs. 22.9% of non-park respondents). (See Figure 50.)
Park respondents were also at least 10% more likely to be involved in assistance with disaster recovery in the local community or region (35.7% of park respondents vs. 24.1% of non-park respondents), and resource conservation and green initiatives (32.7% vs. 14%). RM
