


In these pages, we’ll take a closer look at the answers provided by survey respondents whose facilities include aquatic elements. This includes any respondent who has at least one indoor or outdoor pool, splash play area, waterpark or hot tub.
In 2024, respondents were much more likely than usual to indicate that their facilities included aquatics. Some 62.5% of respondents indicated that their facilities included aquatics, up from 45.2% in 2023, 49.9% in 2022 and 54.6% in 2021.
Respondents from Ys were the most likely to include aquatics at their facilities. More than three-quarters (77%) of Y respondents said they included aquatic elements in their facilities. More than six out of 10 respondents from colleges (68.6%), parks (68%) and rec centers (60.2%) also included aquatics in their facilities. Less than half of respondents from schools (46.7%), camps (43.4%) and health clubs (36.2%) said they included aquatics at their facilities. (See Figure 34.)
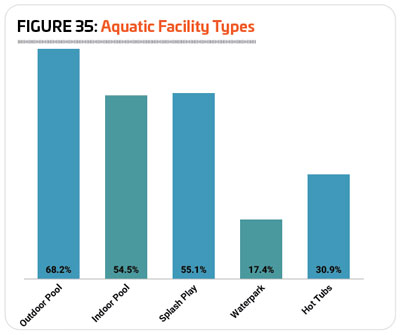
Of the different types of aquatic facilities covered by the Industry Report, the most common among aquatic respondents were outdoor swimming pools. More than two-thirds (68.2%) of aquatic respondents said they had at least one outdoor pool, up from 64.2% in 2023.
For the first time, splash play areas have become common enough to replace indoor swimming pools as the next most common type of amenity found among aquatic respondents’ facilities. Some 55.1% of aquatic respondents said they had at least one splash play area, up from 39.5% in 2023, and 42.3% in 2022. Indoor pools were found among 54.5% of aquatic respondents’ facilities, up from 51.3% in 2023. Around three in 10 (30.9%) aquatic respondents said they have at least one hot tub, spa or whirlpool, 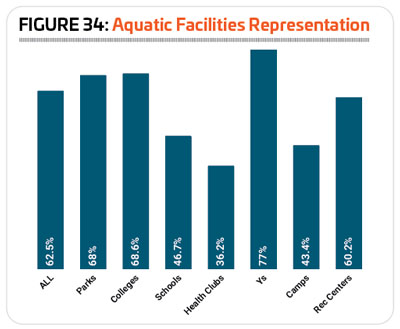 up from 29.2% in 2023. And 17.4% of aquatic respondents said they have at least one waterpark, up from 11.8% in 2023. (See Figure 35.)
Outdoor pools were most common among facilities located in the South Central region in 2024. Some 71.4% of South Central respondents said they had at least one outdoor pool. They were followed by the South Atlantic, where 69.8% of respondents said they had at least one outdoor pool, the West (67.9%), Midwest (64.5%) and Northeast (63.8%).
Indoor aquatic facilities reflected the opposite pattern, being most common in the Midwest and Northeast, and least common in the Southern regions. Some 68.7% of Northeastern respondents said they had at least one indoor pool, while 63.5% of Midwestern respondents had at least one indoor pool. They were followed by respondents in the West (56.2%), the South Central region (42.6%) and the South Atlantic (40%).
Splash play areas were again most common in the Western and South Central regions of the U.S., with 62% of Western respondents and 61.9% of South Central respondents reporting that they had at least one splash play area. They were followed by the South Atlantic (52.5%), the Midwest (49.4%) and the Northeast (45.2%).
Hot tubs, spas and whirlpools were also most commonly found among Western facilities, with 41.2% of Western respondents indicating they currently have at least one. They were followed by the Midwest (34.1%), the Northeast (27.5%), the South Atlantic (22.2%) and the South Central region (20.5%).
Waterparks were most common in the Midwest, where more than a quarter (26.2%) of aquatic respondents said they currently had at least one. They were followed by the West (14.3%), South Atlantic (13.7%) and South Central region (10.5%). Respondents in the Northeast (8.1%) were the least likely to have a waterpark.
Similarly, different types of aquatic facilities are also more common in specific facility types than others. For example, indoor pools might be more expected among YMCAs and university facilities, while splash play areas would be more likely to be found in a park.
Outdoor swimming pools were most commonly found among camp facilities. Nearly nine out of 10 (89.5%) of camp respondents with aquatics said they had at least one outdoor swimming pool. They were followed by parks, where more than three-quarters (78.7%) of aquatic respondents had at least one outdoor pool. More than half of aquatic respondents from health clubs (61.5%) and rec centers (57.7%) had at least one outdoor pool, and half (50%) of Y respondents had at least one outdoor pool. Respondents from schools (14.3%) were the least likely to have an outdoor pool, followed by respondents from colleges and universities (31.9%).
Indoor aquatic facilities, on the other hand, were most common for aquatic respondents from Ys, schools, colleges and health clubs. Some 92.3% of Y respondents with aquatics had at least one indoor pool, along with 91.7% of school respondents, 91.2% of college respondents and 87.5% of health club respondents. Some 61.8% of rec center respondents with aquatics also had at least one indoor pool. On the other end of the spectrum, just 10.5% of camp respondents with aquatics and 37.6% of park respondents with aquatics had at least one indoor swimming pool.
Splash play areas were most popular with park respondents, where 71.6% indicate that they currently have at least one splash play area. This is up from 63.2% in 2023. They were followed by rec centers (64.7%).
Respondents from rec centers and parks were the most likely to have waterparks. Some 20% of rec center respondents with aquatics and 19.3% of park respondents with aquatics said they have at least one waterpark.
Finally, hot tubs, spas and whirlpools were most common for respondents from health clubs. Some 85.7% of health club respondents with aquatics said they had at least one hot tub at their facilities. More than ha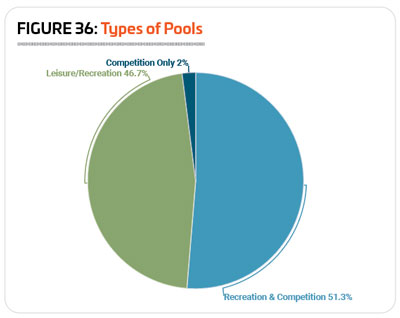 lf of aquatic respondents from Ys (51.5%) had at least one hot tub. Fewer respondents from colleges (44.4%), rec centers (34%), camps (17.6%) and parks (17.1%) had at least one hot tub, and no respondents from schools had a hot tub.
Aquatic facilities were fairly evenly divided between those used for a combination of recreation and competition, and those used for recreation only. Just 2% of all aquatic facilities are used just for competition. More than half (51.3%) are used for a combination of recreational and competitive activities, and another 46.7% are used for recreation only. (See Figure 36.)
All of the competition-only pools were found at schools, colleges and Ys. Some 15.4% of aquatic respondents from schools, 8.2% of those from colleges and 2.6% of those from Ys said their pools were used for competition only.
Respondents from Ys were the most likely to indicate that their aquatic facilities are used for a combination of recreation and competitive activities. More than seven out of 10 (71.8%) Y respondents with aquatics said their facilities were used for both leisure and competition. They were followed by respondents from schools and school districts (69.2% used their pools for both recreation and competition), parks (53.1%) and colleges (52.5%). Camp respondents were the least likely to use their pools for a combination of recreation and competition, with just 11.1% of camp respondents indicating this is the case for their aquatic facilities.
The other 88.9% of camp respondents’ aquatic facilities were used for recreation only, making them by far the most likely to feature aquatic facilities for recreational purposes alone. They were followed by health clubs (52.9%) and rec centers (52.7%). Respondents from schools (15.4%) and Ys (25.6%) were the least likely to use their aquatic facilities for recreation only.
Expenditures & Funding
In 2023, respondents whose facilities include aquatics spent 131.3% more on their overall operating budgets than those with no aquatic elements at their facilities. Aquatic respondents had an average overall operating budget of $4,790,000 in 2023, compared with $2,071,000 for non-aquatic respondents.
Over the next two years, aquatic respondents expect their overall operating expenses to grow at a much slower rate than non-aquatic respondents. Aquatic respondents projected an average overall operating budget for 2025 of $4,848,000, an increase of 1.2% from 2023’s average. At the same time, non-aquatic respondents expect their overall operating budget to increase by 9.7%, to an average of $2,271,000.
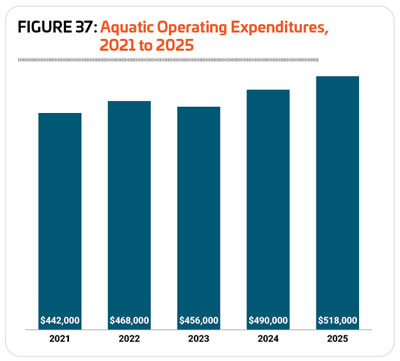
When it comes to the cost of the aquatic side of their operations, there was a 2.6% decrease from 2022 to 2023, from an average of $468,000 to an average of $456,000.
Looking forward, aquatic respondents expect their aquatic operating expenditures to increase by 13.6% between 2023 and 2025, to an average of $518,000. (See Figure 37.)
Respondents from rec centers and health clubs reported the greatest average operating cost for 2023. Rec center respondents were the biggest spenders on aquatic operations with an average budget of $834,000, with the highest reported cost at $5 million and the median cost at $350,000. They were followed by health clubs, with an average aquatic operating cost of $821,000, reflecting a high of $3.5 million and a median cost of $335,000.
Ys, parks and camps fell in the middle of the aquatic cost range. Y respondents spent an average of $492,000 on their aquatic operations in 2023, reflecting a high of $3 million and a median of $237,500. Park respondents spent an average of $464,000, reflecting a high of $6.2 million and a median cost of $210,000. And camp respondents spent an average of $384,000, reflecting a high of $2.5 million and a median of $10,000.
Respondents from schools and colleges had the lowest aquatic operating costs in 2023. School respondents spent an average of $240,000 on their aquatic operations in 2023, reflecting a high of $965,000 and a median cost of $55,000. College respondents spent an average of $163,000, with a high of $1.1 million and a median cost of $87,500.
From 2023 to 2025, respondents from camps and health clubs projected the greatest increase to their aquatic operating expenditures. Respondents from camps reported an increase of 54.9%, to an average of $595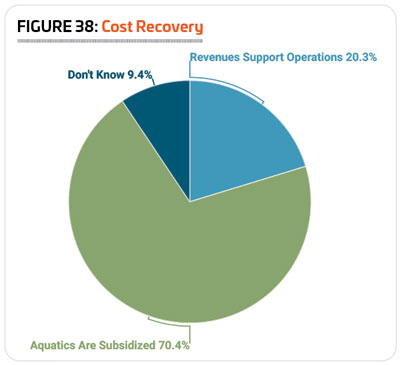 ,000, while health club respondents expect a 41.3% increase to an average of $1,160,000 in 2025.
Double-digit increases were also expected by respondents from schools (up 22.9% to an average of $295,000 in 2025), colleges (up 14.7% to an average of $187,000), and parks (up 13.6% to an average of $527,000). Rec centers expected a 7.8% increase in operating budgets from 2023 to 2025, to an average of $899,000. And Y respondents actually projected a decrease, with average operating budgets falling 5.9% to $463,000 in 2025.
From 2022 to 2023, 48.9% of aquatic respondents said their aquatic revenues increased, while 39.2% reported no change and 12% reported a decrease. This is an improved performance from the previous year, as 17.7% reported a decrease in aquatic revenues from 2021 to 2022, with 44.6% reporting an increase and 37.7% reporting no change.
Respondents from Ys (68.8%) and health clubs (64.3%) were the most likely to report that their aquatic revenues increased from 2022 to 2023. They were followed by rec centers, where 58.1% reported increasing revenues in 2023.
In 2024, well over half (55.9%) of aquatic respondents said they expect their aquatic revenues to increase. Another 39.2% said they expect no change to revenues, and 4.9% are anticipating a decrease in aquatic revenues.
Respondents from Ys (78.1%) and health clubs (69.2%) were the most likely to be expecting an increase in aquatic revenues in 2024. They were followed by parks (59.1%) and rec centers (55.8%).
Looking forward, a majority (62.1%) of aquatic respondents said they expect their aquatic revenues to remain unchanged between 2024 and 2025. Just over a third (34.5%) said they expect aquatic revenues to inc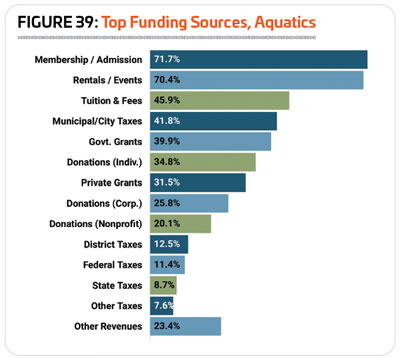 rease in 2025, and 3.4% are anticipating a decrease.
In 2024, just over one-fifth (20.3%) of aquatic respondents reported that their aquatic operations are supported by aquatic revenues. This is down from 2023, when 25.3% of respondents said the same. Another 70.4% of respondents said their aquatic facilities are subsidized via funding from other sources, up substantially from 54.1% in 2023. Another 9.4% were unsure whether their aquatic revenues supported their aquatic operations. (See Figure 38.)
Respondents from health clubs and Ys were the most likely to report that their aquatic costs were paid for via aquatic revenues. Some 41.2% of health club respondents and 35.9% of Y respondents said their aquatic revenues covered their aquatic costs.
On the other hand, respondents from parks, rec centers and colleges were the most likely to report that their aquatic operating costs are subsidized via funding from other sources. More than three-quarters (76.3%) of park respondents, along with 73.1% of rec center respondents and 70.5% of college respondents said their aquatic operations were subsidized with funding from other sources.
The most common source of funding for aquatic facilities in 2024 was membership and admission fees. Some 71.7% of aquatic respondents said that membership or admission fees were a source of funding for their facilities. This compares with 54.1% of non-aquatic facilities. More than seven out of 10 aquatic respondents (70.4%) also received funding via facility rentals and private events. This compares with 59.5% of non-aquatic facilities. Other common sources of funding for aquatic facilities included: tuition and fees (45.9% vs. 31.4% of non-aquatic respondents); municipal or city taxes (41.8% vs. 31.4%); and government grants (39.9% vs. 33.6% of non-aquatic respondents). (See Figure 39.)
More than a quarter of aquatic facilities also received funding via: private donations from ind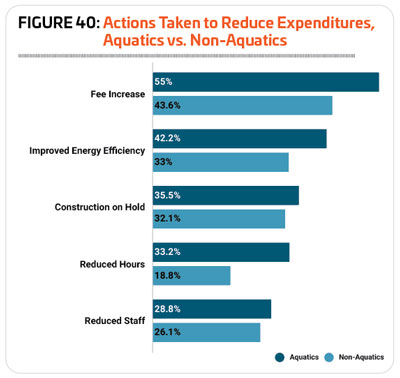 ividuals (34.8%), private grants (31.5%), and corporate donations (25.8%).
Respondents with aquatic facilities were again more likely than those without aquatics to report that they had taken action to reduce their costs over the past few years. Nearly nine out of 10 (87.4%) aquatic respondents said they had taken such action (similar to last year’s number, 87.1%, but down from 90.1% in 2022), compared with 76.1% of non-aquatic respondents (down from 79.8%).
The most common methods aquatic respondents turned to in order to reduce their costs were: increasing their fees (55%, compared with 43.6% of non-aquatic respondents); improving energy efficiency (42.2% vs. 33%); putting construction or renovation plans on hold (35.5% vs. 32.1%); reducing their operating hours (33.2% vs. 18.8%); and staff reductions (28.8% vs. 26.1%). (See Figure 40.)
Programming
Most aquatic respondents—86.3%—said they currently provide aquatic programming at their facilities, representing virtually no change from 2023 (86.9%). This includes everything from basic learn-to-swim programs to aquatic exercise and aqua-therapy, swim meets, water polo and more.
A full 100% of aquatic respondents from Ys and schools said they currently include aquatic programs at their facilities. More than nine out of 10 respondents from colleges and universities (95.2%) and from health clubs (94.1%) provided programs at their facilities. Fewer respondents from parks (83.8%), camps (76.2%) and rec centers (73.4%) included aquatic programming at their facilities.
The top 10 most common aquatic programs in 2024 were:
1. Leisure swim (90.9%)
2. Lap swim (81.5%)
3. Learn-to-swim for children (79.9%)
4. Lifeguard training (77.1%)
5. Aquatic exercise programs (68.5%)
6. Water safety programs (59.1%)
7. Learn-to-swim for adults (58.2%)
8. Youth swim teams (54.7%)
9. Swim meets and competitions (50%)
10. Special needs aquatics programs (33.4%)
Only leisure swim time saw virtually no change from 2023 to 2024, with every other program type increasing by at least two percentage points. The greatest increase was seen in lap swim time, up 8.4 percentage points to 81.5%. That was followed by aquatic exercise programs (up 6 percentage points), youth swim teams (up 5.4), learn-to-swim for adults (up 5.3), water safety programs (up 4), lifeguard training (up 3.8), swim meets and competitions (up 3.7), learn-to-swim for children (up 3.3), and special needs aquatic programs (up 2.3).
Ys are well known for their quality aquatic programming, with a focus on swim lessons, water safety and lifeguard training. Thus it comes as no surprise that Ys continue to offer the most different types of aquatic programming. Y respondents were the most likely to provide learn-to-swim for children (in fact, 100% of Y respondents provide swim lessons for kids!), leisure swim time, lifeguard training, aquatic exercise programs, water safety programs, learn-to-swim for adults, youth swim teams, and special needs aquatic programs.
Respondents from health clubs were the most likely to provide lap swim time, with 100% of health club respondents indicating they set aside time for lap swimming. They also were the most likely to provide aqua-therapy, with 68.8% of health club respondents indicating they offer this option at their facilities.
Respondents from schools and school districts were the most likely to host swim meets and competitions, with 76.9% of these respondents indicating that they host these types of events at their facilities. They also were the most likely to have diving programs and diving teams, and adult swim teams.
Colleges and universities were the most likely to have school/collegiate swim teams, as well as water polo programs.
One-quarter (25%) of aquatic respondents said they were planning to add aquatic programs at their facilities over the next few years. This is up from 22.6% in 2023 and 21% in 2022.
Respondents from Ys were the most likely to be planning to add more aquatic programs at their facilities. Some 41% of Y respondents had such plans, up from 28.6% in 2023. They were followed by health clubs, where 29.4% were planning to add aquatic programs (up from 8.3% in 2023), colleges (28.6%, down from 29.6%) camps (28.6%, up from 8.5%), rec centers (23.4%, down from 25%), and parks (22.2%, down from 24.3%). Respondents from schools were the least likely to be planning aquatic program additions, with 15.4% indicating they had such plans, down substantially from 32% in 2023.
The 10 most commonly planned aquatic programs in 2024 were:
1. Special needs aquatics programs (planned by 39.5% of those who will be adding programs, up from 30.8%)
2. Aquatic exercise programs (33.1%, up from 27.7%)
3. Learn-to-swim for adults (27.4%, virtually unchanged from 27.7%)
4. Learn-to-swim for children (21%, down from 26.9%)
5. Aqua-therapy (20.2%, up from 19.2%)
6. Lifeguard training (18.5%, down from 21.5%)
7. Water safety programs (15.3%, down from 20%)
8. Youth swim teams (14.5%, down from 19.2%)
9. Swim meets and competitions (14.5%, down from 19.2%)
10. Adult swim teams (13.7%, down from 14.6%)
Respondents from rec centers were the most likely to be planning to add special needs aquatic programs, with 46.7% indicating that they had such plans. They also were the most likely to be planning to add lap swim time.
Half of respondents from camps, colleges and schools had plans to add aquatic exercise programs at their facilities. Camp respondents were also the most likely to be planning to add swim lessons for children, lifeguard training and leisure swim time. Respondents from colleges were also the most likely to be planning to add water safety programs, while schools were the most likely to be planning to add adult swim teams and school swim teams.
Respondents from health clubs were the most likely to be planning to add swim lessons for adults, and parks were the most likely to be planning to add aqua-therapy, youth swim teams, swim meets and competitions, diving programs and diving teams, and water polo.
Aquatic Facilities – Construction & Amenities
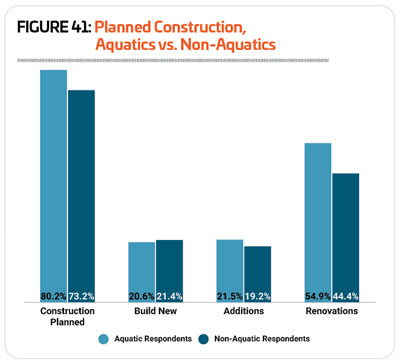
More than eight out of 10 (80.2%) aquatic respondents in 2024 said they were planning construction at their facilities over the next several years. This is well up from 2023, when 66.8% of aquatic respondents had such plans. Aquatic respondents in 2024 were more likely than non-aquatic respondents to have plans for construction, with 73.2% of non-aquatic respondents indicating that they were planning construction, up from 63.7% in 2023.
While they were more likely than non-aquatic respondents to be planning construction of any kind, aquatic respondents were less likely to have plans to build new facilities. Some 20.6% of aquatic respondents said they were planning new facilities, compared with 21.4% of non-aquatic respondents. When it comes to making additions to their existing facilities, 21.5% of aquatic respondents had plans, compared with 19.2% of non-aquatic respondents. Well over half (54.9%) of aquatic respondents said they were planning renovations to their existing facilities over the next several years, compared with 44.4% of non-aquatic respondents. (See Figure 41.)
Looking at the median budgets for construction spending, aquatic respondents were planning to invest a great deal more in their construction projects than non-aquatic respondents. The median construction budget for aquatic respondents in 2024 was $2 million, compared with $500,000 for non-aquatic respondents.
The top 10 features covered by this survey that were most commonly found among aquatic respondents’ facilities in 2024 include:
1. Pool lifts and accessibility equipment (found among 73.5% of aquatic respondents’ facilities, up from 71.1% in 2023)
2. Automatic chemical feeders (72.3%, up from 71.1%)
3. Diving boards (49.1%, virtually unchanged from 49.5%)
4. Zero-depth entry (43.7%, up from 42.1%)
5. Waterslides (40.6%, up from 37.7%)
6. Water play structures (37.3%, up from 32%)
7. Splash pads (32.2%, up from 25.4%)
8. UV disinfection systems (29.3%, up from 24.3%)
9. Variable speed pump (23.2%, up from 21.2%)
10. Pool inflatables (17.6%, representing virtually no change from 17.9%)
Aquatic respondents from park facilities were more likely than others to include waterslides (54.8% of park respondents had waterslides), zero-depth entry (53.3%), water play structures (47.7%), splash pads (43.7%), and poolside cabanas (18.1%).
School respondents were the most likely to include diving boards (76.9% had them), ozone systems (15.4%), AOP (advanced oxidation process) systems (15.4%), and pool obstacle or ninja courses (7.7%).
College respondents were more likely than others to include surf machines, with 1.8% indicating they had them.
Aquatic respondents from health clubs were the most likely to include variable speed pumps (26.7% had them), and saline chlorination systems (26.7%).
Y respondents were more likely than others to include pool lifts and accessibility equipment (89.2% had them), and automatic chemical feeders (83.8%).
Respondents from camps were the most likely to have pool inflatables (47.1% had them), and solar pool heating (11.8%).
Finally, rec center respondents were the most likely to include UV disinfection systems (42.9% had them), lazy rivers (26.5%), variable frequency drives (22.4%), poolside climbing walls (12.2%), and wave pools (4.1%).
More than a quarter (25.6%) of aquatic respondents in 2024 said they had plans to add features to their aquatic facilities over the next several years, up from 22.5% in 2023. Aquatic respondents from camps and parks were the most likely to have such plans. Some 42.9% of camp respondents and 29.5% of park respondents with aquatics said they would be adding aquatic features at their facilities. They were followed by rec centers (20.3%), Ys (17.9%), health clubs (17.6%) and colleges (12.7%). No school respondents had plans to add any aquatic features covered by the survey to their facilities in the next few years.
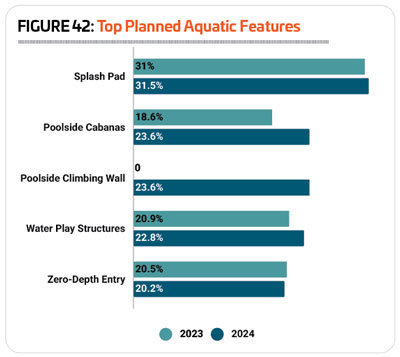
The most commonly planned addition for aquatic facilities in 2024 was again splash pads. Some 31.5% of aquatic respondents with plans to add any features to their facilities said they would be adding splash pads, up from 31% in 2023, 29.9% in 2022 and 27.4% in 2021. Other commonly planned additions for aquatic facilities included: poolside cabanas (23.6% were planning to add them, up from 18.6% in 2023), poolside climbing walls (23.6%, up from zero with such plans in 2023), water play structures (22.8%, up from 20.9%) and zero-depth entry (20.2%, representing virtually no change from 20.5% in 2023). (See Figure 42.) RM
